Jun 01, 2018
Creating Reports with Power BI Custom Visuals
Power BI Custom Visuals: The Way to Create Outstanding and Comprehensible Reports If your job description involves anything related to data analysis or...
Power BI Custom Visuals: The Way to Create Outstanding and Comprehensible Reports If your job description involves anything related to data analysis or...
Power BI Custom Visuals: The Way to Create Outstanding and Comprehensible Reports
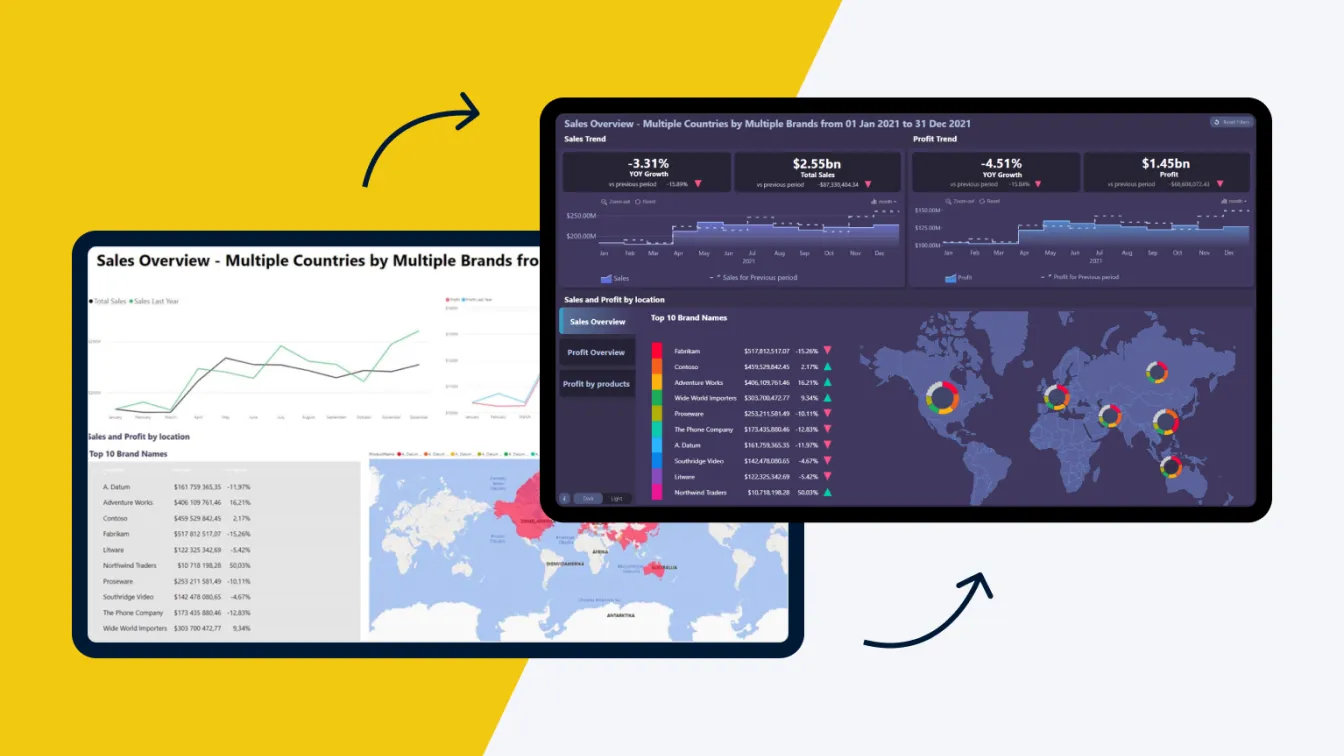
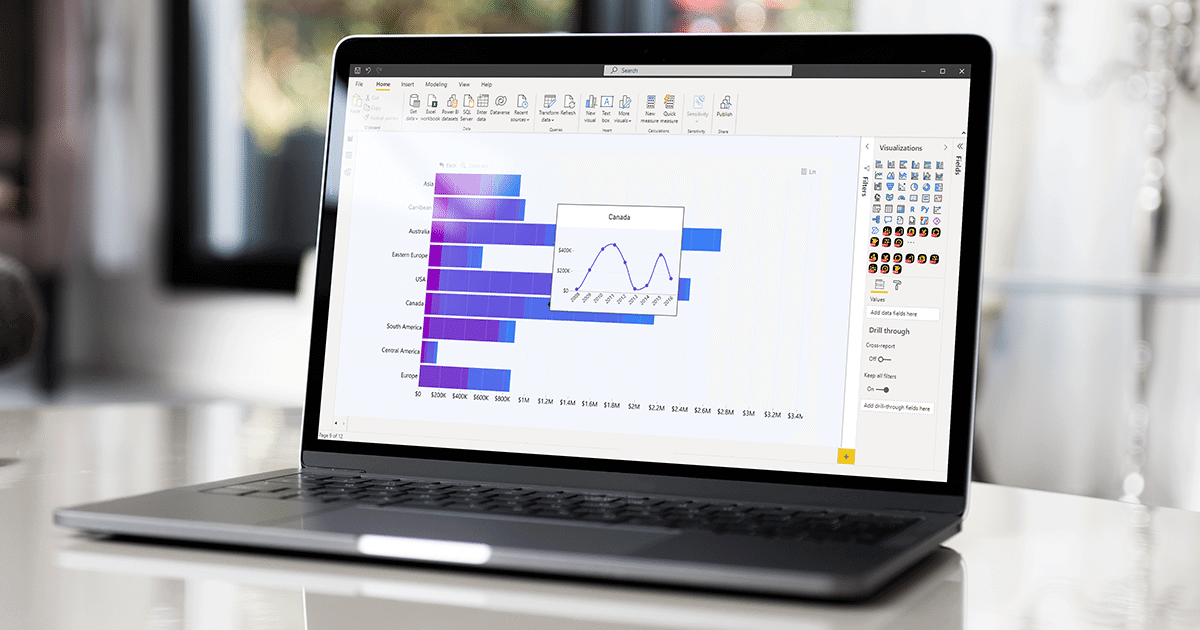
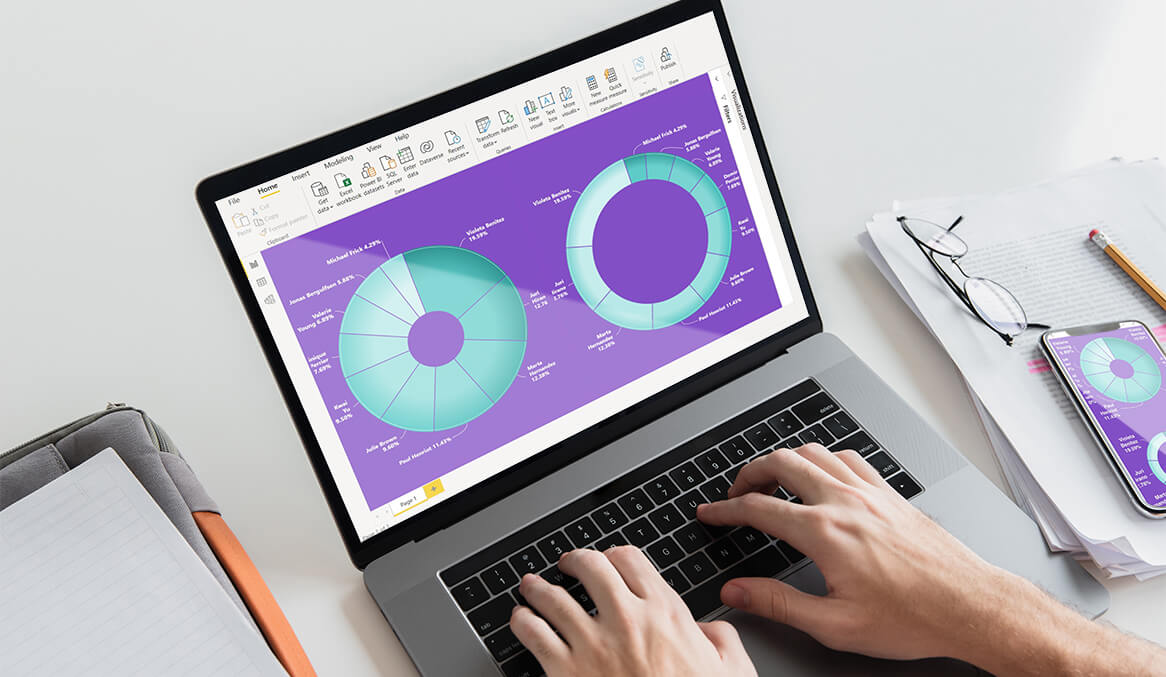
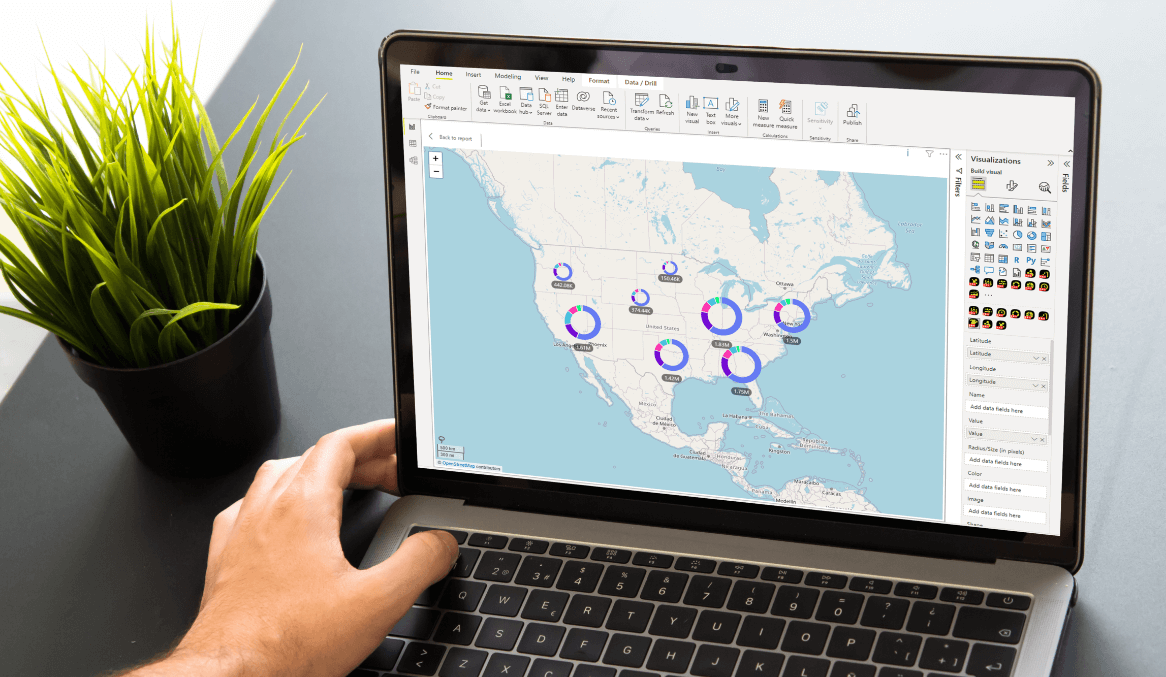
If your job description involves anything related to data analysis or exploration, it is no doubt that you have tried out different visuals while creating and editing reports in Microsoft Power BI. You can access those native visuals in the visualisation panel of Power BI desktop and web version as they are included in the default package of Power BI. While all those different charts and graphs allow you to visualise your data, that is not the limit to what Power BI can offer. Yes, we’re talking about Power BI custom visuals.
What Are Power BI Custom Visuals?
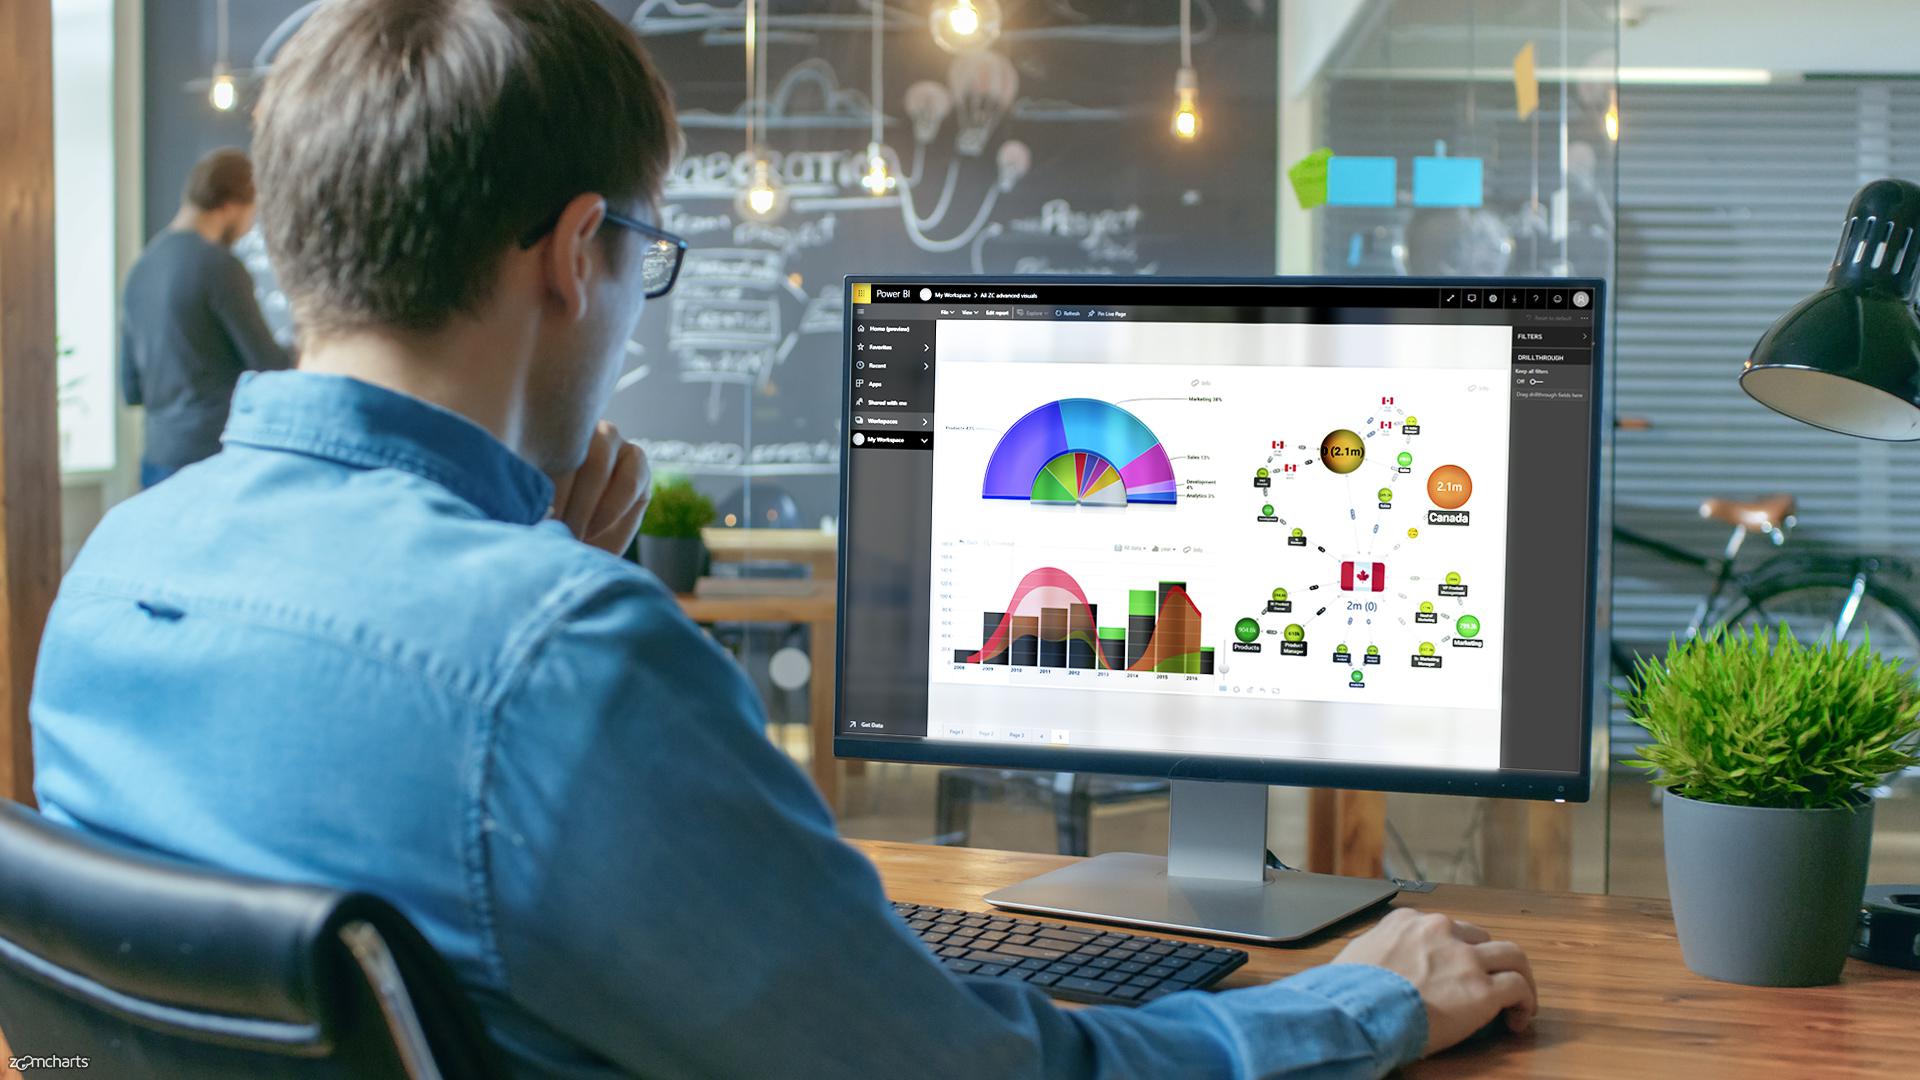
To explain shortly, Power BI custom visuals are created by developers using the custom visuals SDK. The goal of these visuals is to enable users to visualise their data in the most convenient and effective way for their business. Custom visuals can be imported into your report from the marketplace and you can use them as any other Power BI visual. There is nothing wrong with sticking to the standard set of visuals available on Power BI; however, with custom visuals you will be able to explore data in never-before-seen ways and add that extra touch to your report.
Benefits of Custom Visuals
Data visualization plays an important role in the way you explore your data in order to provide actionable insights. Businesses are constantly generating large volumes of data and it has become very challenging to present this data in a way that will make sense to the end users. Perhaps, that is the reason why Microsoft Power BI has taken some groundbreaking steps to innovate data visualization in a way that is beneficial for both developers and end users. It has been done by providing a platform for the third parties to contribute to the development of custom visuals.
Today custom visuals have a significant role in the BI ecosystem, business intelligence advancement, and Development Communities in numerous ways as described below:
1. They are eye-catching and attractive
Custom visuals have made data enticing, recognizable, informative, and contextual.
2. They are engaging
It has become easier to view the visuals and spend time exploring data, soaking up information they provide, and discovering insights.
3. They are helping to make sense of data
Custom visuals have been developed by keeping in mind that our understanding of data largely depends on how we perceive the information visually.
4. They are enriching the visualisation palette
Custom visuals encourage report creators to become artists who develop data-driven scenarios by creating appealing representations of data.
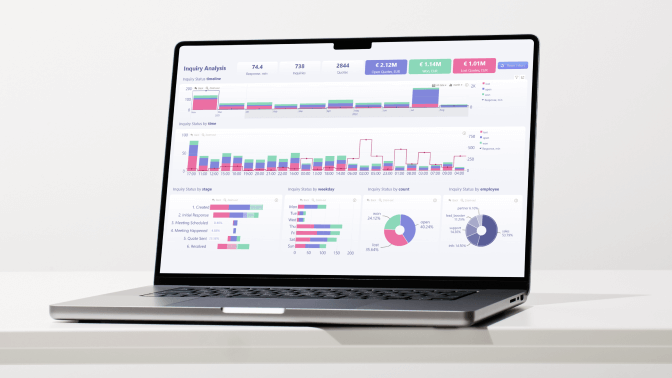
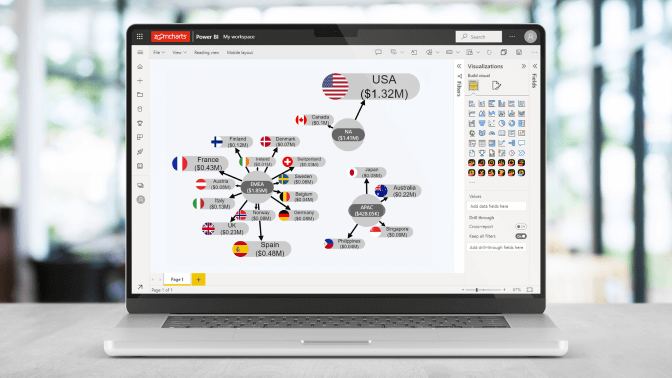
Custom Visuals by ZoomCharts - Innovation and Interactivity at Your Fingertips
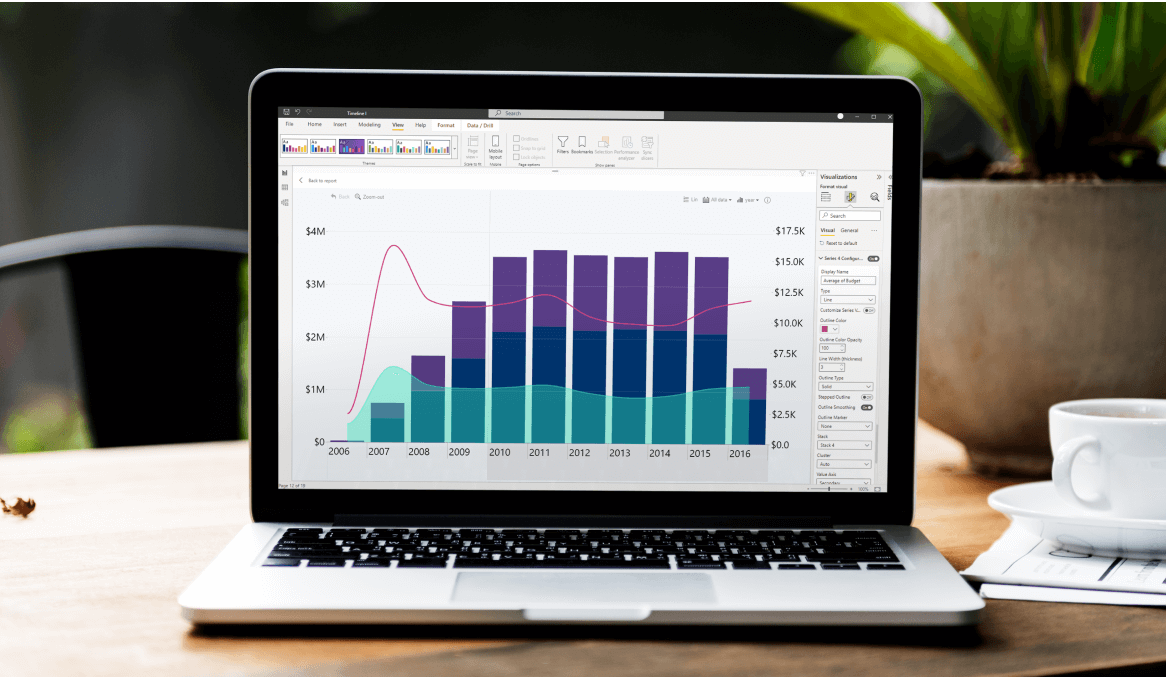
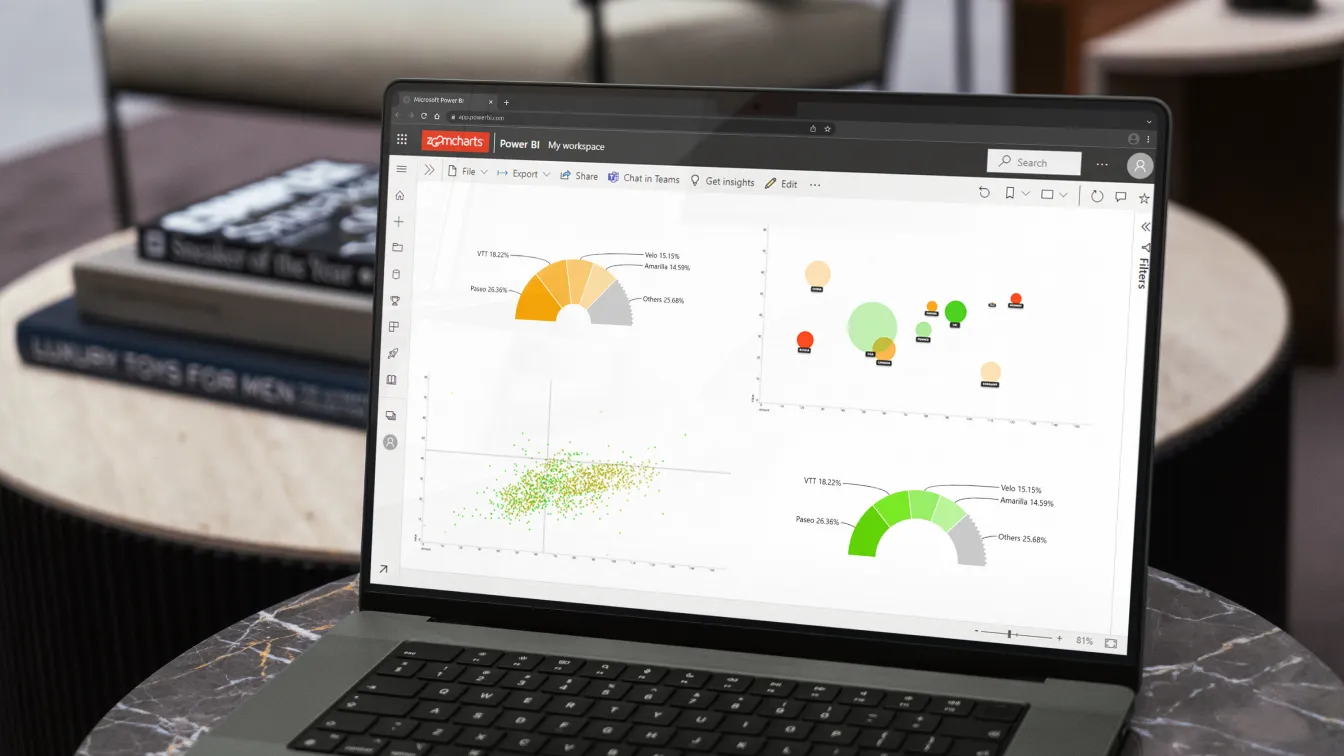
We understand the importance of presenting your data in a comprehensible and engaging way. Therefore, our visuals enable Microsoft Power BI users to explore, present and analyze their data in the most attractive and comprehensible manner. In addition to the aesthetically pleasing appearance of the visuals, they also provide provide full multi-touch support to make interaction seamless and convenient across all the devices you are using.
By developing our visuals, we have made the transition from static data representation to a form which is fully interactive and provides dynamic user experience. You can interact with any ZoomCharts visual with the help of a simple touch, swipe, click, or a pinch. This means that more can be achieved with less actions and you can easily analyze and present your data on any device by using animated drill-down, drill-up and zoom functions.
We believe that your dashboard is not a place that should look crowded - that is why our visuals are designed in a way that lets you explore more data within less space thanks to the possibility to add multiple dimensions to a single visual. In addition to that you can customize our visuals to make sure they meet your requirements and reflect your company style.
Your Time to Explore Custom Visuals
Whether you are a proficient user or have just started your journey towards excellence in Microsoft Power BI, we encourage you to try out Power BI custom visuals. It is a great opportunity to bring something new into your reports and make data exploration a truly enjoyable experience.

Want more info like this?
Subscribe to our newsletter and be the first to read our latest articles and expert data visualization tips!