Participate in challenges

Win prizes, build a professional portfolio, and become a star!

Best Visuals for Power BI Pro Reports

Better Reports. Better Control

Start Free Request a Quote
MS Gold Partner
Chevron Apple P&G HP Microsoft +1000 More clients

Best Visuals for Power BI Pro Reports

Better Reports. Better Control

MS Gold Partner

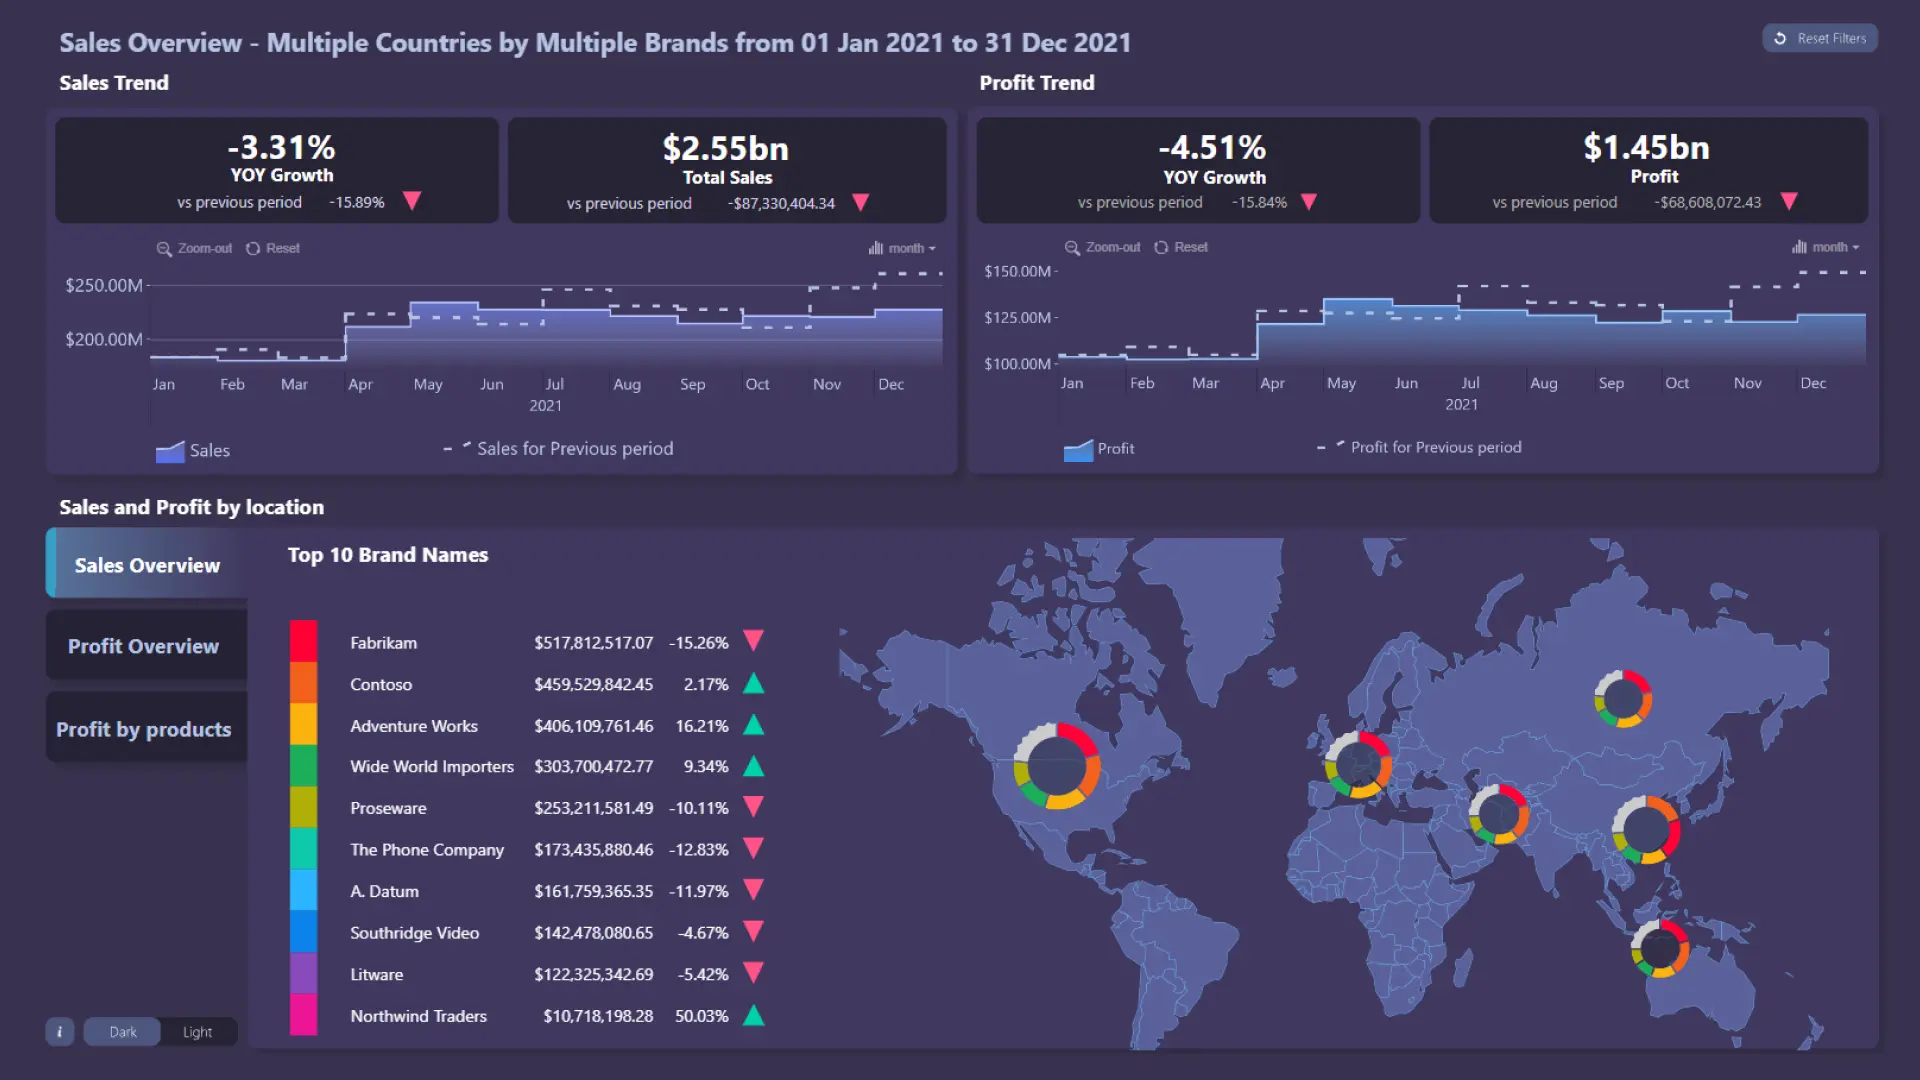
Add ZoomCharts Drill Down custom visuals to your Power BI reports to make data navigation easy, fast, and exciting.

Drill Down custom visuals will let you tell an engaging data story that keeps end users hooked until the last moment.

Achieve more

See how ZoomCharts custom visuals will benefit you

Full customization

Full customization

Have full control over the way you visualize your data and push the limits of Power BI reports as you know them.

Greater data storytelling

Immersive Data Storytelling

Create reports that your users will love to explore! Visualize the big picture and immerse your users in a compelling data story.

Improve UX with our Interactions

Improved User Experience

Make data analytics more inclusive and user-friendly with intuitive and easy-to-learn user interactions that support mouse and touch input.

Better data driven decisions

Faster & Better Insights

Save your users’ time with reports that reveal actionable insights in just a few clicks and visualize data from multiple perspectives for better-informed decisions.

Live Demo

Try out the example report and experience our interactive custom visuals in action!

ZoomCharts Drill Down Visuals

See the main features of each custom visual

Drill Down Waterfall PRO

  • Sub-totals let you set display values in dataset or let the visual calculate them automatically
  • Create a custom sequence for the series
  • Support for dynamic thresholds (avg, median, percentiles)
  • Customize increasing, decreasing, and totals series separately
Learn More

Drill Down Combo Bar PRO

  • Multiple chart types (Column/Line/Area)
  • Rich customization options
  • Static and dynamic thresholds
  • Stacking and clustering capabilities
Learn More

Drill Down Combo PRO

  • Multiple chart types (Column/Line/Area)
  • Rich customization options
  • Static and dynamic thresholds
  • Stacking and clustering capabilities
Learn More

Drill Down Donut PRO

  • Adjustable “Others” and “Previous” slice
  • Fully customize every slice, label, and legend
  • Explore up to 9 data levels
  • Multiple chart types (Pie/Donut/Gauge)
Learn More

Drill Down Pie PRO

  • Adjustable “Others” and “Previous” slice
  • Fully customize every slice, label, and legend
  • Explore up to 9 data levels
Learn More

Drill Down Graph PRO

  • Automated graph construction
  • Visualize relations using bi-directional links
  • Force feedback layout
  • Group nodes with auras
Learn More

Drill Down Network PRO

  • Force feedback layout
  • Category based customization
  • Legend support, show up to 9 data categories
  • Link decorations
Learn More

Drill Down TimeSeries PRO

  • Static and dynamic thresholds
  • Multiple chart types (Column/Line/Area) with stacking and clustering capabilities
  • Automated data aggregation on multiple time charts
  • Easy time-period selection on X-Axis
Learn More

Drill Down Timeline PRO

  • Support for DAX calculated measures
  • Create a custom sequence for the series
  • Support for dynamic thresholds (avg, median, percentiles)
  • Customize increasing, decreasing, and totals series separately
Learn More

Drill Down Map PRO

  • Node clustering, clusters can be turned into pie charts that show categories
  • Supports up to 10 different shape layers (built-in, GeoJSON, KML)
  • Multiple filtering options (nodes, clusters, shapes)
  • Image support for nodes
Learn More

Customer Stories

Here’s what other ZoomCharts customers had to say

Kingston
Grant Thornton
SEB
SEB
Customer Stories Customer Stories

They deliver value and efficiency for our decision-making process.

“We use ZoomCharts Power BI visualizations as we have found that they are delivering the value and efficiency for our decision-making process during which we analyze and visualize underlying connections between different data points in our databases. We are very satisfied with the customer service level that ZoomCharts is delivering to our team.”

Gints Lazdiņš, Customer Analytics and Engagement manager, SEB

Customer Stories Customer Stories

The backup and support are top-class professionals.

“My experience with ZoomCharts has been very positive. In terms of build and design, I have found it easy and effective, my users always comment on how simple and impressive ZoomCharts visuals are on Dashboards. The backup and support are top class professionals and can never do too much in terms help and development. I would recommend ZoomCharts Visuals for any Power BI Development.”

Joseph Lancaster, Data Analyst (Finance), Grant Thornton

Customer Stories Customer Stories

What usually takes a lot of time to set up is now only done once.

“It is amazing being able to organize information in such an easy-to-view way. Everybody in our department is pleased to have these visuals to understand what is happening in our business and take fast well-informed decisions. What usually takes a lot of time to set up, now is only done once and we can easily manipulate information and go as deep as we need to take decisions. Overall, we are very pleased and happy using them.”

Kingston (feedback from several PBI team members)

ZoomCharts Blog

Read comprehensive guides for our visuals, get inspiration from practical use cases and learn expert tips on data visualization in our blog!

Contact us

We’re happy to provide you with additional information and answer any questions you might have regarding our products

Request a quote

Contact a ZoomCharts team member to receive a quote.

Chat with us

Send us a message and we'll answer as quickly as possible.