Aug 30, 2021
Business Intelligence Implementation: A Complete Guide
It's no secret that the leading organizations of the world don't take any chances when it comes to business strategy - they use business intelligence to make data-driven decisions. Just like a sports team needs a coach or an army needs a strategist to achieve victory, your can reach your business goals more efficiently with the help of a robust BI system and expert BI analysts.

It's no secret that the leading organizations of the world don't take any chances when it comes to business strategy - they use business intelligence to make data-driven decisions. Just like a sports team needs a coach or an army needs a strategist to achieve victory, your can reach your business goals more efficiently with the help of a robust BI system and expert BI analysts.
What is Business Intelligence (BI)?
Business intelligence, simply put, is an umbrella term encompassing the various tactics and strategies used by businesses to analyze, as you may have guessed, business information.
How does this work? Data analytics tools and BI platforms help by processing large data sets from data sources such as data warehouses or data-marts and visualize the findings with the help of reports, dashboards, tables and data visualizations that are easy to read and gain valuable insights from.

In short, there are tons of data that companies generate and collect every day. Everything like finances, expenses, inner workings, outer processes, client actions and much more can be turned into a dataset of valuable information. Most companies (and even governments) don't really understand the full implications and potential of this data, because it can just look so vast upon first viewing.
But to get a hold of this valuable information, and to gain insights from it, business technologies and platforms are continuously being developed that help the analysis process. It's the best approach to organising your company's inner and outer operations, see the bigger picture of its progress, and even act as incentive for future decisions.
What does Business Intelligence (BI) do?
Business intelligence (BI) serves many companies in very different fields, such as Microsoft or the Coca-Cola Bottling Company, that use business intelligence to make major market, product and service, and daily operational decisions, using the help of data science.
The goal of business Intelligence initiatives is to drive better business decisions that enable organizations to become more rational. They enable a company to leverage objective data, logic, and analysis. You lose the need to use subjectivity and intuition to help identify a problem, pick a solution from multiple options, and arrive at a final answer.
The functions of a business becoming more rational include reporting, online analytical processing, dashboard development, data mining, business performance management, and much more. BI tools perform data analysis and create reports, summaries, dashboards, maps, graphs, and charts to provide users with detailed intelligence about the nature of the business.
What are the benefits of Business Intelligence (BI)?
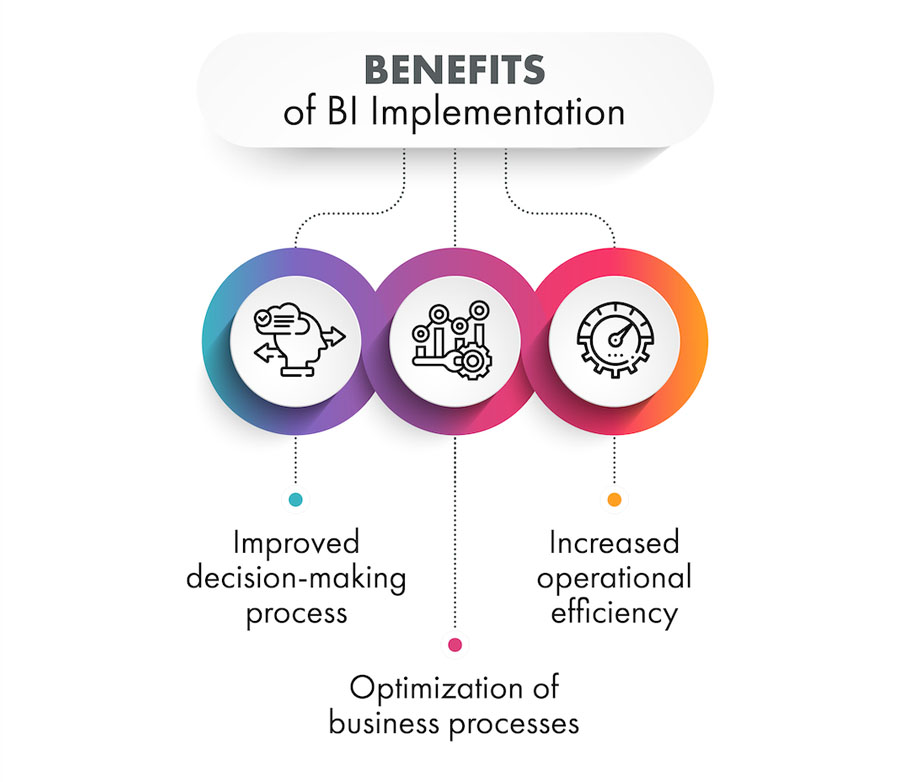
For starters, business intelligence (BI) technologies can identify new opportunities and effective strategies that provide businesses with a competitive advantage. They increase revenue, improve operational efficiency and gain competitive advantages over business rivals.
So, we can see that good business intelligence (BI) implementation not only leads to better business insights, but it also increases a company's profitability, competitive advantage, and accelerates overall growth.
Business intelligence (BI) also helps company optimization and organization in the decision-making process, internal and client-facing business processes, and an increase in operational efficiency by easily identifying ineffective business processes.
What we end up with is a synthesis of external and internal company data. This provides a more complete picture of the impact of various business strategies that a singular set of data simply fails to deliver. We arrive at a single version of the truth that takes into account all of the company's processes.
What to look for in your Business Intelligence (BI) tools?
The key feature you should look for in your business intelligence tools and platforms is dashboarding. This is backed up by the fact that a good dashboard allows for quick data comparison and helps you gain insight in the shortest amount of time. Other useful but not as frequently requested features include:
- integration,
- data warehousing,
- mobile access.
You can read more about them here. Presently, one of the top business intelligence (BI) platforms that offer all of the above, including easy to use dashboards and report building is Microsoft Power BI. Power BI also allows for easy custom visual integration.
Custom visuals are a must-have if you want to grasp the full picture of your business's processes and turn them into a compelling data-story. You can enjoy enhanced features, more customization options, and, most importantly, a wider range of visual types - ranging from a simple pie or donut chart to even advanced map charts and network graphs.
Business Intelligence custom visual use case
Here's an example of a business intelligence (BI) report made using custom visuals.
While on first viewing the options and data-story branches seem endless, this is actually the strength of utilizing custom visuals. It's easy to find the relevant metrics and compare data in real time to come to a solid conclusion. You immediately have the option of asking general and specific questions, as well as endless "what ifs" when looking at the potential future of your company's success.
Key points for successful Business Intelligence implementation
So, we've made it to the business intelligence (BI) implementation stage. But to make sure things go smoothly, there are a few key things to consider. When looking through the integration process of various Microsoft business intelligence tools, consider these points:
1. The main attributes of your data.
Would interactivity in your data benefit the analysis process? Are you looking at billions of rows of data sets or just a few thousand? Think about how often you would need to refresh this data to stay relevant – once a year, month, week? Does it need to be refreshed in real time?
Also, consider the level of centralization you would prefer to attach to your data. Would you like your data to only be seen on the executive level or should all your employees have free access? Would you need your BI to be cloud based in order to share insights within the company?
2. Budget restrictions and time requirements.
If you already have a decentralized reporting system in use with a relatively small number of datasets, then perhaps implementing business intelligence (BI) for the whole company would simply prove too costly for the potential scope of impact.
But there is always the option to consult with experts specializing in business intelligence, as well as outsourcing your business intelligence (BI) reports, thus not only saving on resources but also receiving a specialized report suited to your business intelligence needs.
You don’t need to look too far when in need of solving a specific business intelligence (BI) problem or integration. Insight2Actions aims to understand business needs in order to provide digital solutions and database and system analytics. Companies such as Simplexity offer custom solutions by developing custom BI software, reports, and system upgrades. Or if you’re just getting started book a consultation or lesson with someone from Power BI Training who offer a wide array of training and consultation services.
3. Capabilities of your team.
Gauge out your team’s willingness to learn. This is important not only because they will have to go through business intelligence training to read and use business intelligence (BI) reports and data visualizations, but before you even get to the training process, you will have to collectively establish a data culture within your company.
What is data culture?
Establishing a data culture within your company means requiring all your employees to make decisions based on data analysis and insights, rather than basing future company development on experience in the field. To implement data culture and become a successful data-driven entity, you and your company must trust the statistics and data provided.
This is, of course, the opposite approach to building up a company based on empiricism and social phenomena, as business intelligence (BI) technologies and data analysis turn the decision-making process into a purely rational one.
Things to know when building a data culture
Data-driven culture is not a new concept in the world of business and analysis services. Business intelligence (BI) technologies just allow for easier tools that mark the full potential of relying on data. However, you do run the risk of experiencing resistance from your colleagues.
1. Creating a data culture is not easy
The first idea might be the reluctance of older but established executives, but you can also experience problems if workers within your company already use data but cannot decide on one data language or a set of metrics to work on.
It is crucial that you identify the metrics, dimensions and their definitions that are necessary to appropriately gauge out the progress of your company. Then afterwards, everyone has to agree to speak the same data language.
2. Everyone has to be on the same page
Can a focus on unity at the expense of absolute precision by any chance compromise accurate numbers? Absolutely. However, imperfect numbers that are ready are better than slow to compile yet precise numbers. It's important that your company is on the same page and works as a team, sharing and discussing insights on a unified view. This is how you arrive at a single version of the truth.
3. Build now, refine later
If you're still not at ease, think of it this way – if you're in business, you're probably not implementing business intelligence (BI) to work with rocket science or perform brain surgery. So, you have the option of focusing on that unified data language and culture, and only afterwards touch up the accuracy of your numbers, once you have the chance. As your company gets more comfortable with data-driven culture, your data quality can
Outsourcing BI vs. in-house BI team
Now, after we've considered what type of metrics we need, what business intelligence (BI) tools and platform we want to use, how are we going to implement data culture, we need to look at if our company is more suited for outsourcing business intelligence (BI) help or implementing it in-house.
Both approaches have their own advantages that triumph over the other’s faults. Below is a brief cheat sheet for quickly overlooking the different pros and cons for outsourcing vs. insourcing.
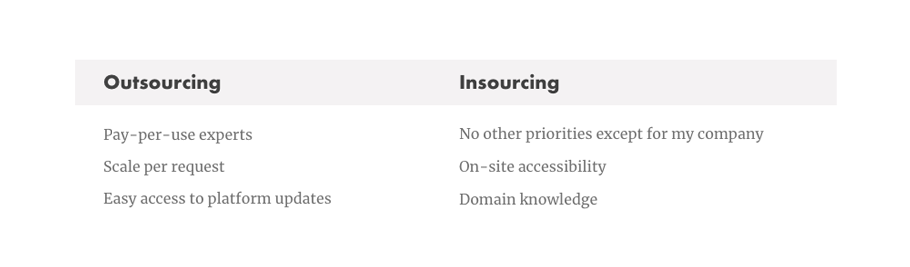
As we can see, these are the unique pros to each type of implementation. We can gather that outsourcing your BI solution would be a safer bet for smaller companies or companies dipping their toes and just getting started with business intelligence.
On the other hand, in-house implementation of business intelligence (BI) technologies would be more suited for a large company that already has vast amounts of data gathered and needs to refresh that data every hour or so.
However, you don't always need business intelligence (BI) and data analysis experts on the spot. Some spots you can even fill on your own through the help of self-service business intelligence, which allows people to have access to business data, data exploration, and perform data analysis without a background in SQL writing.
You can also look for a hybrid solution by only contracting business intelligence (BI) and data visualization companies for a limited amount of time, during which one of their main priorities is actualizing and finding business intelligence (BI) solutions just for your company and its needs.
The truth is – most companies and businesses aren’t just static entities, and an attempt at a binary classification could lead to more shortcomings than triumphs. As much as we rely on labels for clarity, it can be hard to put most companies in a box, as there are so many factors that impact and define a business’s needs.
The main thing you should take away from all that we've covered so far is - remember to view your company and all of its processes from a holistic point of view. If your company is fragmented in its approach to data, all that compiling of big data will be for nothing.
Summary
Business intelligence (BI) is best at visualizing an overall picture of all processes and data you compile and put into it, so you need to be prepared to adjust accordingly to the numbers as a team. How valuable and how well your data can serve the needs of your business is up to you and how open you are to the possibilities of business intelligence (BI).
Luckily, you'll find loads of companies like ZoomCharts who are willing to learn the ins and outs of how you company operates and offer you that necessary hybrid solution for your unique business case. Especially with the rise of self-serving BI, the opportunities for data exploration are limitless.
The latest in data visualization and custom visuals also aims to make data accessible to everyone. For example, this report was made using Drill Down PRO Visuals by ZoomCharts. With easy readability, smooth graphics and animations, custom visuals for business intelligence (BI) platforms such as Power BI will allow you to find an answer to any question in no time. Quality dashboards made with the latest business intelligence (BI) tool turn data-based decision making into a swift and easy process.

Want more info like this?
Subscribe to our newsletter and be the first to read our latest articles and expert data visualization tips!


