logo
For Power BI
  • Products
    • Custom Visuals for Power BI
    • Report Templates
  • Resources

      Resources

    • Documentation
    • Report Examples
    • Blog
    • Webinars
    • Video Tutorials
    • Visuals Gallery

    Support

    • ZoomCharts Assistance
    • Contact Sales
    • Contact Support
    • FAQ

    Challenges

    Challenges

    Improve your report creation skills by participating in free challenges for report creators.

    Learn more
    Get Developer License
  • Services
    • Power BI Report Development
    • Custom Visual Development
  • Challenges
  • Pricing
Request a quote Get Developer License Sign in
Request a quote Book a Demo Get Developer License Sign in
Get it now
Go back

Contents

Blog ZoomCharts Receives EU Funding for New Product Development

Jun 20, 2022

ZoomCharts Receives EU Funding for New Product Development

The co-financing initiative will ensure the attraction of highly skilled specialists and speed up the development of 3 brand-new custom visuals for Power BI. The work has begun, and the team plans to launch the new visualizations within a year.  

Title image
Title image

The co-financing initiative will ensure the attraction of highly skilled specialists and speed up the development of 3 brand-new custom visuals for Power BI. The work has begun, and the team plans to launch the new visualizations within a year.  

Contents

Share this article

The company already has successful experience in using EU funding to boost product innovation and compete in international markets. Technology Transfer Program, backed by the EU Regional Development Fund and administered by the Development Agency of Latvia (LIAA), is another support mechanism that ZoomCharts is using to create new products and enhance the experience for its customers. 

“We are proud to represent Latvia in the business intelligence industry, delivering innovative data visualization solutions to over 25,000 business clients in more than 100 countries,” said Jānis Volbergs, CEO of ZoomCharts. “This investment will help us provide additional value to our business customers globally, and in return it will further boost the economy of Latvia via increased export amounts.” 

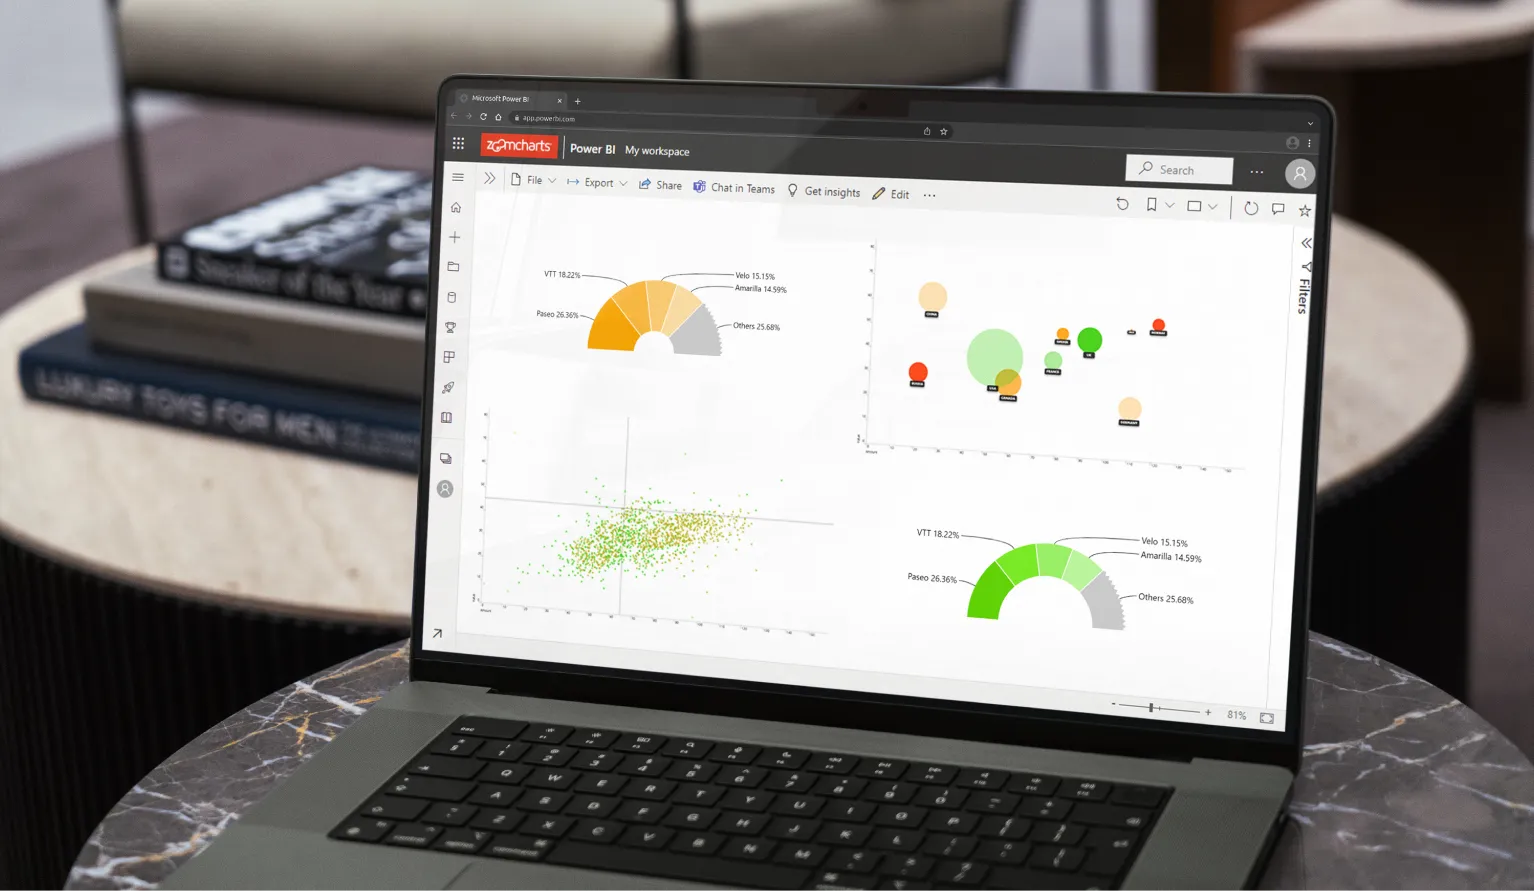
This project will be used to develop 3 brand-new additions to the Drill Down Visuals line of Microsoft Power BI custom visualizations: 

  • Drill Down Scatter PRO, which will allow users to create scatterplot visualizations on a Cartesian coordinate system, making it easy to spot trends among a high volume of data points.  
  • Drill Down Bubble PRO, which will give various options to show the relations between multiple data points on the x and y axes, with each of them changing size according to their values.   
  • Drill Down Gauge PRO, which can be used to monitor the overall completion rate of the project, time period, or budget in question. 

All new visuals will have ZoomCharts signature features - drill down capabilities, dynamic data exploration, and wide customization options. 

Drill Down Scatter PRO + Drill Down Bubble PRO

The Investment and Development Agency of Latvia (LIAA) is a government agency that promotes the development and expansion of industries, services, and entrepreneurship in Latvia. By attracting foreign investment and providing other assistance, LIAA aims to foster the growth of local businesses, promote innovation, and increase their competitiveness in the global market.   

ZoomCharts is taking part in the LIAA Technology Transfer Program (Project number: 1.2.1.2/16/I/001), which is funded by the EU Regional Development Fund (ERDF). Its aim is to provide funding for Latvian companies to bring innovative solutions to the public and promote economic growth.  

envelope icon

Want more info like this?

Subscribe to our newsletter and be the first to read our latest articles and expert data visualization tips!


Find out more

May 06, 2026

Blog Thumbnail
Product updates

May Update: Smarter Waterfall Labels and Series Total Tooltip Customization

ZoomCharts May 2026 update: smarter threshold label positioning for Waterfall PRO, a new comma-separated label format, and Series Total tooltip customization for Timeline, TimeSeries, Combo, and Line PRO.

Apr 28, 2026

Blog Thumbnail
Data visualization

Power BI drill-through vs drill-down: key differences

Power BI drill-through vs drill-down is one of the most common navigation questions report builders face. Both features help users move from summary numbers to deeper detail, but they do it in very different ways. Choose the wrong one, and your report can feel slow, confusing, or overloaded with unnecessary pages.

Apr 28, 2026

Blog Thumbnail
Power BI tutorials
Data visualization
Tutorials

How to Build an Interactive Power BI Dashboard: Step-by-Step Guide

Learn how to build an interactive Power BI dashboard with cross-chart filtering, drill-down, and real DAX measures. Included with live demo.

Apr 22, 2026

Blog Thumbnail
Tutorials
Data visualization

How to Build a 4U Procurement Report in Power BI

Procurement data is some of the most decision-critical data an organization holds. It touches budgets, supplier relationships, delivery risk, and compliance, all at once. Yet most procurement reports get built the same way: tables of spend, a few bar charts, and a handful of slicers. Users open them, feel overwhelmed, and go back to spreadsheets.

Apr 13, 2026

Blog Thumbnail
Tutorials
Data visualization

How to Build 4U Executive KPI Reports

Any developer can publish a report. But building a report that executives actually open, navigate confidently, and use to make decisions requires a different approach. This guide walks through how to apply the 4i principles in Power BI and achieve 4U Reports, using a real executive KPI dataset as a working example.

Apr 08, 2026

Blog Thumbnail
Data visualization

4U Reports: Unique, User Friendly, Uncovering, Understandable

Most organizations have invested heavily in business intelligence tools, data platforms, and analytics teams. Yet the reports go unused, and decisions are still made based on intuition and speculation. 4U Reports are built to close that gap by putting user experience at the center of every reporting decision.
  • 1
  • 2
  • 3
  • 4
  • 5
  • ...
  • 16
  • »

Contents

Share this article

Want more info like this?

Subscribe to our newsletter and be the first to read our latest articles and expert data visualization tips!


Thank you!

Check your inbox to verify your email address.

logo
[email protected]
+44 204 577 3993
logo

Products

Drill Down Bubble PRO Drill Down Line PRO Drill Down Network PRO Drill Down Waterfall PRO Drill Down Graph PRO Drill Down Combo PRO Drill Down Combo Bar PRO Drill Down Donut PRO Drill Down Pie PRO Drill Down TimeSeries PRO Drill Down Timeline PRO Drill Down Map PRO Drill Down Scatter PRO All Visuals

Resources

Report Examples Webinars Blog ZoomCharts Academy Visuals Gallery Documentation Custom Visual Development Subscribe to News

Solutions

Custom Visual Development

Company

Pricing About Us Partners Leave feedback Join PowerGroup EU Funding

Help

ZoomCharts Assistance Contact Sales Contact Support FAQ AI Information

Drill Down Line PRO Drill Down Bubble PRO Drill Down Network PRO Drill Down Waterfall PRO Drill Down Graph PRO Drill Down Combo PRO Drill Down Combo Bar PRO Drill Down Donut PRO Drill Down Pie PRO Drill Down TimeSeries PRO Drill Down Timeline PRO Drill Down Map PRO Drill Down Scatter PRO All Visuals

Report Examples Webinars Blog ZoomCharts Academy Visuals Gallery Documentation Custom Visual Development Subscribe to News

Custom Visual Development

Pricing About Us Partners Leave feedback Join PowerGroup EU Funding

ZoomCharts Assistance Contact Sales Contact Support FAQ AI Information
+44 204 577 3993
[email protected]

Ready to get in touch?

Contact our experts with any question about Power BI and ZoomCharts for Free!

Contact us

© 2026, Data Visualization Software Lab

U.S. Patents No. 11,645,343; 11,921,804; 12,346,389

Cookies
Privacy Policy
Global
Legal
Patent
warning

Error message

success

Success info: Done!

ZoomCharts AI Assistant

We noticed you're using an old OS version.

For the best experience, we recommend upgrading to ensure that all website features display correctly.

Cookie settings

We use necessary cookies for site functionality, as well as statistic, marketing, and preference cookies to enhance your experience. For more information and to manage your preferences, please visit our Cookie policy