Here are some of our most interesting custom visual projects that will be added to the Drill Down Visual suite
Multiple TimeSeries visual
Our customer had time series data that needed to be plotted automatically in n-number of sub-charts based on the category. We implemented the visual based on the Drill Down Timeseries visual core and added automated sub-chart generation and interaction synchronization. Being based on the TimeSeries visual, Multiple TimeSeries comes with automated data aggregation and touch driven scrolling and zooming functionality, enabling fast and intuitive data exploration.
- Automated chart generation
- Automated time-based aggregations
- Synchronised zooming and scrolling
- Big data ready
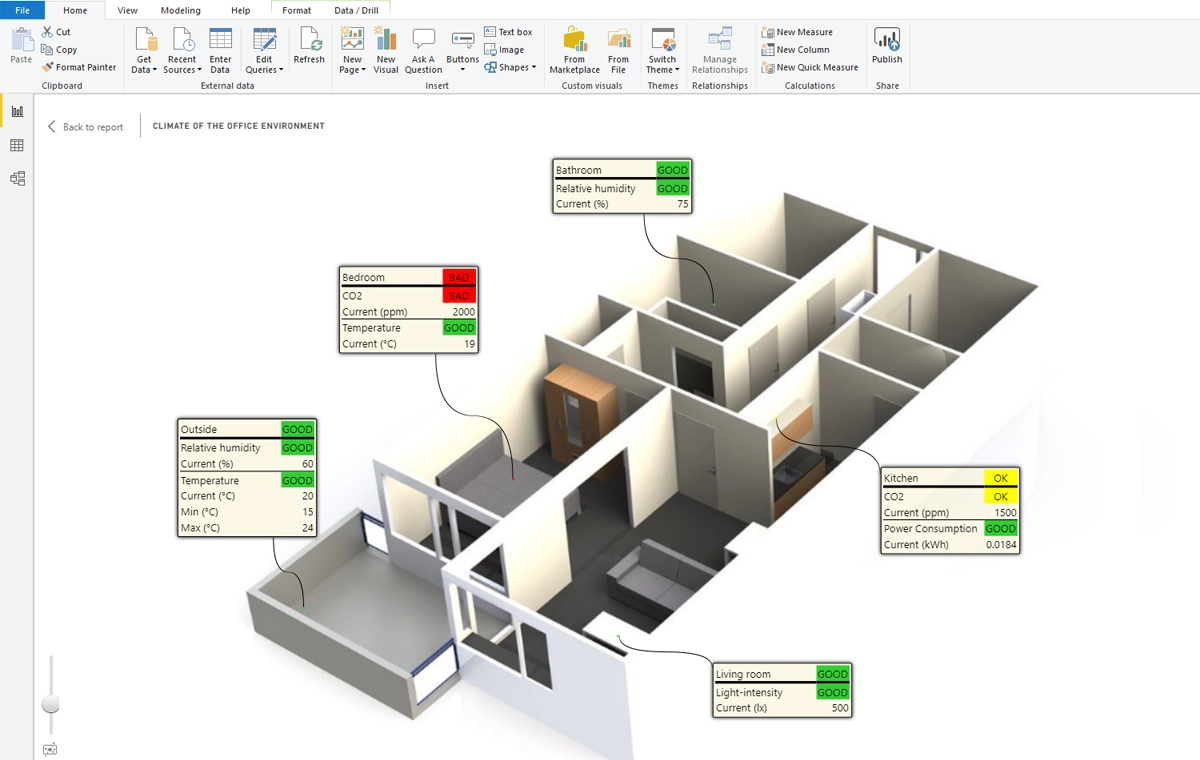
Sensor Map Visual
With Internet of Things becoming more and more popular, data monitoring becomes more important than ever. With this visual, the customer can use their own floor plans to easily display and monitor multitude of sensors. Full integration with dynamic data model enables seamless integration with slicers, filters and highlights triggered by other visuals.
- Automated sensor result visualization
- Full flexibility for tooltip layout
- Custom floor map support with intuitive interactions