Nov 01, 2023
Customer Story: How Intel Uses ZoomCharts for Global Supply Chain Management
Intel develops technology that increases the performance and efficiency of computers and other devices. ZoomCharts creates data visualization technology that increases the efficiency and user adoption of Intel’s state-of-the-art business intelligence infrastructure.

Intel develops technology that increases the performance and efficiency of computers and other devices. ZoomCharts creates data visualization technology that increases the efficiency and user adoption of Intel’s state-of-the-art business intelligence infrastructure.
We had a chat with Emil Vaintrub, the Supply Chain Ecosystem & Alliances Impact Program Manager of Intel, to find out how they use ZoomCharts visuals and how our solutions have impacted their internal reporting and data analysis process.
About Intel
Since their foundation in 1968, Intel has always been at the forefront of innovation. In 1971, they released Intel 4004 – the world’s first single-chip microprocessor, paving the way for the personal computer revolution. With various breakthrough products like Celeron, Pentium, Xeon, and the Core series of desktop processors, Intel has been instrumental in bringing the power of personal computing to workplaces and households alike.
Nowadays, Intel is one of the global leaders in semiconductor development and manufacturing, and their product range includes not just desktop and workstation CPUs, but also chipsets, graphics cards, memory and storage devices, and solutions for IoT and embedded systems. Furthermore, Intel has set its sights towards AI & Machine Learning, developing both hardware and software solutions to empower leading-edge models.
Intel & Power BI
Gordon Moore, Intel’s co-founder, predicted in 1965 that the number of transistors on a microchip will double every two years – an observation that is called Moore’s Law and has remained true to this day. The previously mentioned Intel 4004 had just 3000 transistors – impressive for 1971, but pales in comparison to modern CPUs that have billions of transistors, each measuring just a few nanometers in size.
To manufacture semiconductors for CPUs, GPUs, SSDs, IoT system-on-chips and other solutions at their technical specifications, quality control requirements and level of consistency, Intel has created a sophisticated global supply chain which includes 15 wafer labs in the United States, Ireland, Israel, China, Malaysia and Vietnam.

Intel D1X factory in Hillsboro, Oregon. Image Credit: Walden Kirsch/Intel Corporation.
Intel has developed an internal reporting system based on the Power BI cloud, which is used to manage their supply chain ecosystem and strategic partnerships, in addition to analyzing and visualizing Intel’s footprint on the local economy in each of their locations.
With Power BI, Intel can efficiently gather and process data from multiple locations over the cloud and have the complete picture. However, the complexity of their data set posed a challenge for Intel – how to provide clear and crisp insights to all stakeholders?
Intel searched for custom visuals that would allow them to develop reports and dashboards that visualize complex global supply chain data in an easy-to-understand way, and they found their solution - Drill Down Visuals by ZoomCharts.
How ZoomCharts Helps Intel
ZoomCharts’ user-centric approach when designing Drill Down Visuals provided the perfect solution for Intel. They have implemented ZoomCharts visuals in their dashboards and reports with the aim to increase their usage across the organization and provide faster and more accurate insights to stakeholders.
For example, Drill Down Map PRO has allowed Intel to create an overview of the supply chain ecosystem with an interactive map that visualizes data about each Intel manufacturing plant and all Intel supply partners in their vicinity. They needed a visual that can provide a streamlined user experience and easy data readability even for complex use cases like global supply chain management, while not compromising on data accuracy or level of detail.

Map PRO, like all our Drill Down Visuals, was specifically designed to encourage users to explore data with intuitive user interactions, which means that the initial view of the map chart can provide a global overview, but a click or a tap on a specific country or region will drill down and reveal more detailed and focused insights in just a few seconds.
With the wide range of customization settings available in Drill Down Visuals, Intel was able to adapt our visuals for highly specific use cases and seamlessly integrate them in their BI workflow. Each visual provides various ways to customize the appearance, behavior, or functionality.

ZoomCharts visuals have also enabled Intel to easily create reports with multi-layer data. Cross-chart filtering allows multiple visuals on the same report page to interact with each other by dynamically filtering to relevant data as the user explores the report.

User-Centric Reporting With ZoomCharts
After increasing the efficiency and user adoption of their supply chain management reports, Intel is now looking for new ways to use ZoomCharts in more facets of their business intelligence.
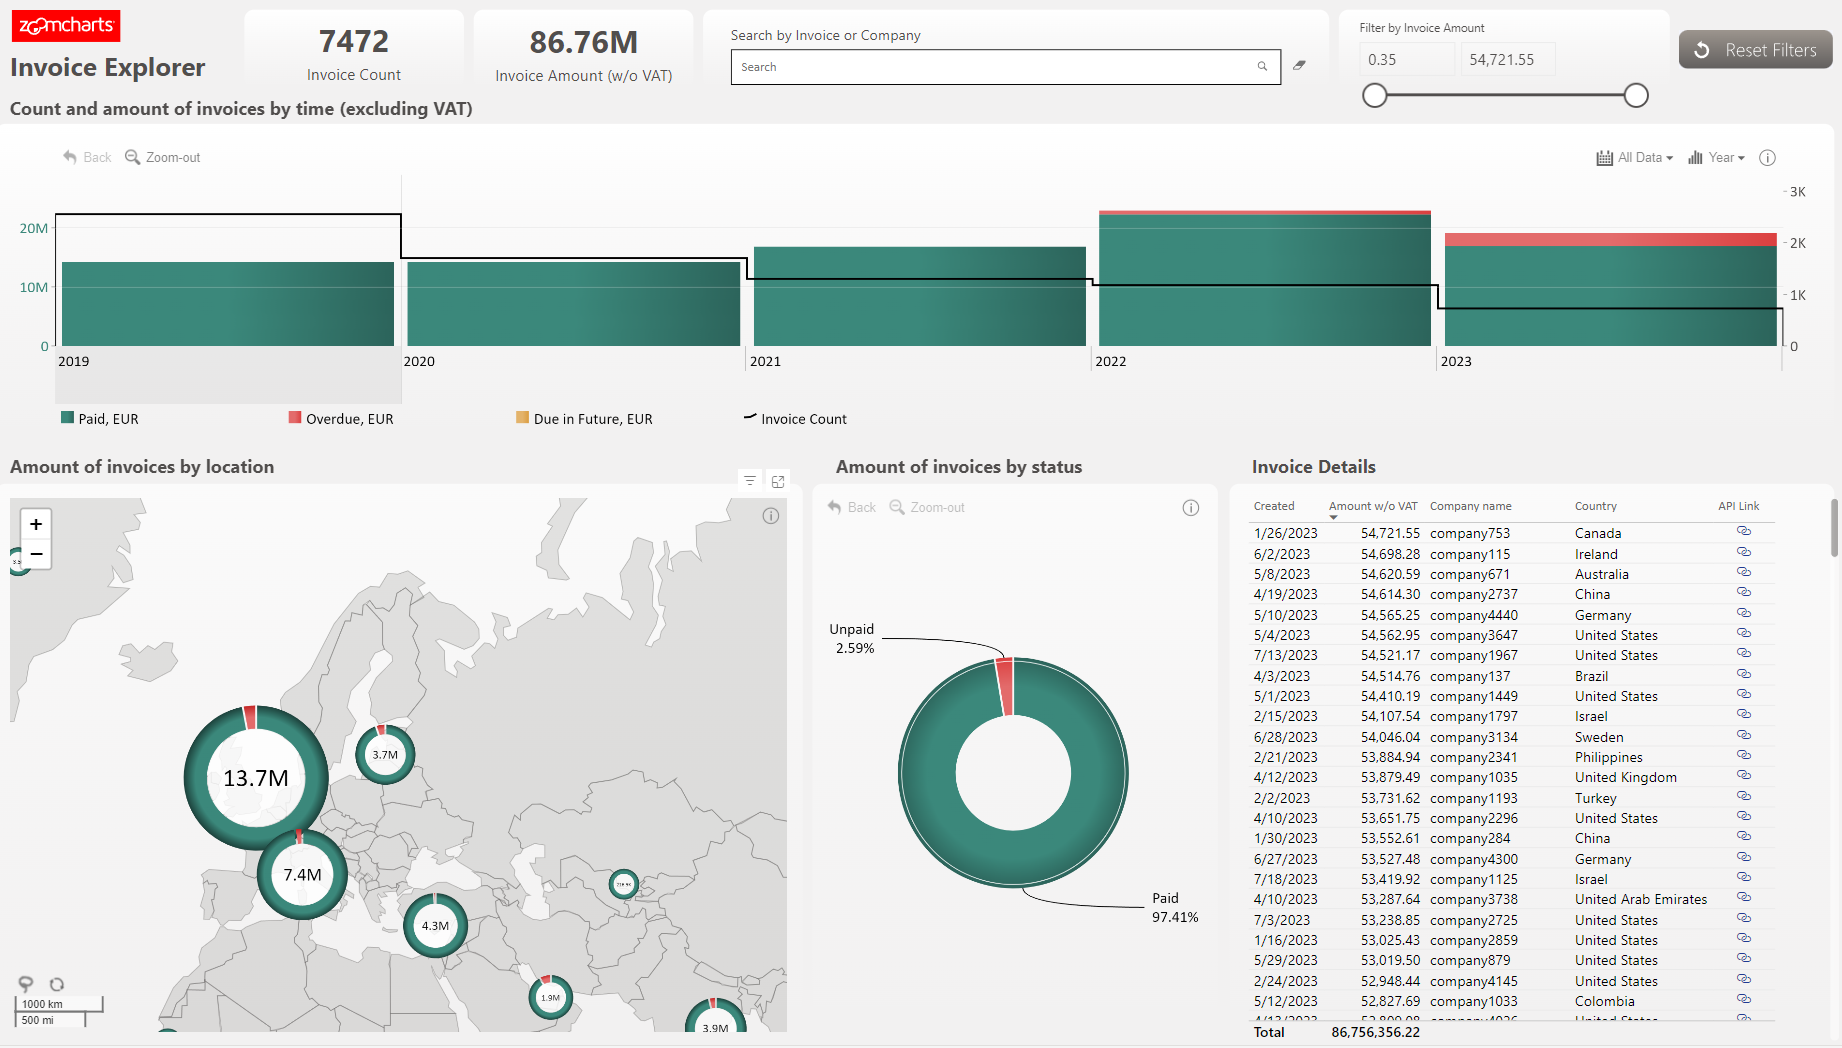
Here's an example from the ZoomCharts report creator team that shows how multiple visuals - time series, map chart, donut chart, and other report elements - can work together to elevate the report and make data exploration engaging. You can try out the live demo of this Invoice Explorer report, or download the .pbix file.
The majority of business users experience big data via reports and dashboards. ZoomCharts believes that focusing on the user experience and ease-of-use of reports and dashboards is the most effective way to gain value from your investment into the BI infrastructure.
If the process of exploring and analyzing business data is intuitive and engaging, instead of confusing and frustrating, more users will start using BI reports every day to find answers to their questions and make swift and confident decisions, backed by data.
With Drill Down Visuals for Power BI, you can create interactive reports and dashboards that empower any business user to find meaningful insights with just a few clicks. Make reports your users will love to use with class-leading interactivity, touch support, and seamless cross-chart filtering for multi-dimensional data analysis!

Want more info like this?
Subscribe to our newsletter and be the first to read our latest articles and expert data visualization tips!


