logo
For Power BI
  • Products
    • Drill Down Donut Pro Drill Down Donut PRO
    • Drill Down Pie Pro Drill Down Pie PRO
    • Drill TimeSeries Pro Drill Down TimeSeries PRO
    • Drill Combo Pro Drill Down Combo PRO
    • Drill Map Pro Drill Down Map PRO
    • Drill Scatter Pro Drill Down Scatter PRO
    • Drill Down Network Pro Drill Down Network PRO
    • Drill Down Waterfall Pro Drill Down Waterfall PRO
    • Drill Down Graph Pro Drill Down Graph PRO
    • Drill Down Timeline Pro Drill Down Timeline PRO
    • Drill Down Combo Bar PRO Drill Down Combo Bar PRO

    Video tutorials

    Watch Now

    More than 90 videos on how to enhance Power BI with ZoomCharts

    Learn more
    All visuals
  • Resources

      Resources

    • Documentation
    • Report Examples
    • Blog
    • Webinars
    • Video Tutorials
    • Visuals Gallery

    Support

    • ZoomCharts Assistance
    • Contact Sales
    • Contact Support
    • FAQ

    Challenges

    Challenges

    Improve your report creation skills by participating in free challenges for report creators.

    Learn more
    Start trial
  • Services
    • Power BI Report Development
    • Custom Visual Development
  • Challenges
  • Pricing
Request a quote Start Free Book a Demo Sign in
Get it now
Go back

Contents

Go back

Share

Logo

Welcome to the FP20 Analytics September 2024 Challenge!

Aug 30 - Oct 02, 2024 | EDT

Run a data-driven e-store and analyze KPIs with Challenge 19

Timeline

Registration Open

Registration Open

30 August | 21:00

-

Submissions Open

Submissions Open

30 August | 21:00

-

Workshop | Track E-Commerce Growth Metrics with Power BI

Workshop | Track E-Commerce Growth Metrics with Power BI

17 September | 11:00

-

1:1 Mentoring Sessions

1:1 Mentoring Sessions

17 September | 11:00

30 August - 28 September

Entry Submission Deadline

Entry Submission Deadline

28 September | 21:00

30 August - 28 September

Webinar | Expert Feedback on Top 5 E-Commerce KPI Reports

Webinar | Expert Feedback on Top 5 E-Commerce KPI Reports

03 October | 11:00

30 August - 28 September

Winner Announced

Winner Announced

03 October | 11:00

30 August - 28 September

Dataset

Get the dataset

See past FP20 Analytics challenges

See past challenges

Share the challenge

Submitted Reports
About challenge
How to participate
The Brief
Judging criteria
Timeline
Dataset
Past challenges

Winner of the challenge

Report Card

FP20 Challenge E-commerce

Author: Misha Riaz

17

View Report

All Submissions

Report Card

Global Skincare and Beauty E-Store Performance Analysis (2020-2023)

Author: Rakshit Bhadoria

6

View Report
Report Card

MFH E-COMMERCE ANALYSIS

Author: María Fernanda Helguero

1

View Report
Report Card

Ecommerce Analysis

Author: Sushree Jena

3

View Report
Report Card

E- Commerce Report

Author: Okeh Dono Efasa

4

View Report
Report Card

E-Commerce KPI

Author: Agbata Dickson Ukolojo

0

View Report
Report Card

Beauty e-store

Author: Abdullah El-Gohary

0

View Report
Report Card

Global Skincare & Beauty Analysis

Author: Ugochukwu Nwasuruba

0

View Report
Report Card

Performance Analytics

Author: Abhilasha Narasimhan

7

View Report
Report Card

FP20 Analytics Challenge

Author: Igboejesi Chidera

0

View Report
Report Card

Financial Performance General Overview

Author: Norman Reynaldo Sabillon Castro

0

View Report
Report Card

Report by Zulay Vivas de Arrieta

Author: Zulay Vivas

3

View Report
Report Card

FP20 E-commerce Report

Author: Edith Obidi

0

View Report
Report Card

FP20 Analytics: SCN Cosmetics - E-commerce analysis

Author: Chiemezuo Ngerem

8

View Report
Report Card

Beauty Insights

Author: Zeya Mosharraf

5

View Report
Report Card

Beauty & Skincare E-commerce Analysis

Author: Emma Skidmore

0

View Report
Report Card

E-commerce analysis

Author: Eszter Kovacs

0

View Report
Report Card

E-commerce Shop Sales Annual Report

Author: Magdalena Koszczuk

0

View Report
Report Card

E-commerce Sales Analysis

Author: Akashdeep Dam

0

View Report
Report Card

Ecommerce Analysis

Author: Eniola Adekoya

2

View Report
Report Card

FP20 E-Commerce KPI by Maniraj

Author: Mani Raj

1

View Report
Report Card

Skincare and Beauty E-Store: Annual Sales Report

Author: Elena Genova

2

View Report
Report Card

E-COMMERCE KPIs ANALYSIS

Author: Abhishek kumar Paul

3

View Report
Report Card

E Commerce Challenge

Author: Steven Stanford

0

View Report
Report Card

E-commerce KPIs Analysis

Author: Dinesh Kumar Mani

0

View Report
Report Card

E-commerce report

Author: Raaz Iglesias

5

View Report
Report Card

E-commerce KPI

Author: Muhammad Naveed Ziai

0

View Report
Report Card

E-commerce

Author: Joanns Engels

2

View Report
Report Card

E-commerce

Author: Abhishek Kalra

0

View Report
Report Card

FP20 Challenge 19

Author: Cyrus James Daguro

1

View Report
Report Card

KPI E commerce FP20

Author: Sounak Paul

0

View Report
Report Card

E-Commerce C19 FP20 Analytics

Author: Fabian Vicencio Islas

2

View Report
Report Card

E-COMMERCE KPIs ANALYSIS

Author: Sapana Taneja

0

View Report
Report Card

Skincare and Beauty E-Commerce Analysis

Author: Blessing John

0

View Report
Report Card

FP20 E-commerce KPIs Analysis

Author: Rukayat Alarape

0

View Report
Report Card

FP20 Analytics September 2024 Challenge

Author: Floris Moest

2

View Report
Report Card

E-commerce Report

Author: Biokpo (Victor) Amachree

0

View Report
Report Card

FP20 Analytics Challenge 19

Author: Borys Kuznietsov

0

View Report
Report Card

FP20 ANALYTICS SEPTEMBER CHALLENGE

Author: Toheeb Rasaq

0

View Report
Report Card

Skincare and Beauty E-Commerce Analysis

Author: Nogho Tidang Belviane

30

View Report
Report Card

PowerBI - Ecommerce - FP20C19

Author: Arundhati Das

2

View Report
Report Card

FP20 Analytics e-commerce report

Author: Manoj Ramesh

0

View Report
Report Card

ECommerce Sales Dashboard by Abhijeet Pathak

Author: Abhijeet Pathak

0

View Report
Report Card

Report by Pratik Yallapragada

Author: Pratik Yallapragada

0

View Report
Report Card

FP20 Analytics E-Commerce Analytics

Author: Madhuri Vunyala

0

View Report
Report Card

KPI Analysis

Author: Tanmoy Banerjee

0

View Report
Report Card

E-Commerce Analysis for Skincare and Beauty E-store

Author: Ugochi Ugoala

2

View Report
Report Card

Ecommerce KPIs Analysis

Author: Đức Thành Cao

2

View Report
Report Card

E-commerce C19 FP20 Challenge

Author: Thet Pyae Sone Aung

0

View Report
Report Card

Ecommerce KPI Analysis

Author: Muthu Krishnan

0

View Report
Report Card

E-commerce KPIs FP20 Analytics September 2024

Author: Oriol Ferret

0

View Report
Report Card

E-Commerce C19 FP20 Analytics

Author: Cherry Aye Mya Mya Tun

0

View Report
Report Card

Skincare and Beauty E-Commerce Analysis

Author: Giancarlo Ramos de Rosas

1

View Report
Report Card

E-Commerce Dashboard

Author: Spurthy Ramappa

0

View Report
Report Card

Global Skincare and Beauty E-Store

Author: M. Haider Hassan

0

View Report
Report Card

E-Commercial KPI analysis

Author: Dan Nguyen

0

View Report
Report Card

Report by Ajay Kumar Pandey

Author: Ajay Kumar Pandey

1

View Report
Report Card

Skincare E-commerce

Author: Subhasis Das

0

View Report
Report Card

E-COMMERCE KPI ANALYSIS - CHALLENGE 19

Author: Marcos Contreras León

0

View Report
Report Card

E-Commerce FP20 Analytics KSliwa

Author: Karolina Śliwa

0

View Report
Report Card

Report on E-Commerce Analysis

Author: Arun Mohan A M

1

View Report
Report Card

FP20 analytics Challenge 19 - Ecommerce KPI dashboard

Author: Swati Gupta

0

View Report
Report Card

Skincare and Beauty E-Commerce Analysis

Author: Gamal Mahmoud

0

View Report

About FP20 Analytics ZoomCharts Challenge

Want to learn to build PRO reports? With personalized feedback and informative workshops, this is your opportunity to take your report-building skills to the next level, build your professional portfolio, and network with like-minded people.

The ZoomCharts challenge is hosted in partnership with FP20 Analytics – a group that unites passionate and inspiring data enthusiasts, and helps new data analysts improve their skills and build a competitive portfolio. Join in and sharpen your skills together with this open and friendly data community. Read more about the challenges on the FP20 Analytics website. Join the community on LinkedIn.

Participate in FP20 Analytics ZoomCharts Challenge to enrich your skill in creating PRO reports that help business users explore data quickly and intuitively. 

  1. Free License: All participants receive a free ZoomCharts Developer License that gives access to the full Drill Down PRO visuals library. License will remain active for 1 year after the challenge.
  2. Learn from Experienced Professionals: As part of the challenge, we host live workshops on report building and visualizing the challenge’s dataset in Power BI. Challenge participants can also book an individual consultation with an experienced Power BI mentor to ask questions and get personalized tips.
  3. Tailored Feedback: Every challenge submission will receive personalized feedback, giving participants the chance to hone their skills and improve their reports.

Prizes

The best report’s creator will receive a $300 Amazon gift card from ZoomCharts. The ZoomCharts winner will be announced in a special live webinar session on October 3rd, where we will review the Top 5 entries from the challenge. 

Webinar recordings

Recording thumbnail

Track E-Commerce Growth Metrics with Power BI

Online Workshop on E-Commerce KPI Analysis for the FP20 Analytics & ZoomCharts Challenge 19

Watch the recording
Recording thumbnail

Expert Feedback on Top 5 E-Commerce KPI Reports

Best FP20 Analytics ZoomCharts Challenge 19 submissions + the winner announcement

Watch the recording

How to participate? 

1. Register for the challenge: 

  • Download the Challenge dataset either on this Challenge page or from FP20 Analytics website. 
  • Register for the FP20 Analytics ZoomCharts Challenge. 
  • Activate your free Drill Down Visuals Developer License for Power BI. Read license setup instructions.
  • Read the challenge brief (see "The Brief" section) for additional info about the dataset and to see what questions your report should answer.  

2. Build your report in Power BI: 

  • Set up an account in Power BI using the assigned license details (if you have participated in ZoomCharts Challenges in the past, you can use the same account you set up before).
  • Use the account to access the full library of custom ZoomCharts Drill Down visuals. 
  • Use the dataset to build a Power BI report including at least 2 ZoomCharts Drill Down Visuals in one report page. 
  • The number of pages in the report is limited to 3 pages, including drill-through pages. 

3. Improve your report and learn new skills: 

  • To learn more about applying ZoomCharts visuals in your reports, participate in the challenge workshop. 
  • If you have any questions or need advice, you can book a free individual consultation. 
  • Check out the submissions from past challenges for inspiration. 

4. Submit your challenge entry: 

  • Submit your report in .pbix format for validation. 
  • If your submission doesn’t match the challenge criteria, you will be notified by email indicating the reason. Don't worry if this happens! You can fix the issue and resubmit your report. 
  • Together with validation confirmation, you will receive a publish to web link that you can use to add the report to your portfolio or publicly share online. 
  • All validated entries will receive personalized feedback from the evaluation team. You can use this feedback to revise your report and resubmit it before the deadline. Feel free to resubmit your entry as many times as necessary before the deadline. 

5. Finalize your participation to compete for the ZoomCharts grand prize: 

  • (Optional) Upload your publish to web link on NovyPro.  If you opt to post your report on NovyPro, for instructions on how to do this, refer to the video link provided. NovyPro: https://www.novypro.com/  
    Instruction Video: https://www.youtube.com/watch?v=jkcAYgFGWUY
  • Post the final version of your submission in PDF format on your LinkedIn profile. 
  • Use the caption "I am participating in FP20 Analytics Challenge 19”. 
  • Include a summary of your report's key insights and add the ZoomCharts publish to web link or NovyPro link. 
  • Use the hashtags #FP20Analytics, #FP20EcommerceAnalysis, #builtwithzoomcharts, tag @Federico Pastor and @Zoomcharts. 
  • Additionally, post your report in the FP20 Analytics LinkedIn Community group. 
  • Follow ZoomCharts on LinkedIn 

6. Attend challenge closing webinar to hear the results: 

  • The submissions are evaluated by ZoomCharts team (see "Judging criteria" for more info). The submissions of Top 5 ZoomCharts Mini Challenge finalists are analyzed live during the challenge closing webinar to share the best practices and learning opportunities with the community. 
  • The author of the best report is awarded with a $300 Amazon gift card.

About the dataset

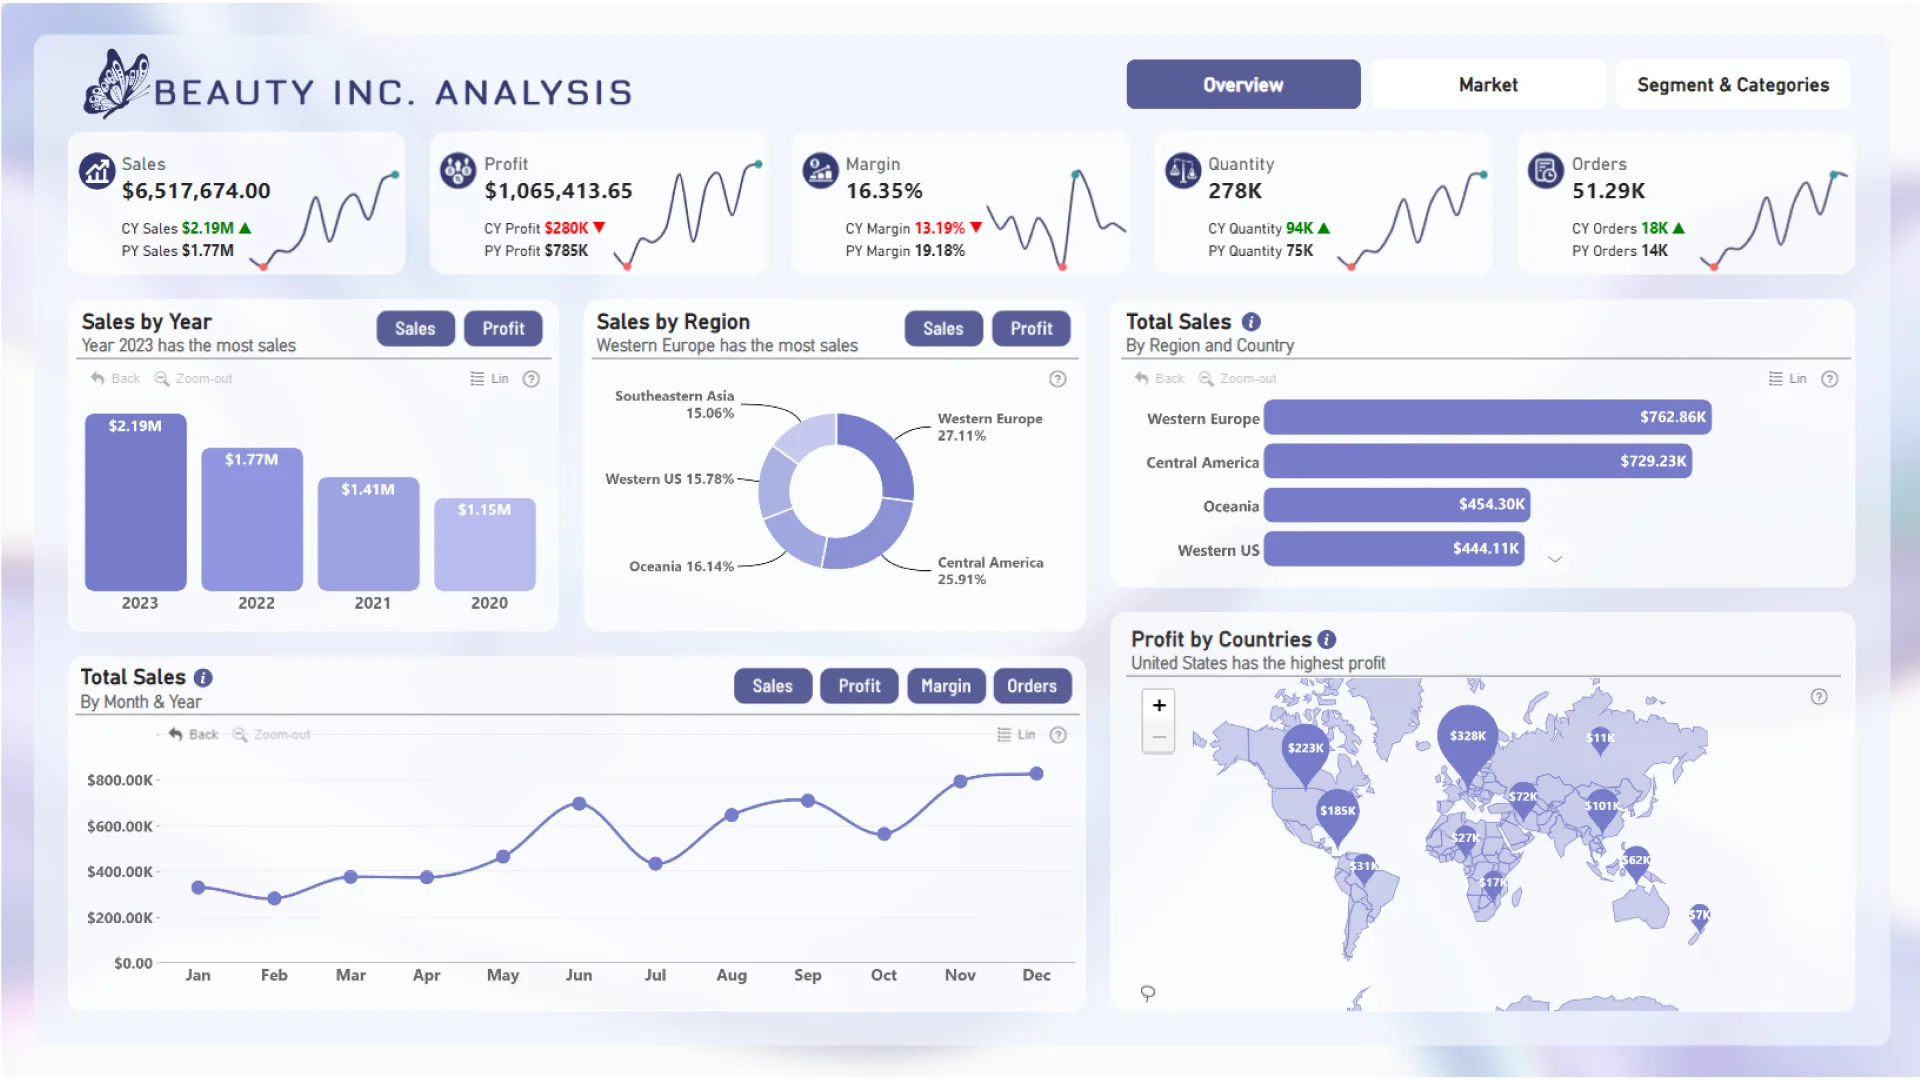
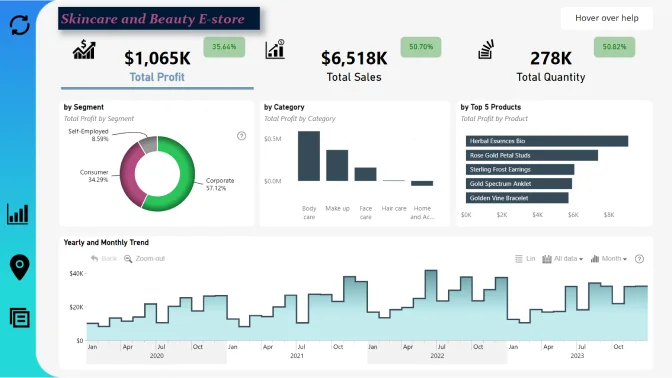
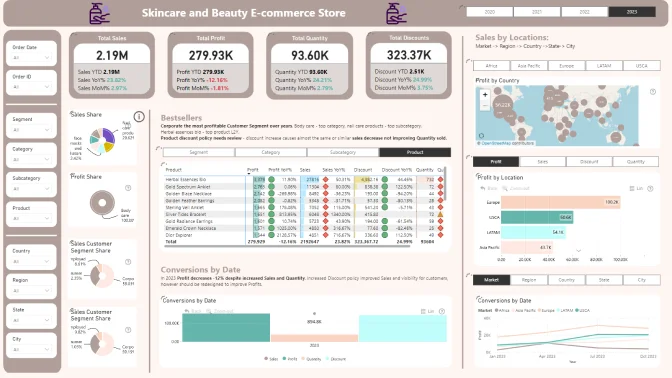
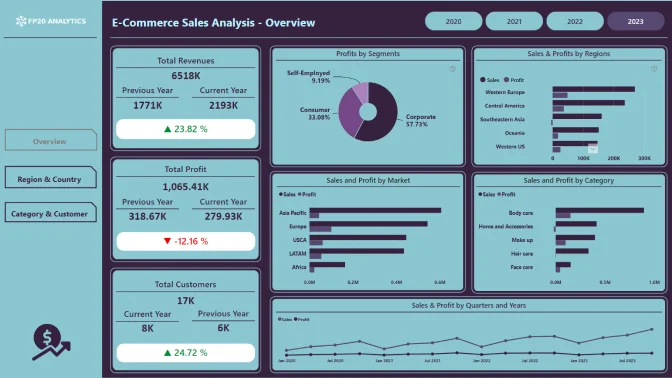
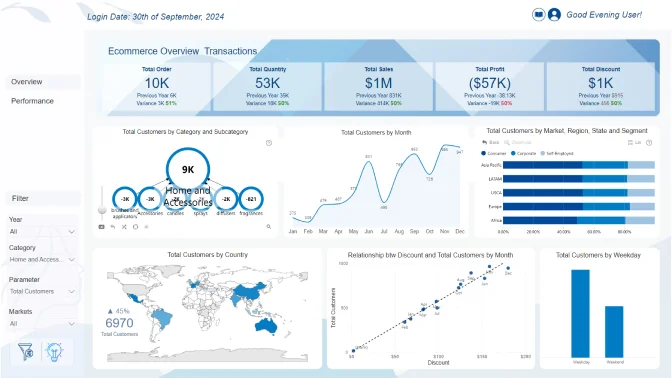
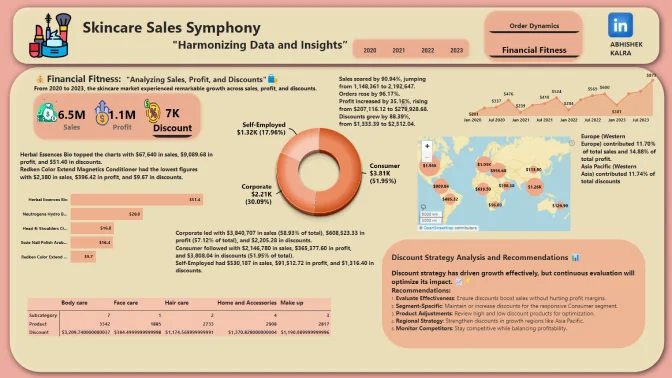
You are tasked with creating a comprehensive Power BI report using an order dataset from a global skincare and beauty e-store.

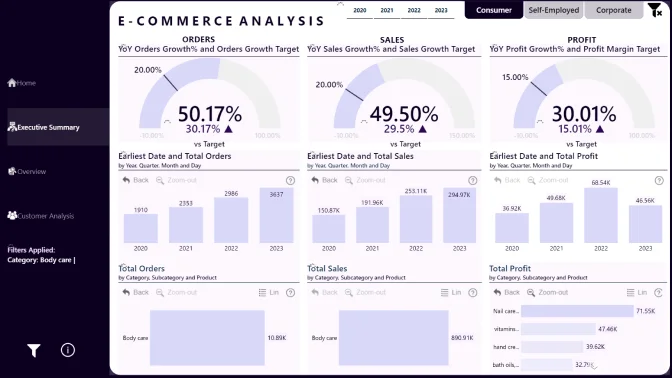
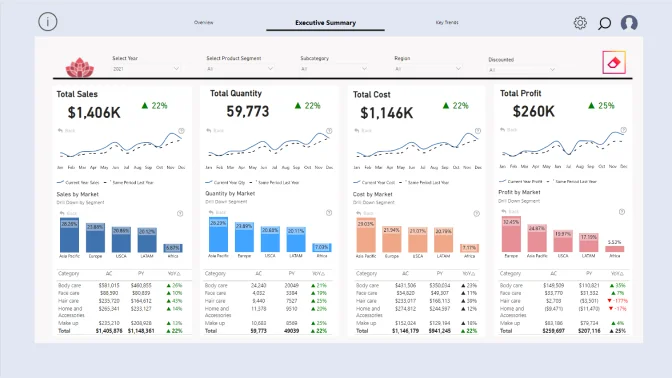
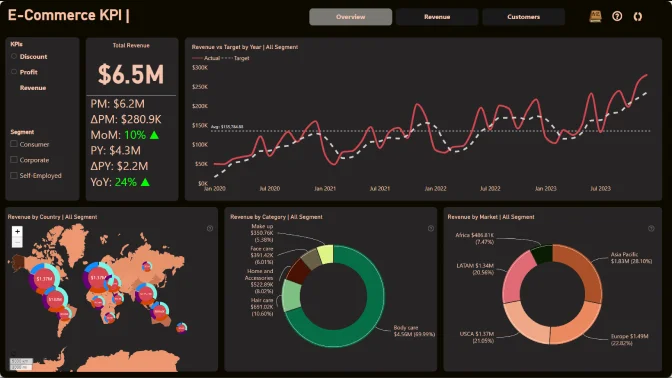
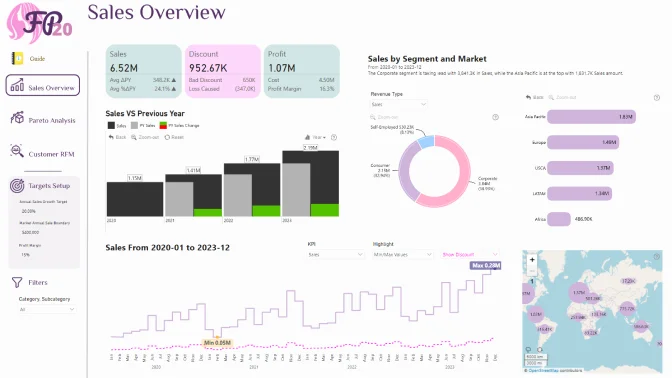
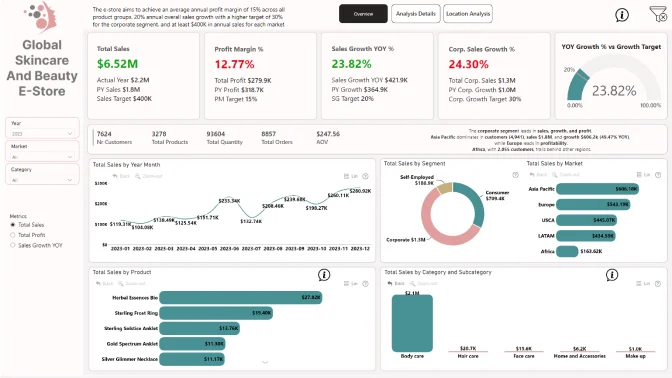
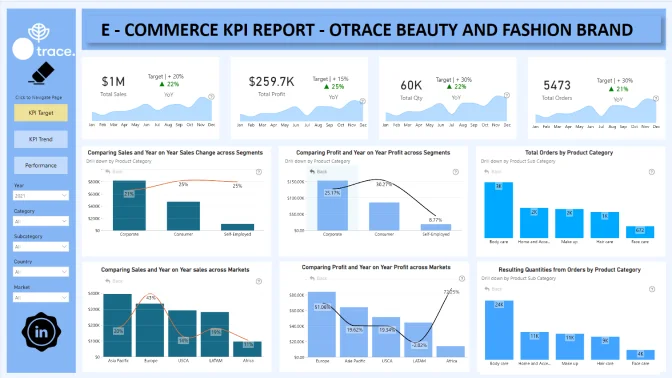
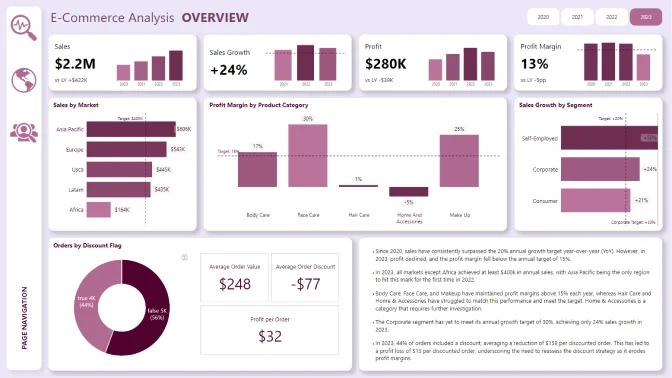
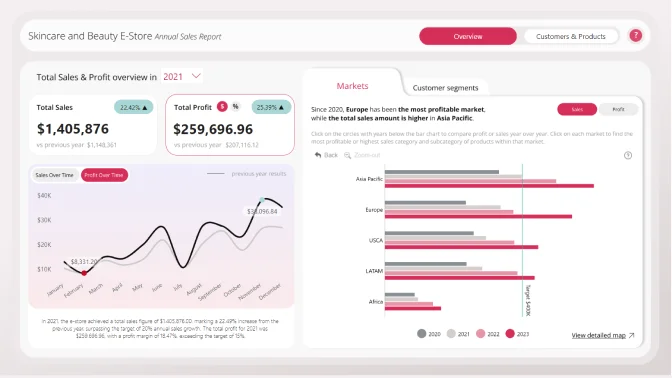
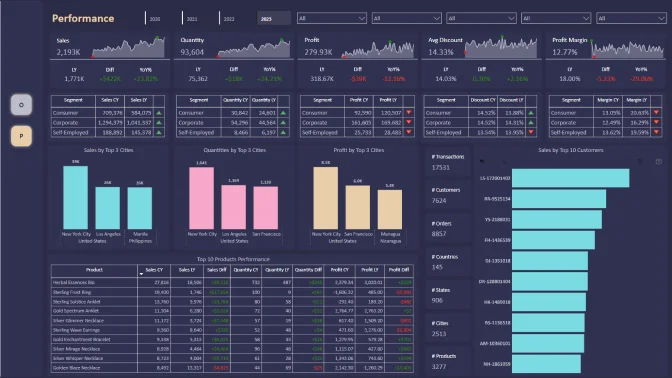
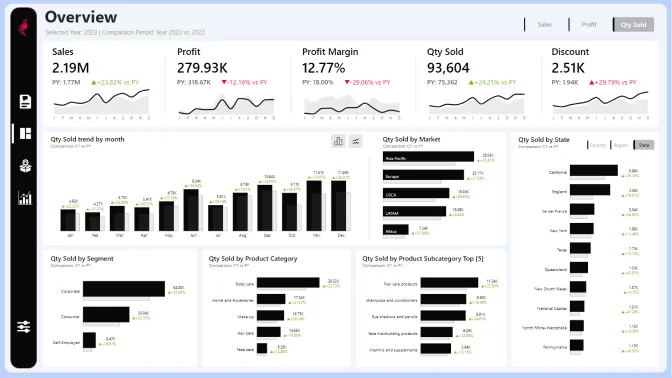
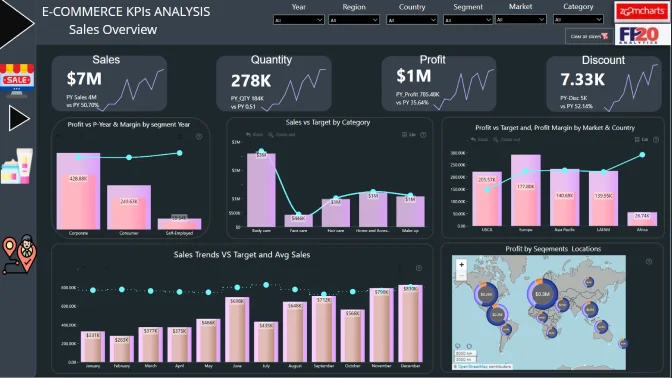
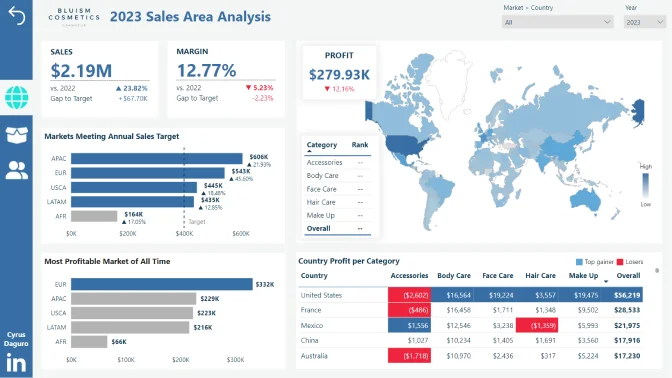
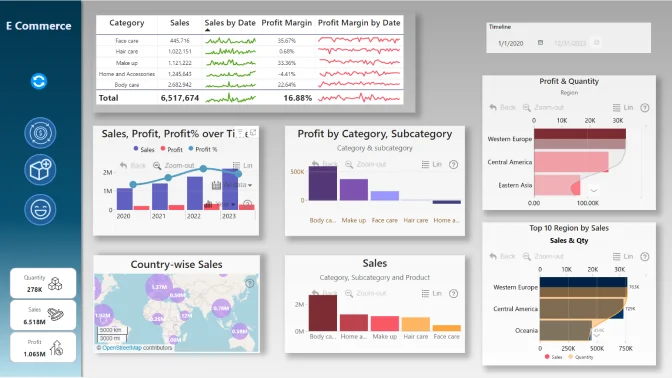
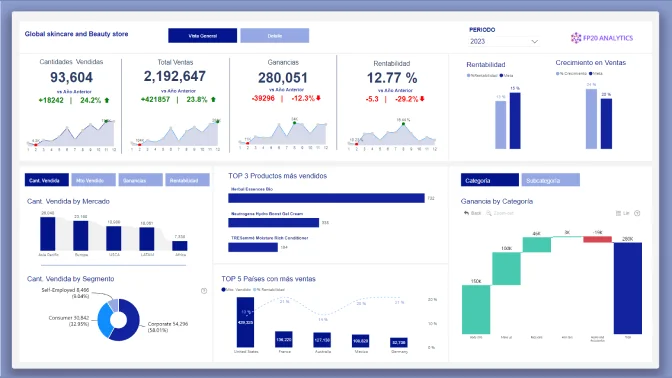
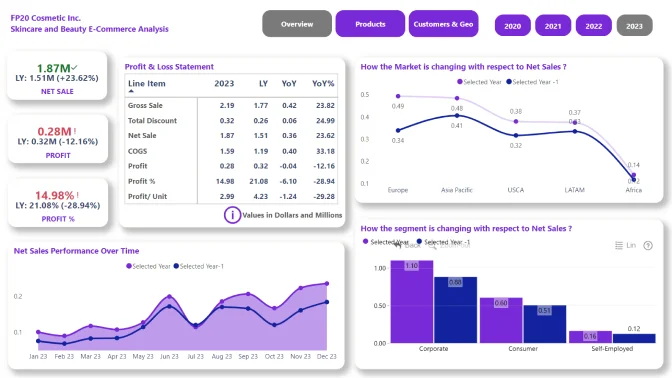
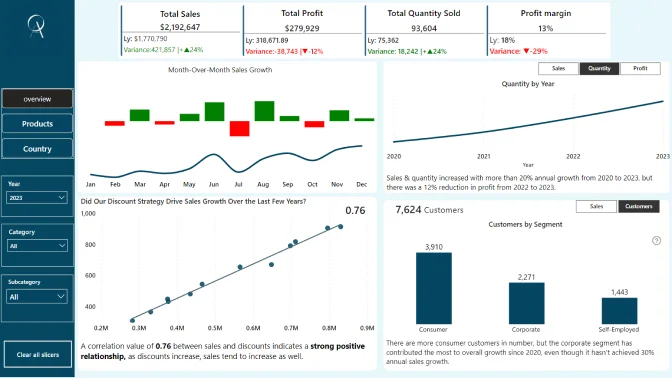
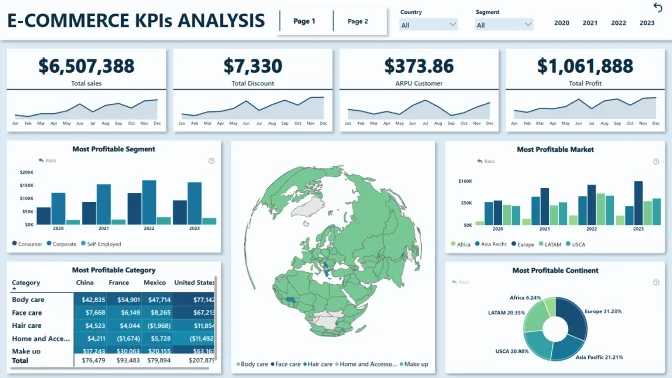
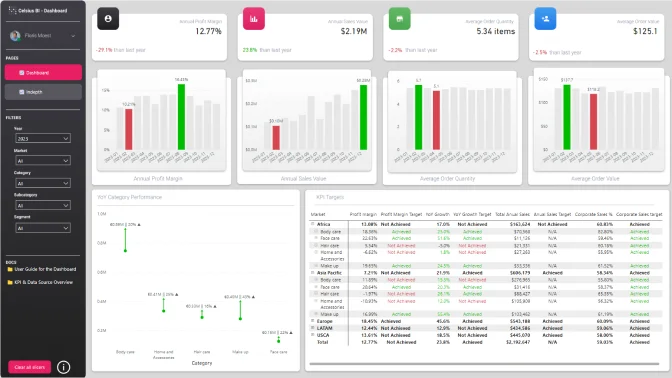
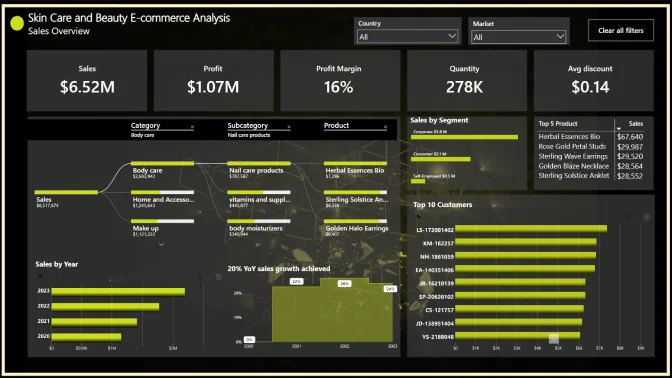
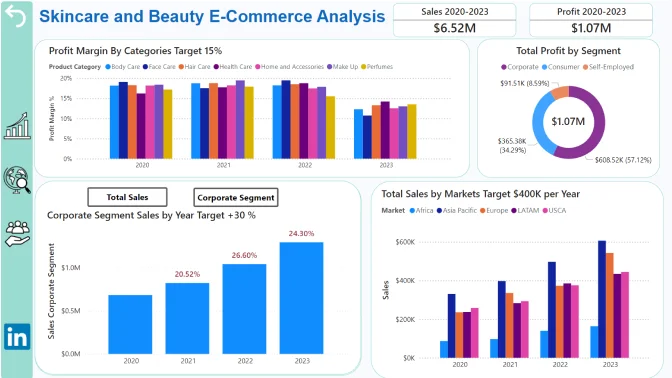
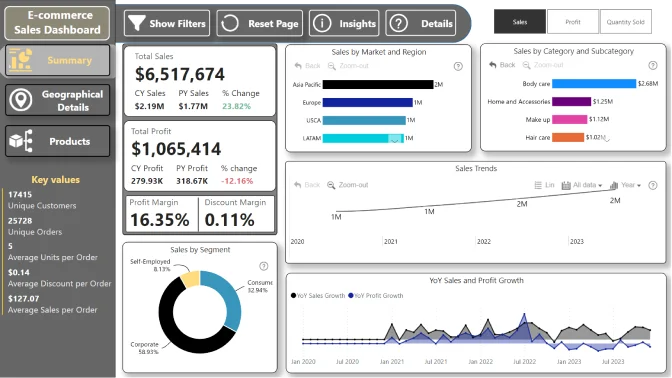
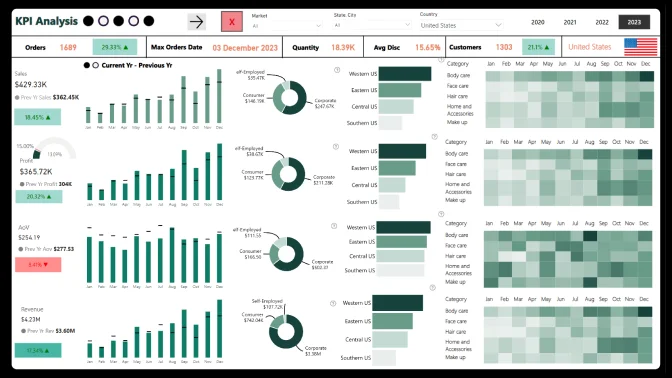
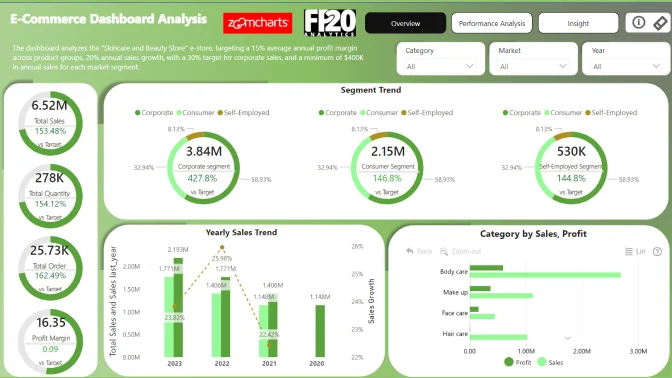
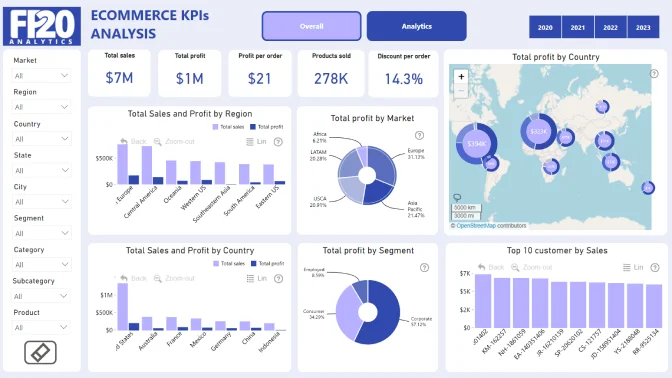
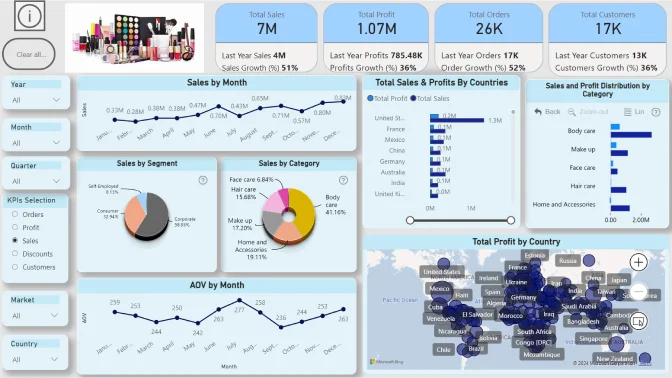
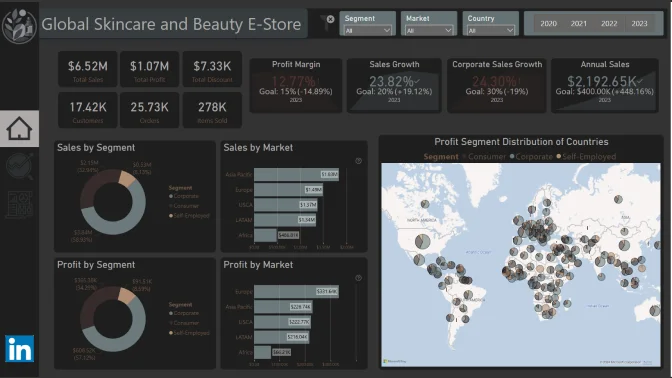
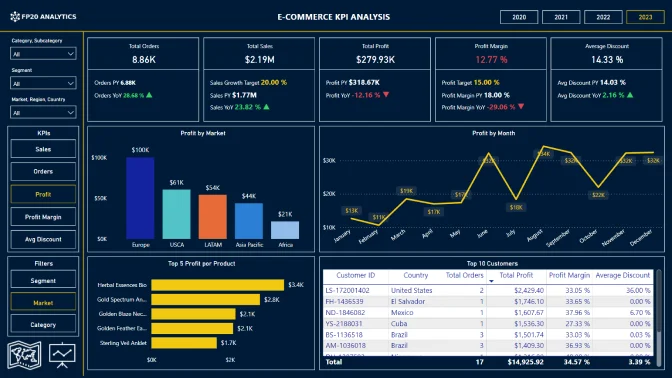
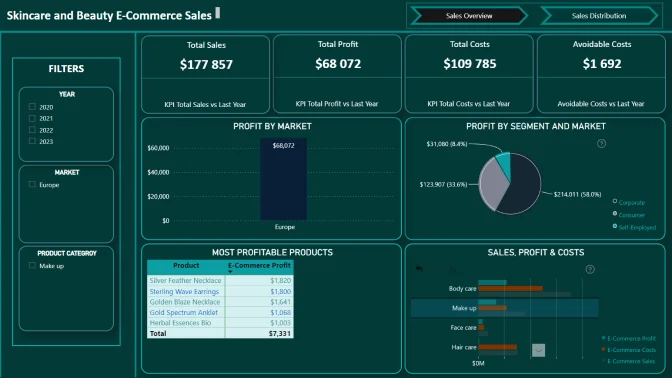
Your report should analyze sales volumes and profitability across various product groups and markets, focusing on key performance indicators (KPIs) critical to the e-store's success. Specifically, the e-store aims to achieve an average annual profit margin of 15% across all product groups, 20% annual overall sales growth with a higher target of 30% for the corporate segment, and at least $400K in annual sales for each market.

The final report should not only visualize these KPIs but also provide actionable insights that can drive strategic decision-making for the e-store's future growth.

What should your report include?

Create a report that allows end users to easily find answers to the following questions:

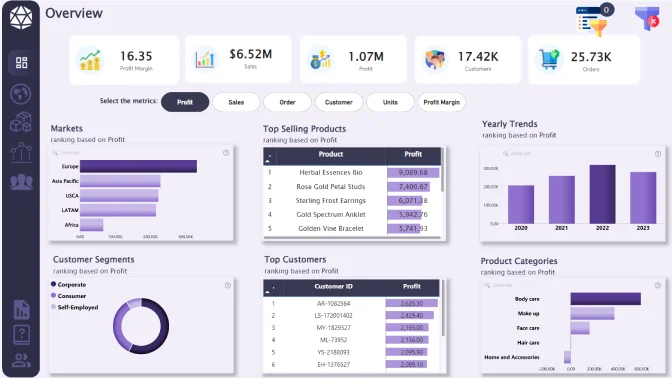
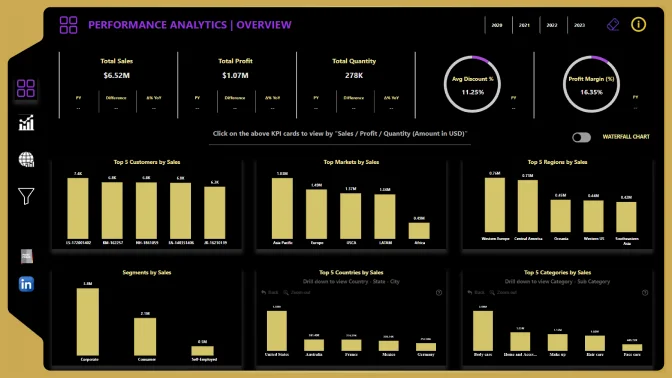
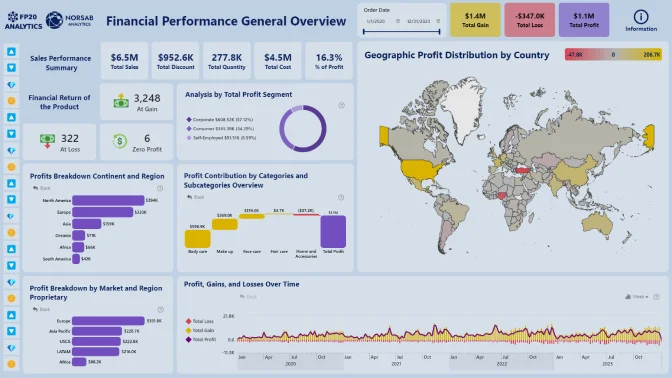
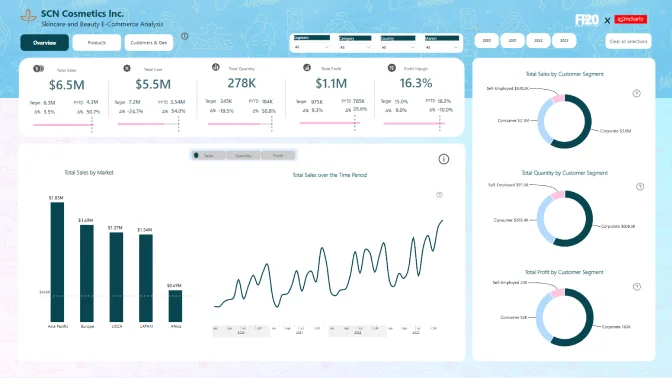
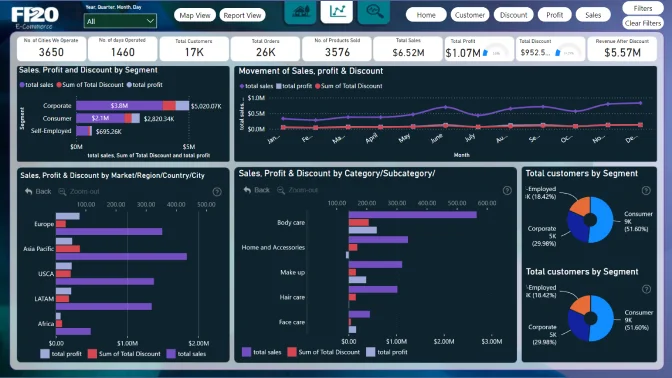
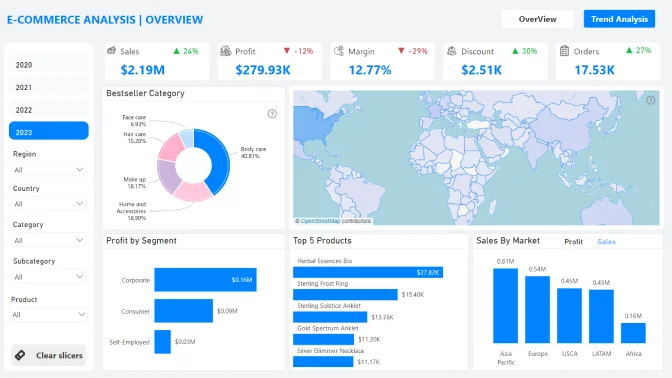
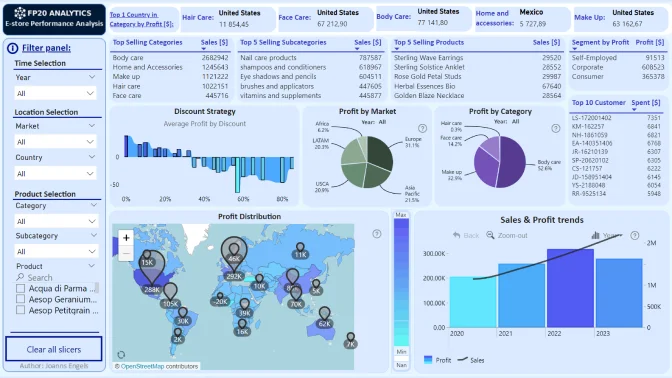
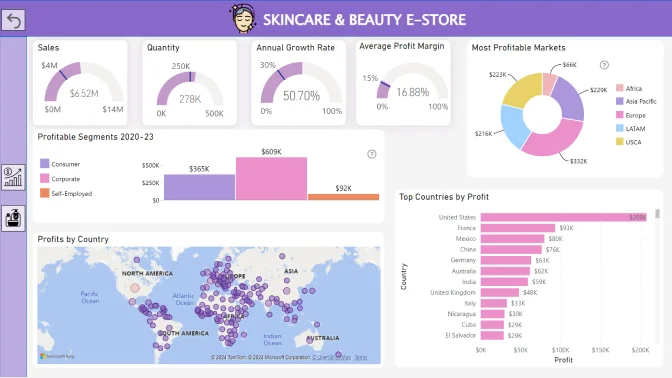
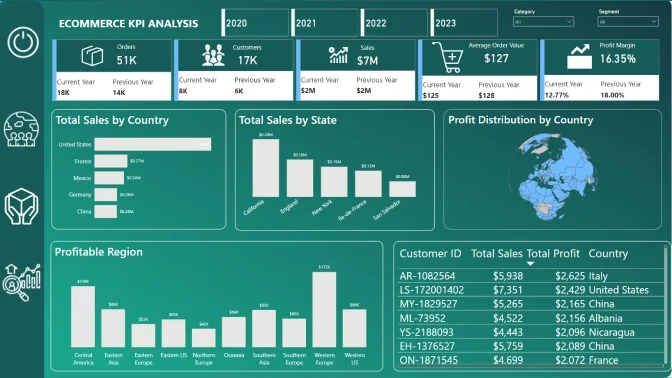
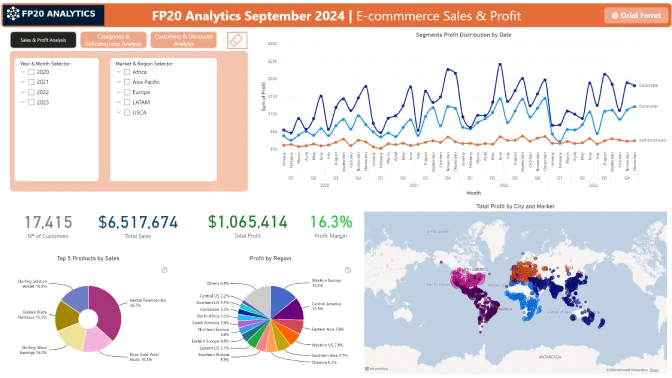
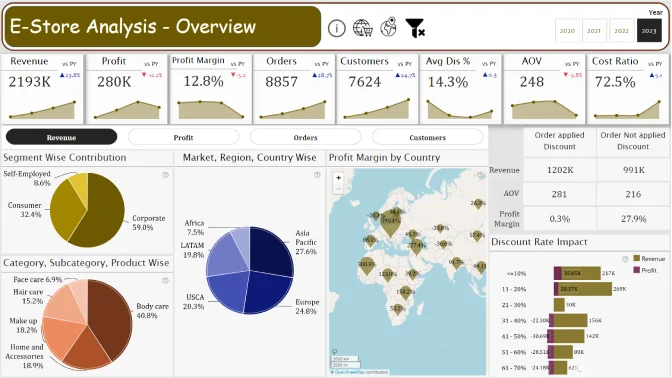
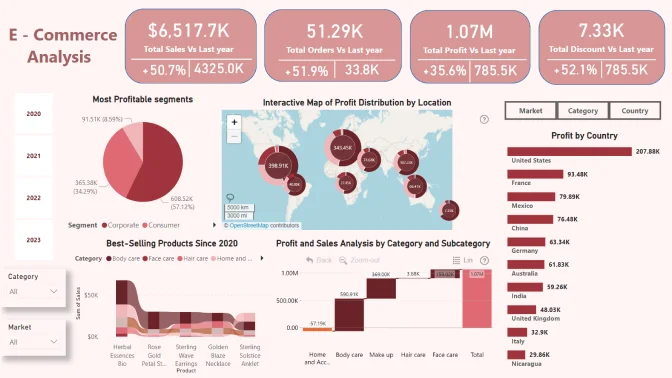
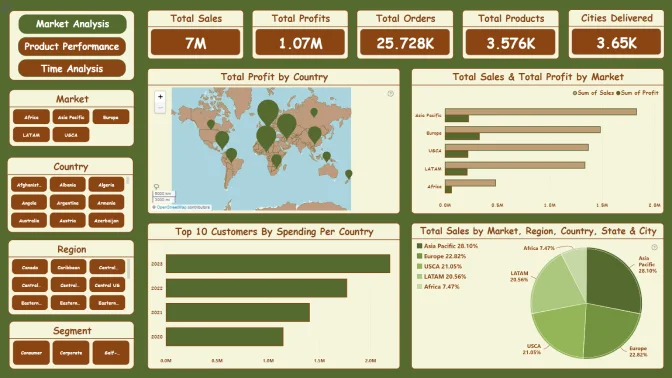
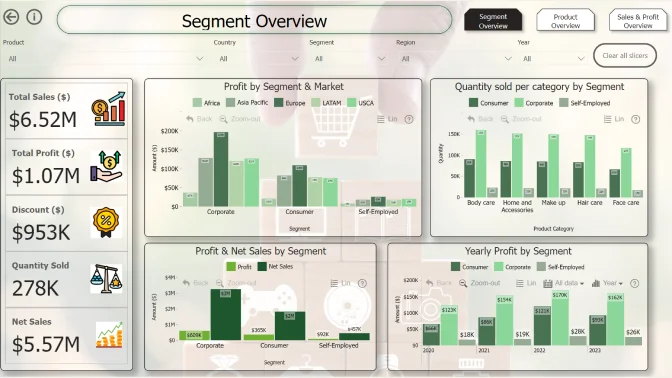
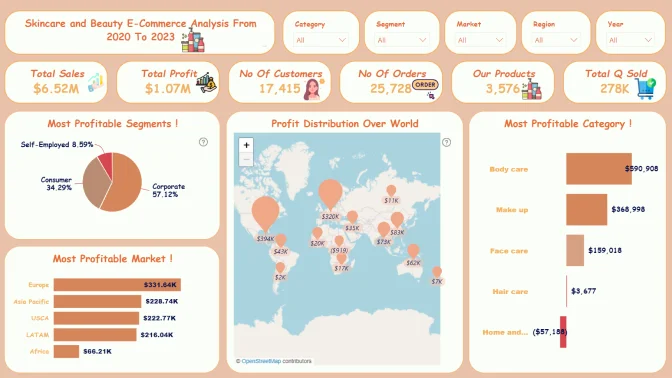
  1. What were the most profitable segments from 2020 to 2023?
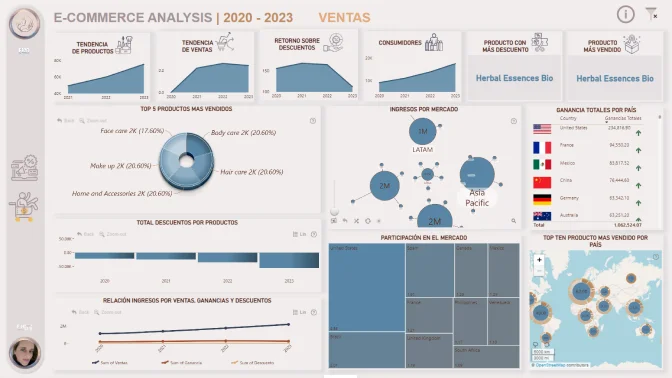
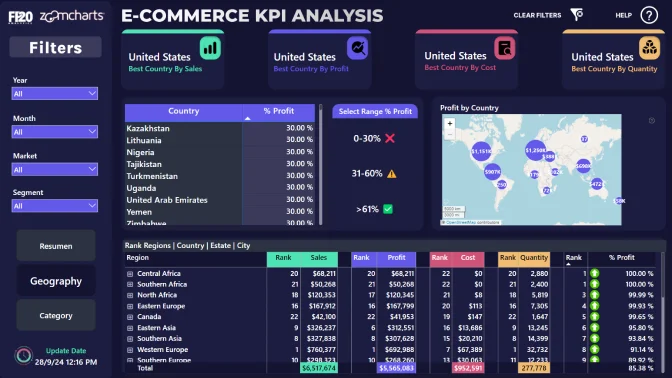
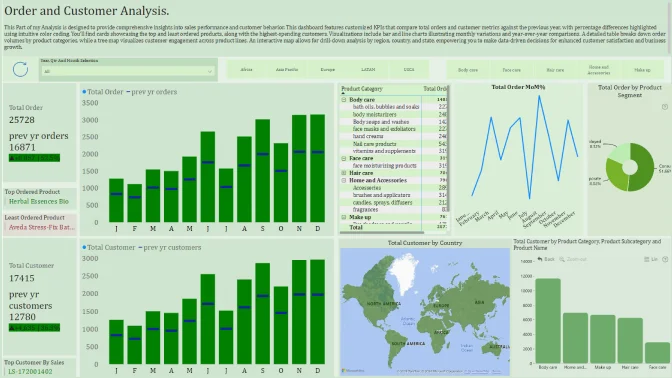
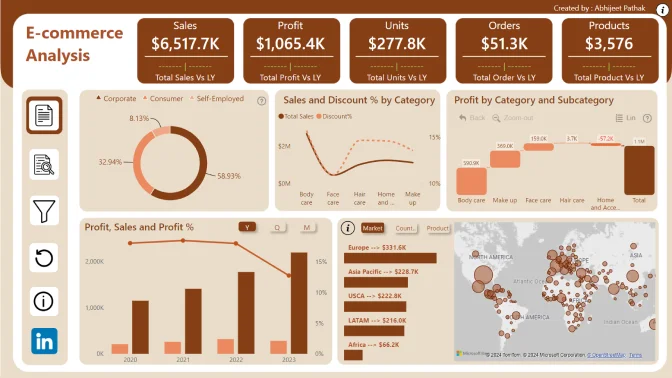
  2. Can we have a map visual to interact with locations to see the profit distribution?
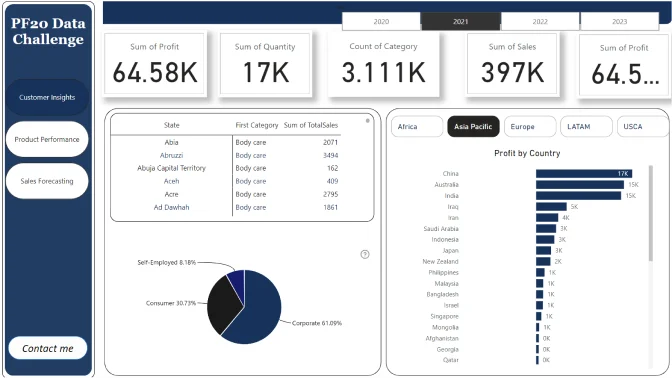
  3. What were the most profitable markets since 2020?
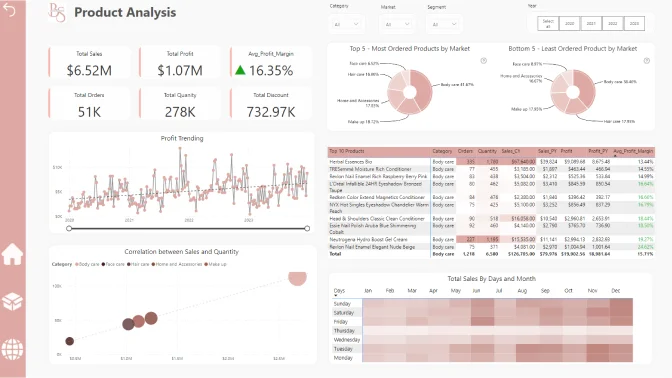
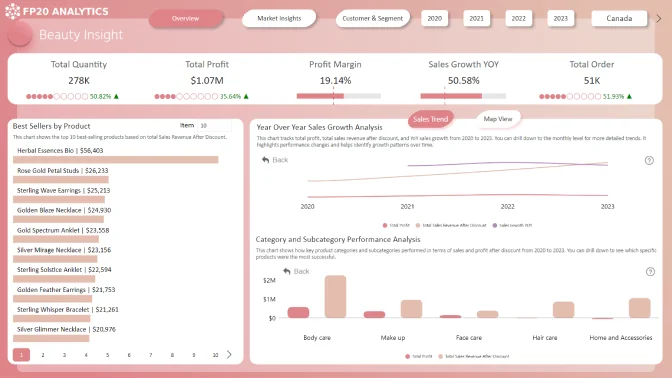
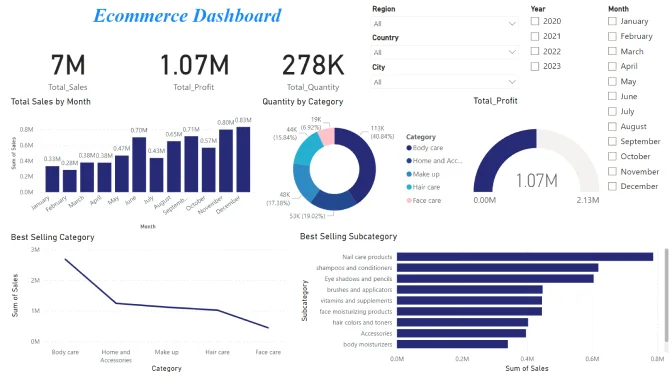
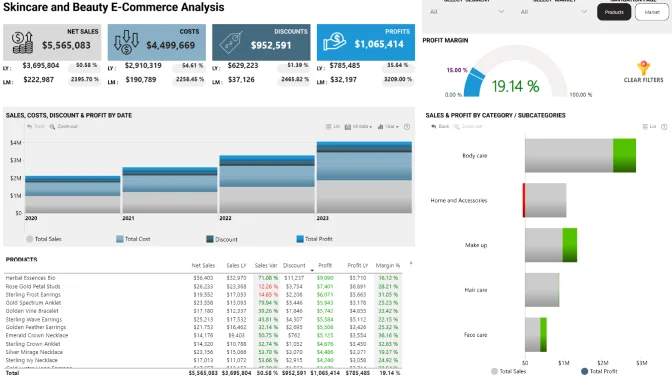
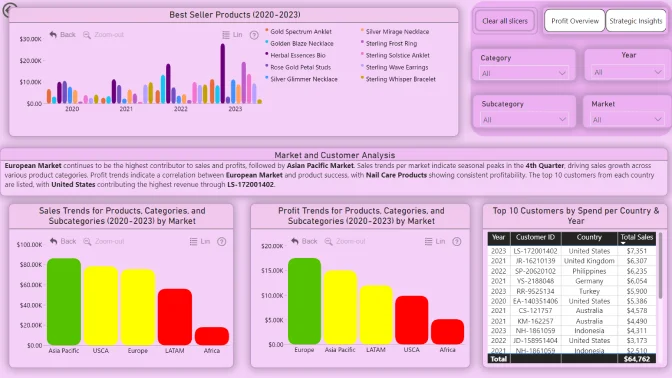
  4. What were the best selling products since 2020?
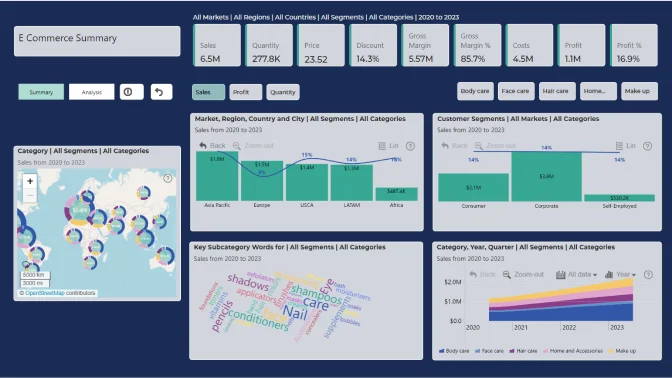
  5. Following above, can we also view the best selling categories and subcategories?
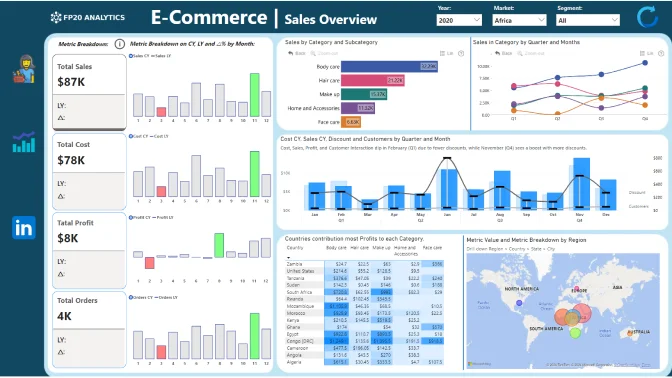
  6. In each market, can we view the sales trend of each product/category/subcategory from 2020 to 2023?
  7. In each market, can we view the profits trend of each product/category/subcategory from 2020 to 2023?
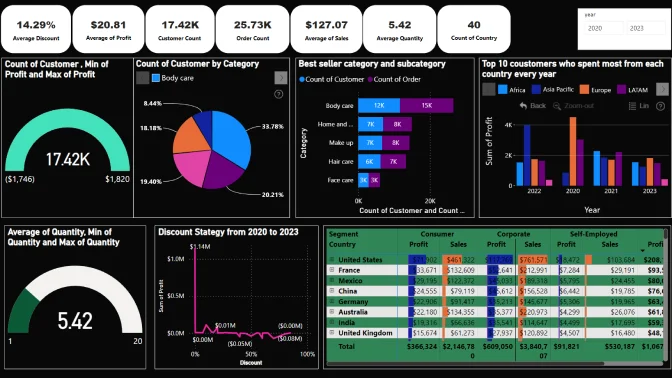
  8. Did we have a good discount strategy last a few years?
  9. Can we list top 10 customers who spent most from each country every year?
  10. Which countries contributed most profits to each category?

Technical requirements

  • Build your report using only Power BI 
  • The number of pages in the report is limited to 3 pages, including drill-through pages
  • Canvas size is 16:9 (Default Power BI size) or Full HD size = w:1920 - h:1080 
  • The report should contain at least 2 ZoomCharts Drill Down visuals within a single page. See a practical guide for using Drill Down visuals here

Judging criteria

Business users use reports to make data-driven decisions. That’s why reports are called effective if they enable users to drill down and filter data quickly and intuitively to find answers to any question they might have and analyse data in all possible directions and dimensions. We will evaluate:

  1. How easy is it to understand the data? (max 10 points)
    • Is too much text used for explanation?
    • Are the indicative colors in charts instinctually understandable?
    • Does it tell a story?
  2. How easy-to-use is the report? (max 14 points)
    • Cross-chart filtering implementation across the report. Can other visuals provide relevant data as the user explores the report?
    • Response time
    • Drill Down: multi-layer data exploration. Can the user drill down and gain additional insights within the report?
    • Use of tutorial overlays and other elements to assist new users. Can a new user start using this report straight away with just the guidance provided within the report itself?
  3. How good is the report design and is it suitable for its purpose? (max 10 points)
    • Visual design: is the overall look consistent, no empty spaces, no overcrowding?
    • Interface design: are there unnecessary visualisations/buttons/complexity in use?
    • UX design: is the produced report usable?
    • Report design: is the main challenge answered?
    • Technical: are all the fonts used the same, are the sizes readable?

You are encouraged to use various techniques at your disposal, such as tooltips, drill-throughs, drill-downs, cross-chart filtering and page navigation features, to enhance your analysis.

Timeline

Registration Open

Registration Open

30 August | 21:00

-

Submissions Open

Submissions Open

30 August | 21:00

-

Workshop | Track E-Commerce Growth Metrics with Power BI

Workshop | Track E-Commerce Growth Metrics with Power BI

17 September | 11:00

-

1:1 Mentoring Sessions

1:1 Mentoring Sessions

17 September | 11:00

30 August - 28 September

Entry Submission Deadline

Entry Submission Deadline

28 September | 21:00

30 August - 28 September

Webinar | Expert Feedback on Top 5 E-Commerce KPI Reports

Webinar | Expert Feedback on Top 5 E-Commerce KPI Reports

03 October | 11:00

30 August - 28 September

Winner Announced

Winner Announced

03 October | 11:00

30 August - 28 September

Dataset

Get the dataset

See past FP20 Analytics September 2024 challenges

See past challenges

Your Drill Down Visuals Developers License

Use the email and password provided below to log in Power BI Desktop and access an account with a license to use all ZoomCharts Drill Down Visuals.

Upon logging in, you will need to change your password and enable two-factor authentication. If you encounter any problems, feel free to reach out to us via chat.

*This Developer License can be used to create a report for this ZoomCharts Mini Challenge or for your personal training purposes. Commercial use of this license is prohibited.

Upload failed
Attach file
File requirements: 16MB

Any questions? Feel free to use chat!

Are you sure you want to delete the report?

Activate your Drill Down visuals Developer License!

You can use these credential to access ZoomCharts visuals and create your report for this ZoomCharts Mini Challenge, or for your personal training purposes.


logo
[email protected]
+44 204 577 3993
logo

Products

Drill Down Network PRO Drill Down Waterfall PRO Drill Down Graph PRO Drill Down Combo PRO Drill Down Combo Bar PRO Drill Down Donut PRO Drill Down Pie PRO Drill Down TimeSeries PRO Drill Down Timeline PRO Drill Down Map PRO Drill Down Scatter PRO All Visuals

Resources

Report Examples Webinars Blog ZoomCharts Academy Visuals Gallery Documentation Custom Visual Development Subscribe to News

Solutions

Custom Visual Development

Company

Pricing About Us Partners Leave feedback Join PowerGroup EU Funding

Help

ZoomCharts Assistance Contact Sales Contact Support FAQ

Drill Down Network PRO Drill Down Waterfall PRO Drill Down Graph PRO Drill Down Combo PRO Drill Down Combo Bar PRO Drill Down Donut PRO Drill Down Pie PRO Drill Down TimeSeries PRO Drill Down Timeline PRO Drill Down Map PRO Drill Down Scatter PRO All Visuals

Report Examples Webinars Blog ZoomCharts Academy Visuals Gallery Documentation Custom Visual Development Subscribe to News

Custom Visual Development

Pricing About Us Partners Leave feedback Join PowerGroup EU Funding

ZoomCharts Assistance Contact Sales Contact Support FAQ
+44 204 577 3993
[email protected]

Ready to get in touch?

Contact our experts with any question about Power BI and ZoomCharts for Free!

Contact us

© 2025, Data Visualization Software Lab

U.S. Patents No. 11,645,343; 11,921,804

Cookies Policy
Manage cookies
Privacy Policy
Global
EULA
Patent
warning

Error message

success

Success info: Done!

ZoomCharts AI Assistant

We noticed you're using an old OS version.

For the best experience, we recommend upgrading to ensure that all website features display correctly.

Cookie settings

We use necessary cookies for site functionality, as well as statistic, marketing, and preference cookies to enhance your experience. For more information and to manage your preferences, please visit our Cookie policy