1265
E-Commerce Dashboard
E-Commerce Dashboard
More Report pages
Report Author: Spurthy Ramappa
1265
Share template with others
Report submitted for FP20 Analytics ZoomCharts Challenge 19 (September 2024). The report was built with the E-commerce KPI Analysis dataset and includes ZoomCharts custom Drill Down PRO visuals for Power BI.
Author's description:
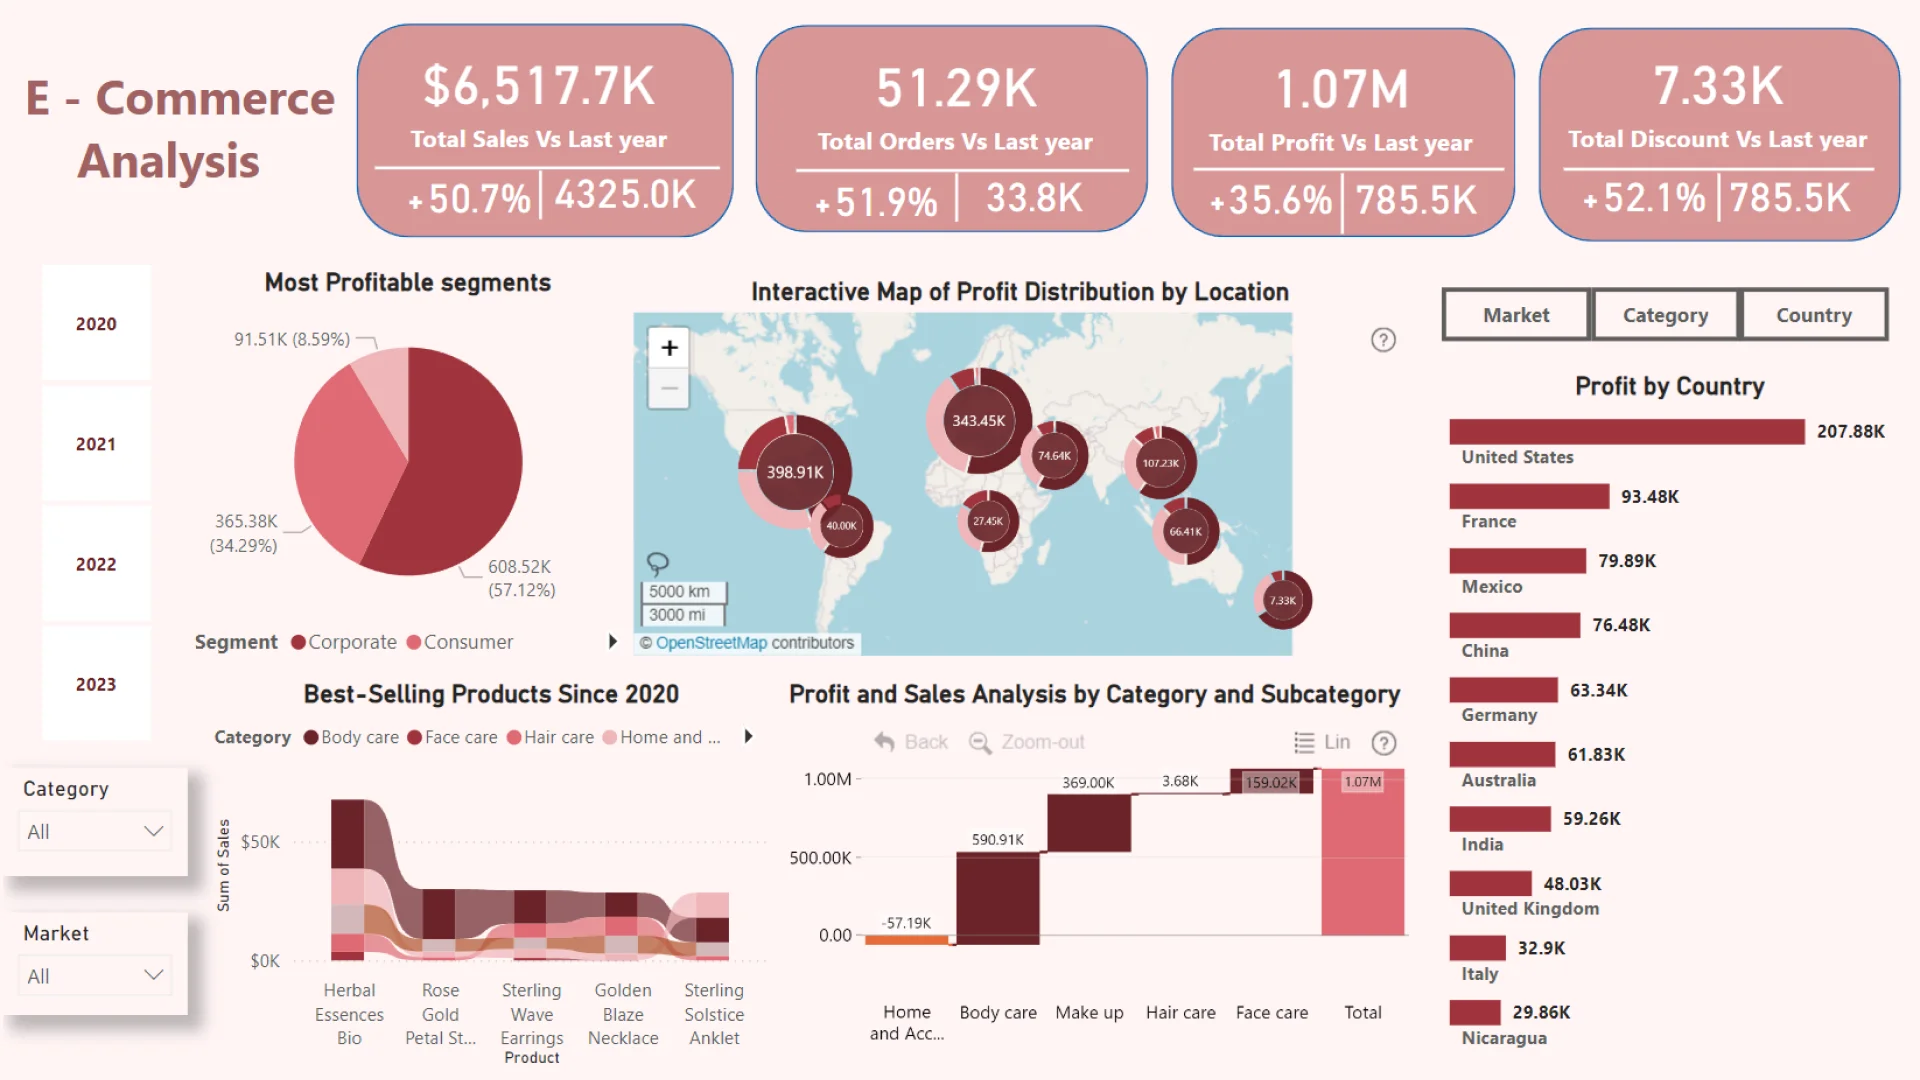
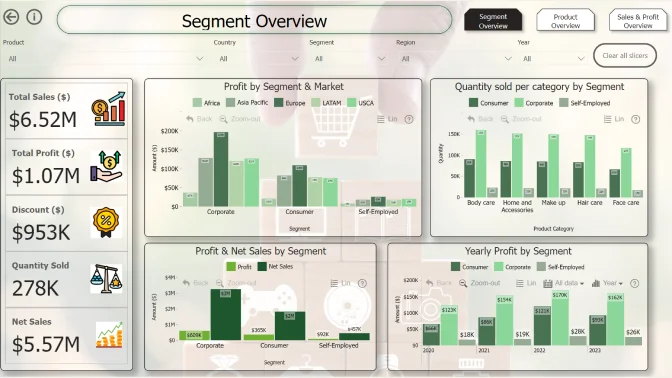
This e-commerce dashboard provides a comprehensive overview of sales, profit, and customer trends. Total sales have grown by 50.7% compared to the previous year, with the consumer segment leading in profitability (57.12%).
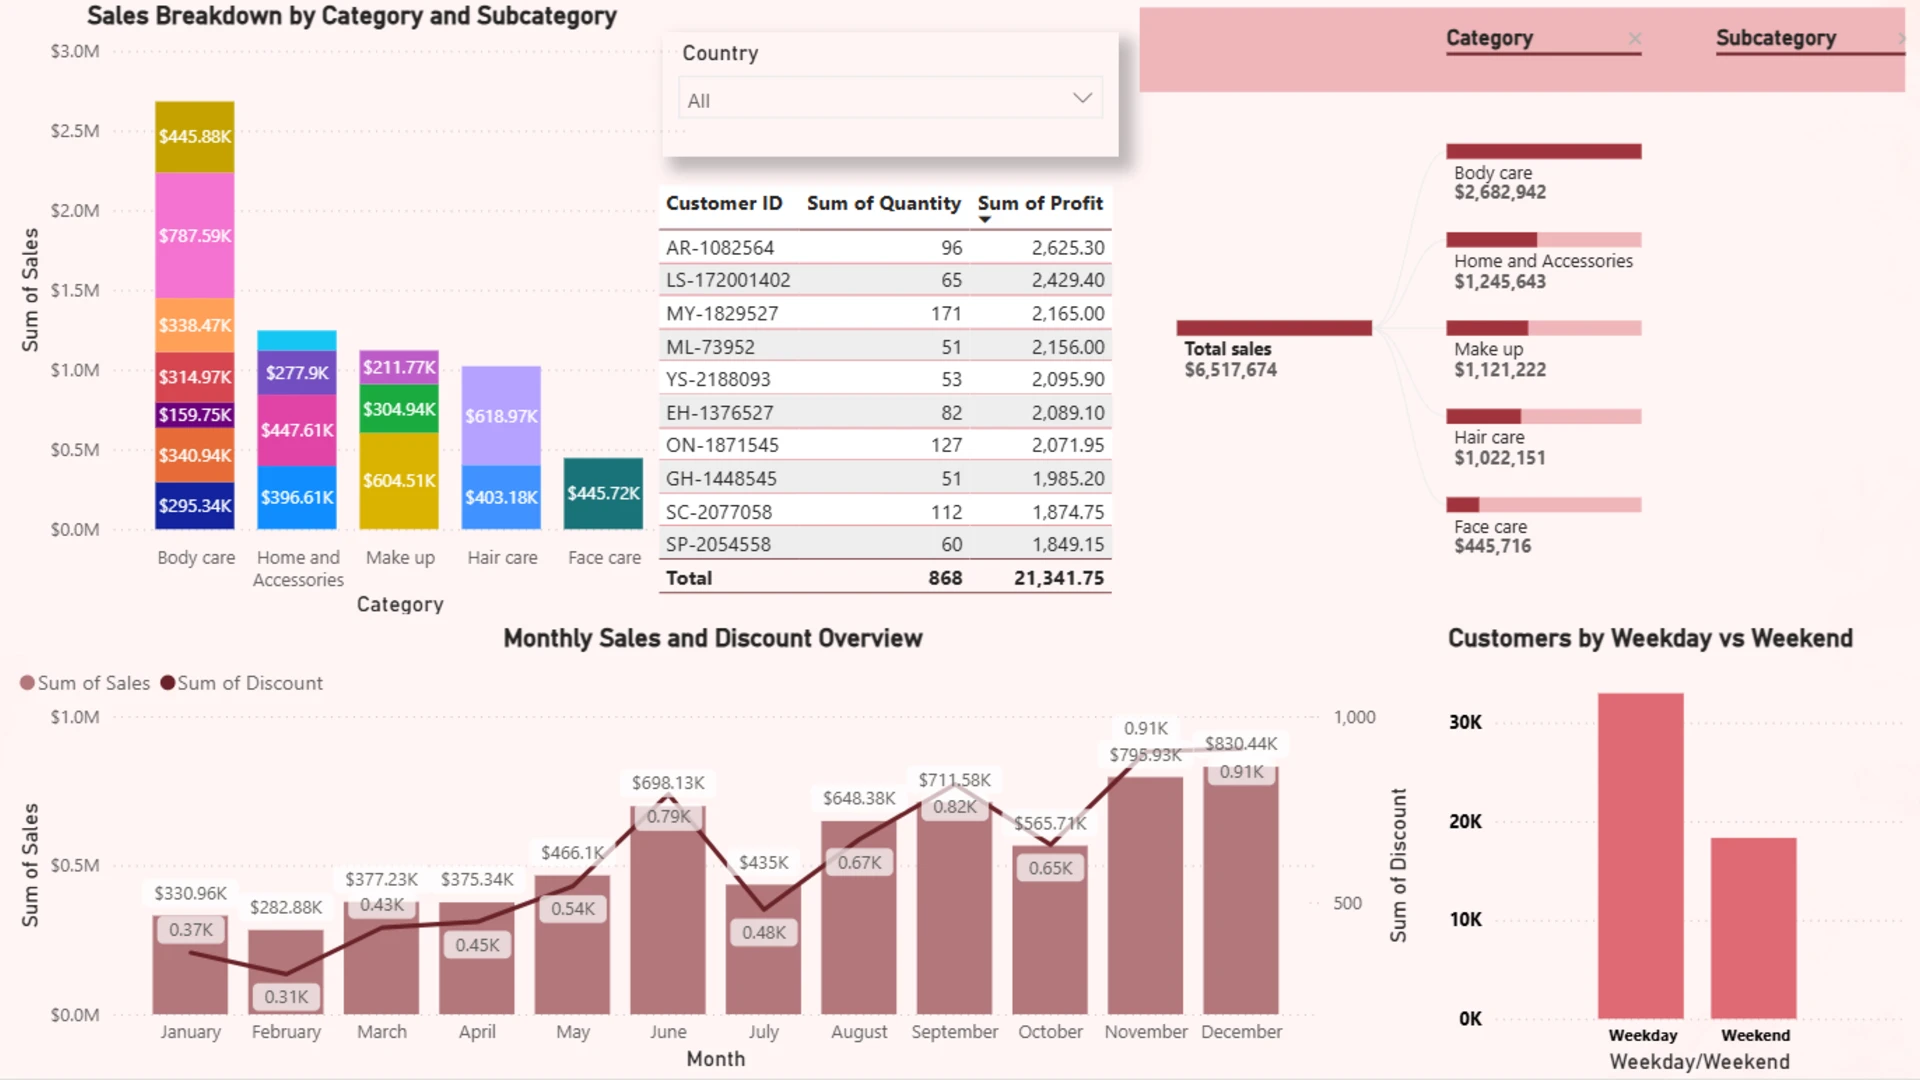
The U.S. is the top market in terms of profit, followed by France and Mexico. Body care products are the best-selling category, contributing $2.6M to total sales, and weekdays show higher customer engagement than weekends.
June and November are peak months for sales, driven by significant discounts. This dashboard offers actionable insights to optimize business strategies across markets and product categories.
4U Report Challenges
Participate in data challenges, build and submit reports to get free template downloads.
Join CommunityMobile view allows you to interact with the report. To Download the template please switch to desktop view.
Was this helpful? Thank you for your feedback!
Sorry about that.
How can we improve it?