1089
Beauty Insights
Beauty Insights
Report Author: Zeya Mosharraf
1089
Share template with others
Report submitted for FP20 Analytics ZoomCharts Challenge 19 (September 2024). The report was built with the E-commerce KPI Analysis dataset and includes ZoomCharts custom Drill Down PRO visuals for Power BI.
Author's description:
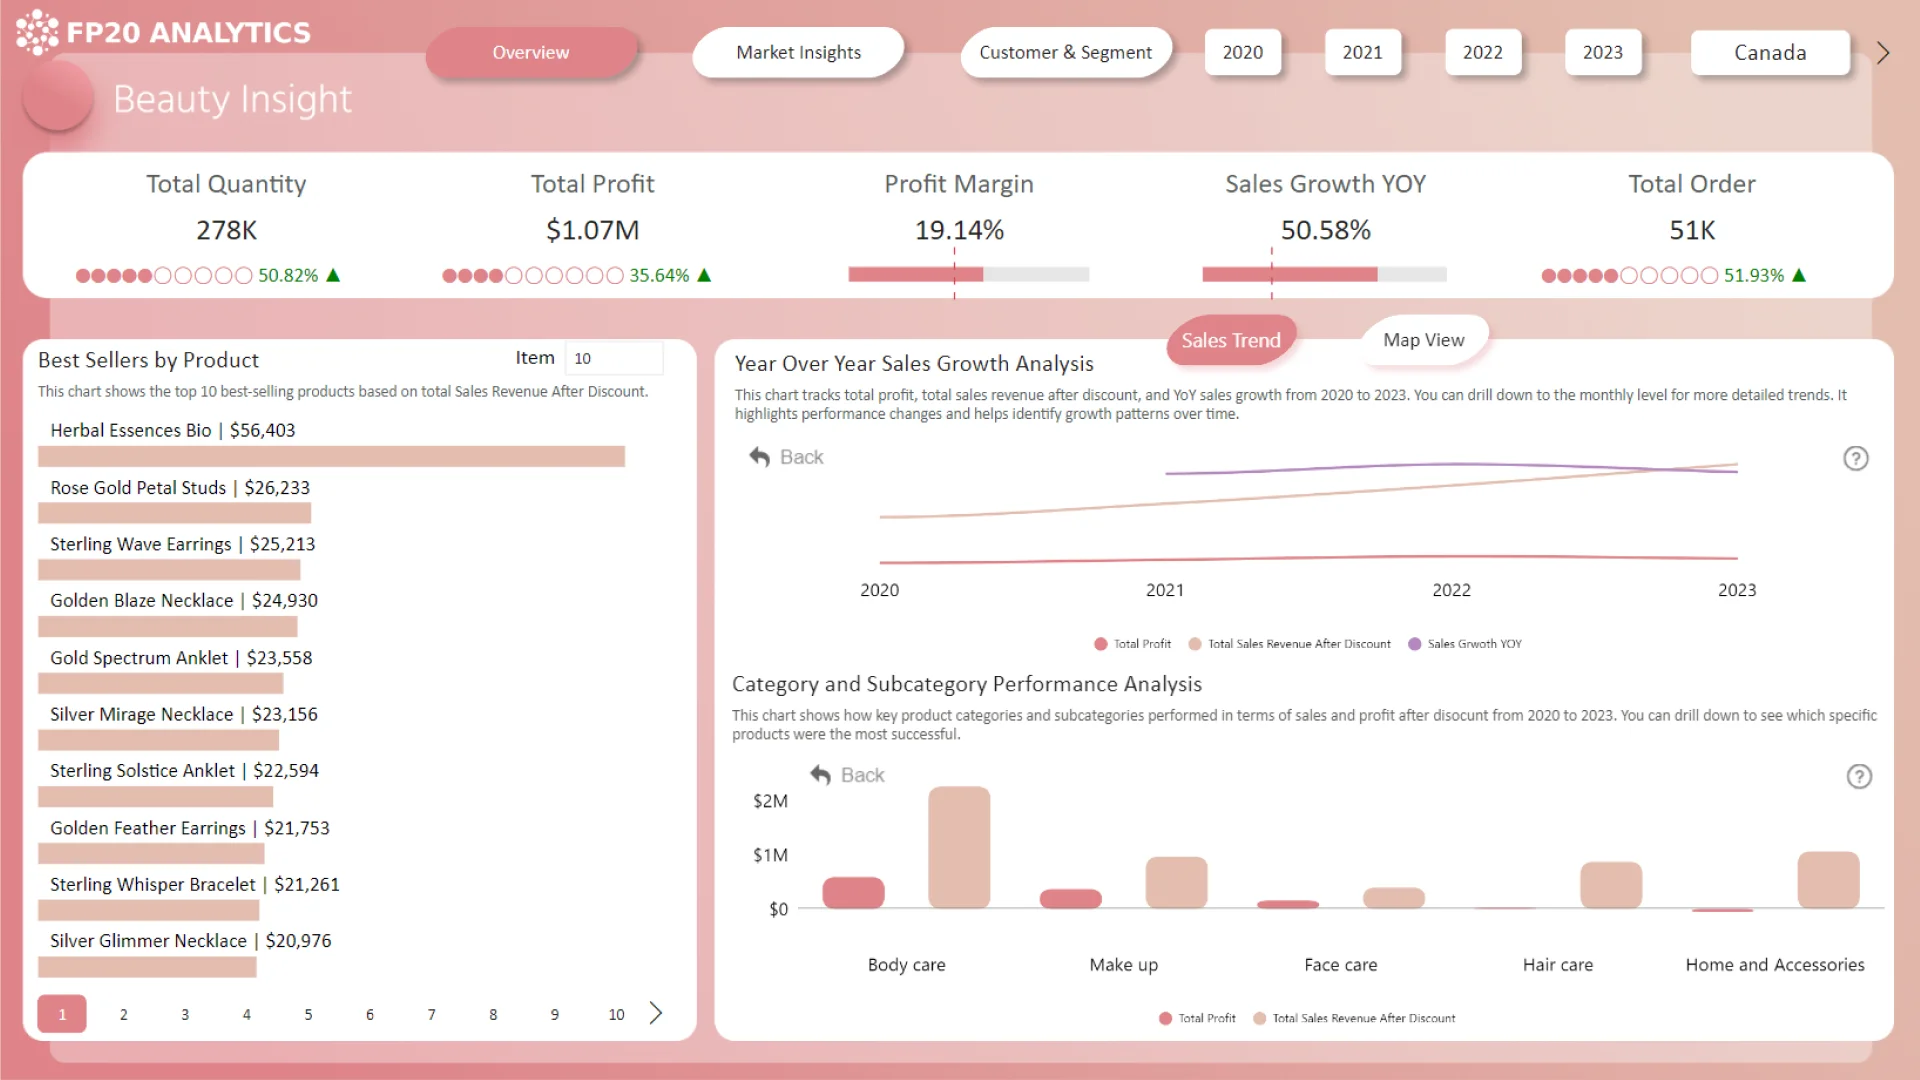
In this project, I used Power BI to analyze key performance indicators (KPIs) such as sales volumes, profitability, and customer behavior for a global skincare and beauty e-store from 2020 to 2023. My report includes interactive features like drill up/down and bookmarks, allowing users to seamlessly switch between map and visual views. It highlights the most profitable markets, segments, and best-selling products, while also providing detailed insights into sales growth and profit trends across product categories. Additionally, the report features an analysis of the top 10 customers by country each year, offering valuable insights into customer spending. This dynamic report aims to deliver actionable insights to help the e-store achieve its goals of profitability and sales growth.


4U Report Challenges
Participate in data challenges, build and submit reports to get free template downloads.
Join CommunityMobile view allows you to interact with the report. To Download the template please switch to desktop view.
How to use a PBIX template
Preview the interactive report, download the PBIX file, open it in Power BI Desktop, and replace the same data connection with your own dataset.
Preview and download
Explore the report online and download the PBIX template file.
Open in Power BI Desktop
Open the downloaded PBIX file in Power BI Desktop.
Connect your data
Replace the sample data source with your own dataset.
Refresh and adjust
Refresh the model and update fields or visual were needed.
Save and share
Save your report and publish it for your audience.


