logo
For Power BI
  • Products
    • Custom Visuals for Power BI
    • Report Templates
  • Resources

      Resources

    • Documentation
    • Report Examples
    • Blog
    • Webinars
    • Video Tutorials
    • Visuals Gallery

    Support

    • ZoomCharts Assistance
    • Contact Sales
    • Contact Support
    • FAQ

    Challenges

    Challenges

    Improve your report creation skills by participating in free challenges for report creators.

    Learn more
    Get Developer License
  • Services
    • Power BI Report Development
    • Custom Visual Development
  • Challenges
  • Pricing
Get started
Get started
Get it now
Go back

Contents

Dashboard and report examples Power BI Cosmetics E-Commerce Dashboard
Go back

10006

Power BI Cosmetics E-Commerce Dashboard

Power BI Cosmetics E-Commerce Dashboard

Report
Report
Report

More Report pages

Report
Report
Report
Report
Report
Report
Report Interact

Report Author: Misha Riaz

10006

Combo Combo Bar Map Donut Ecommerce

Share template with others

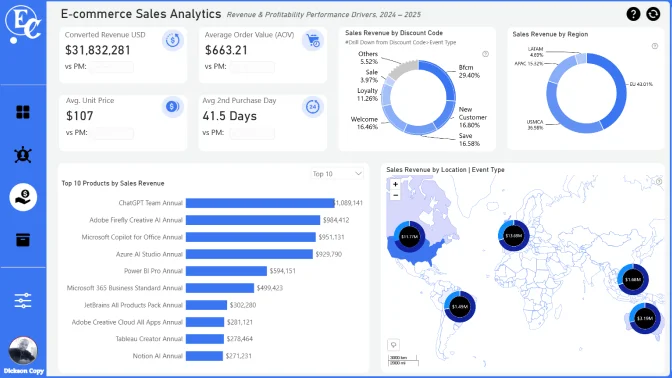
Power BI Beauty & E-Commerce KPI Dashboard

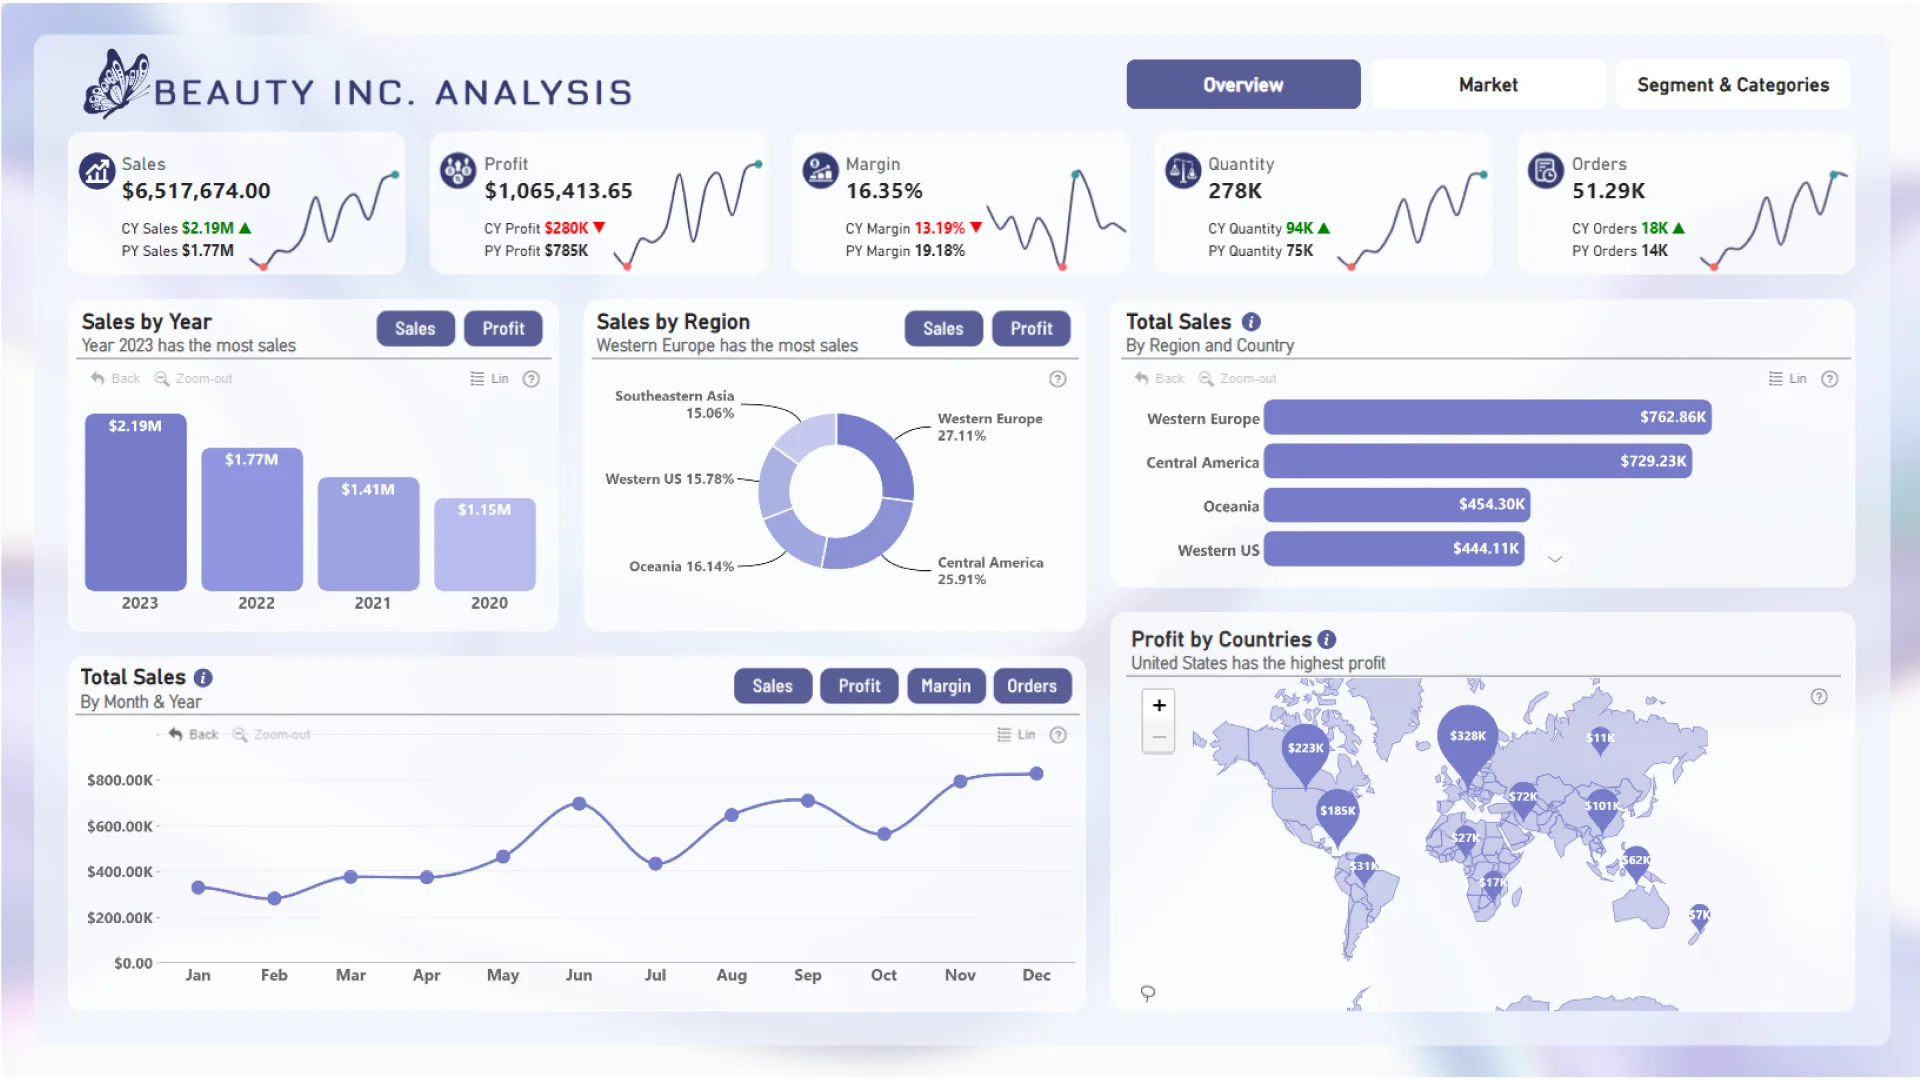
This Power BI Beauty and E-commerce KPI dashboard delivers a comprehensive analysis of sales, profit, and customer performance across regions, segments, and product categories. Designed for retail, beauty brands, and online businesses, this interactive report enables decision-makers to track key performance indicators, uncover growth opportunities, and optimize profitability with data-driven insights.

Built using the E-commerce KPI Analysis dataset and enhanced with ZoomCharts Drill Down PRO visuals for Power BI, the dashboard combines advanced interactivity with a clean, modern design that can be easily customized to match your brand.

This report was submitted for the FP20 Analytics ZoomCharts Challenge 19 (September 2024).


Key Metrics of This Report

This Power BI sales and profit dashboard provides deep insights into business performance from 2020 to 2023, including:

  • Sales Performance: total sales, yearly trends, monthly breakdowns, and regional distribution
  • Profit Analysis: profit totals, margin trends, and profitability by market and segment
  • Order and Quantity Insights: order volume, product demand, and sales growth patterns
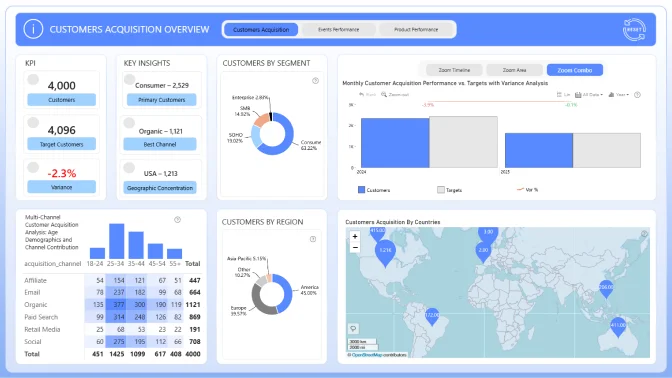
  • Customer Analytics: customer distribution by country, segment, and purchasing behavior
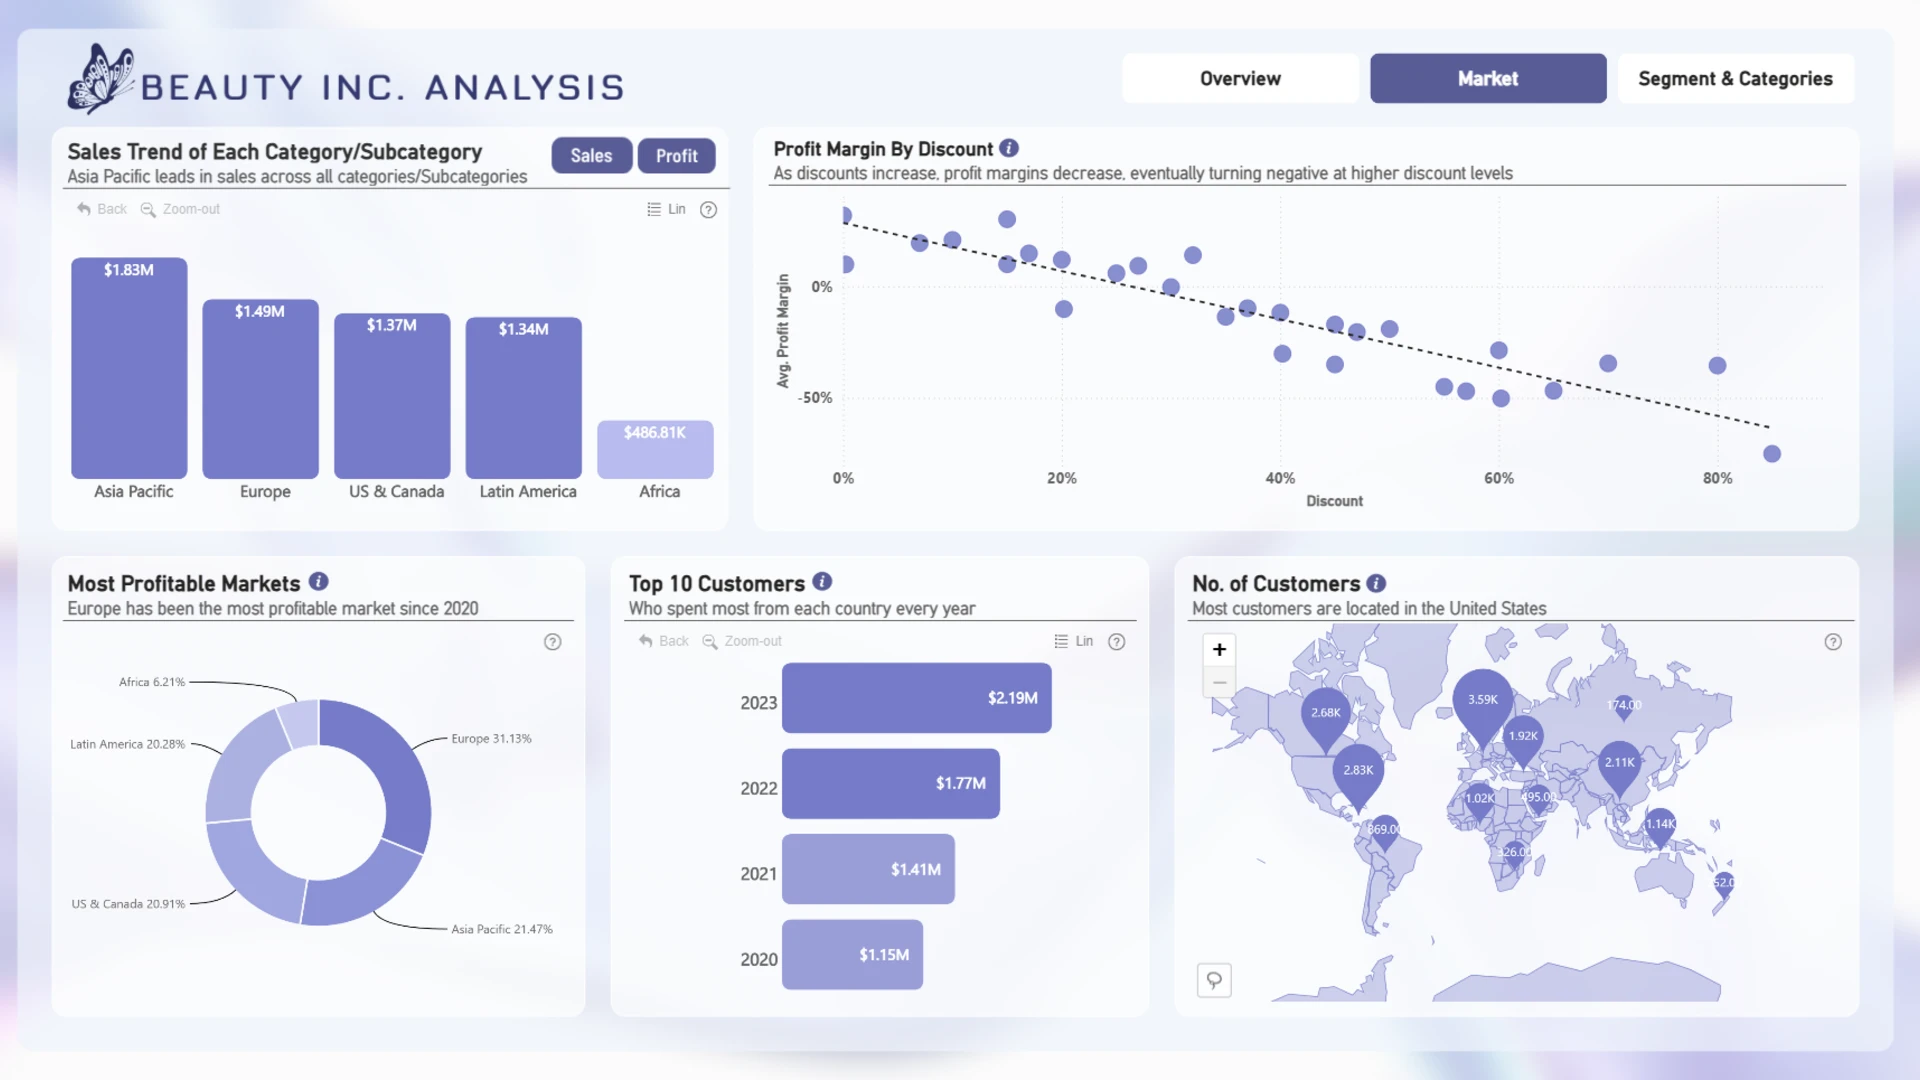
  • Discount Impact: analysis of how discount levels affect profit margins
  • Top Performers: best-selling products, top customers, and highest contributing countries

Business Insights You Can Discover

  • Identify top-performing regions such as Western Europe and Asia Pacific
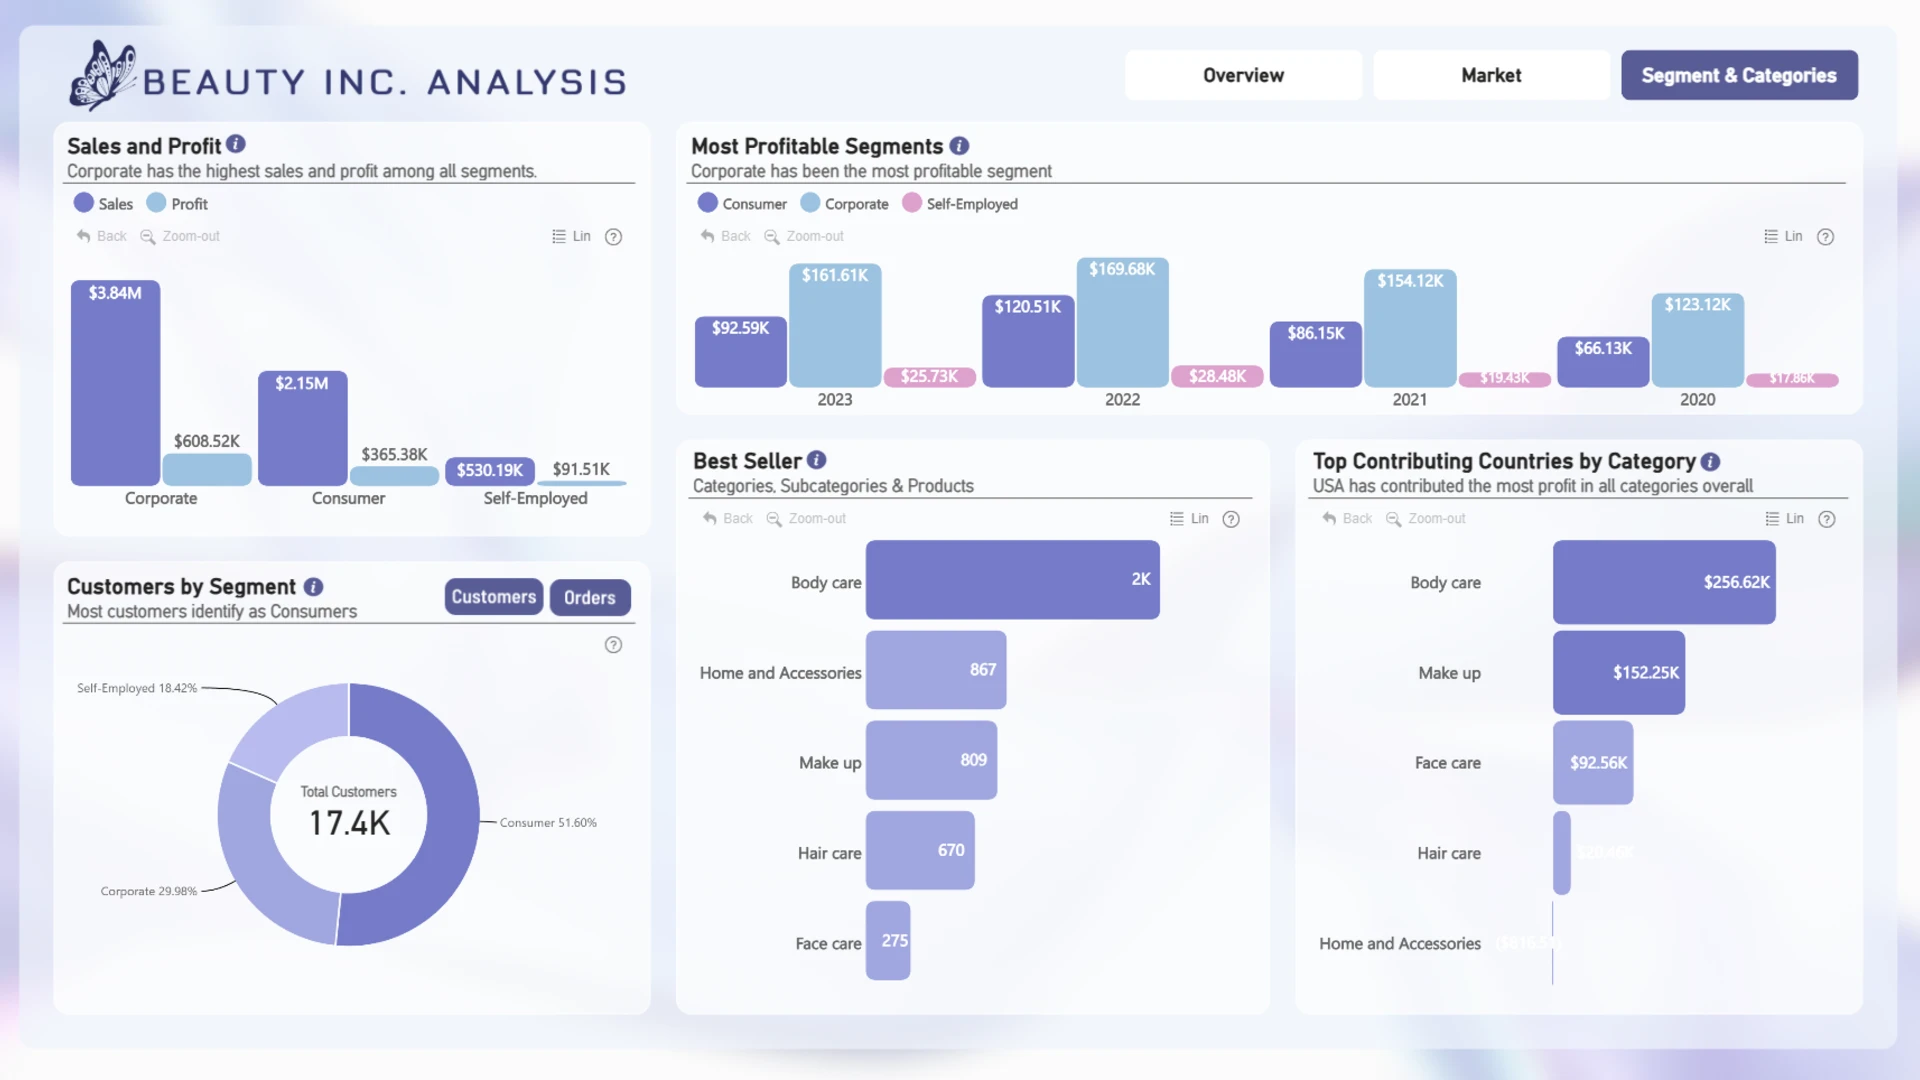
  • Analyze most profitable markets and segments such as Corporate customers
  • Track sales growth trends across years and months
  • Understand product category performance including Body care, Make up, and Hair care
  • Evaluate how discount strategies impact profitability
  • Explore customer distribution globally with interactive map visuals

All visuals are fully interactive, enabling cross-filtering and drill-down capabilities for deeper analysis at every level, from global overview to individual product or customer insights.


How To Use This Report Template

To explore this Power BI dashboard:

  • Click on any chart element to filter the entire report
  • Use navigation tabs (Overview, Market, Segment and Categories) to switch perspectives
  • Drill down into regions, categories, and time periods for more granular insights
  • Hover over visuals to view detailed tooltips

Start Using This Dashboard

Download this Power BI report template, connect your own data, and start analyzing your business performance in minutes.
Leverage ready-made calculations, interactive visuals, and a proven dashboard structure to accelerate your reporting and gain actionable insights faster.


This Power BI retail and e-commerce analytics dashboard is ideal for businesses looking to improve sales performance, profitability, and customer insights through powerful, interactive data visualization.

ZoomCharts visuals used

Drill Down Donut PRO (Pin) Drill Down Donut PRO (Pin)
Drill Down Combo PRO Drill Down Combo PRO
Drill Down Combo Bar PRO Drill Down Combo Bar PRO
Drill Down Map PRO Drill Down Map PRO

4U Report Challenges

Participate in data challenges, build and submit reports to get free template downloads.

Join Community

Mobile view allows you to interact with the report. To Download the template please switch to desktop view.

Similar reports

All Reports 46 results
New
Report Card

E-Commerce Power BI Report 3

512

New
Report Card

E-Commerce Power BI Report

550

New
Report Card

E-Commerce Sales Analytics 18

454

Explore all reports

Was this helpful? Thank you for your feedback!

Sorry about that.

How can we improve it?

Power BI Cosmetics E-Commerce Dashboard

Report Author: Misha Riaz

10006

ZoomCharts

Welcome to ZoomCharts

You’re almost there! Create an account to download reports.

or
Sign up with Microsoft

Verify your email address

We have sent a code to your email address. Please input the code below.

Didn't receive code? Request again (after 30 seconds)

Already have an account? Log in

ZoomCharts

Log in to your ZoomCharts account

Log in with Microsoft
or
Forgot password?

Reset your password

We'll email you instructions on how to reset your password

Don't have an account? Sign up

Please add credits

You have 0 available downloads.
Get more credits or upgrade your plan to continue.

View pricing
logo
[email protected]
+44 204 577 3993
logo

Products

Drill Down Bubble PRO Drill Down Line PRO Drill Down Network PRO Drill Down Waterfall PRO Drill Down Graph PRO Drill Down Combo PRO Drill Down Combo Bar PRO Drill Down Donut PRO Drill Down Pie PRO Drill Down TimeSeries PRO Drill Down Timeline PRO Drill Down Map PRO Drill Down Scatter PRO All Visuals

Resources

Report Examples Webinars Blog ZoomCharts Academy Visuals Gallery Documentation Custom Visual Development Subscribe to News

Solutions

Custom Visual Development

Company

Pricing About Us Partners Leave feedback Join PowerGroup EU Funding

Help

ZoomCharts Assistance Contact Sales Contact Support FAQ AI Information

Drill Down Line PRO Drill Down Bubble PRO Drill Down Network PRO Drill Down Waterfall PRO Drill Down Graph PRO Drill Down Combo PRO Drill Down Combo Bar PRO Drill Down Donut PRO Drill Down Pie PRO Drill Down TimeSeries PRO Drill Down Timeline PRO Drill Down Map PRO Drill Down Scatter PRO All Visuals

Report Examples Webinars Blog ZoomCharts Academy Visuals Gallery Documentation Custom Visual Development Subscribe to News

Custom Visual Development

Pricing About Us Partners Leave feedback Join PowerGroup EU Funding

ZoomCharts Assistance Contact Sales Contact Support FAQ AI Information
+44 204 577 3993
[email protected]

Ready to get in touch?

Contact our experts with any question about Power BI and ZoomCharts for Free!

Contact us

© 2026, Data Visualization Software Lab

U.S. Patents No. 11,645,343; 11,921,804; 12,346,389

Cookies
Privacy Policy
Global
Legal
Patent
warning

Error message

success

Success info: Done!

ZoomCharts AI Assistant

We noticed you're using an old OS version.

For the best experience, we recommend upgrading to ensure that all website features display correctly.

Cookie settings

We use necessary cookies for site functionality, as well as statistic, marketing, and preference cookies to enhance your experience. For more information and to manage your preferences, please visit our Cookie policy