Visuals in Planning
Power BI custom visuals -
what should we build next?
Explore upcoming visuals and tell us which ones matter most to you.
The concept catalogue
Tap any card to see details, leave feedback, or sponsor.
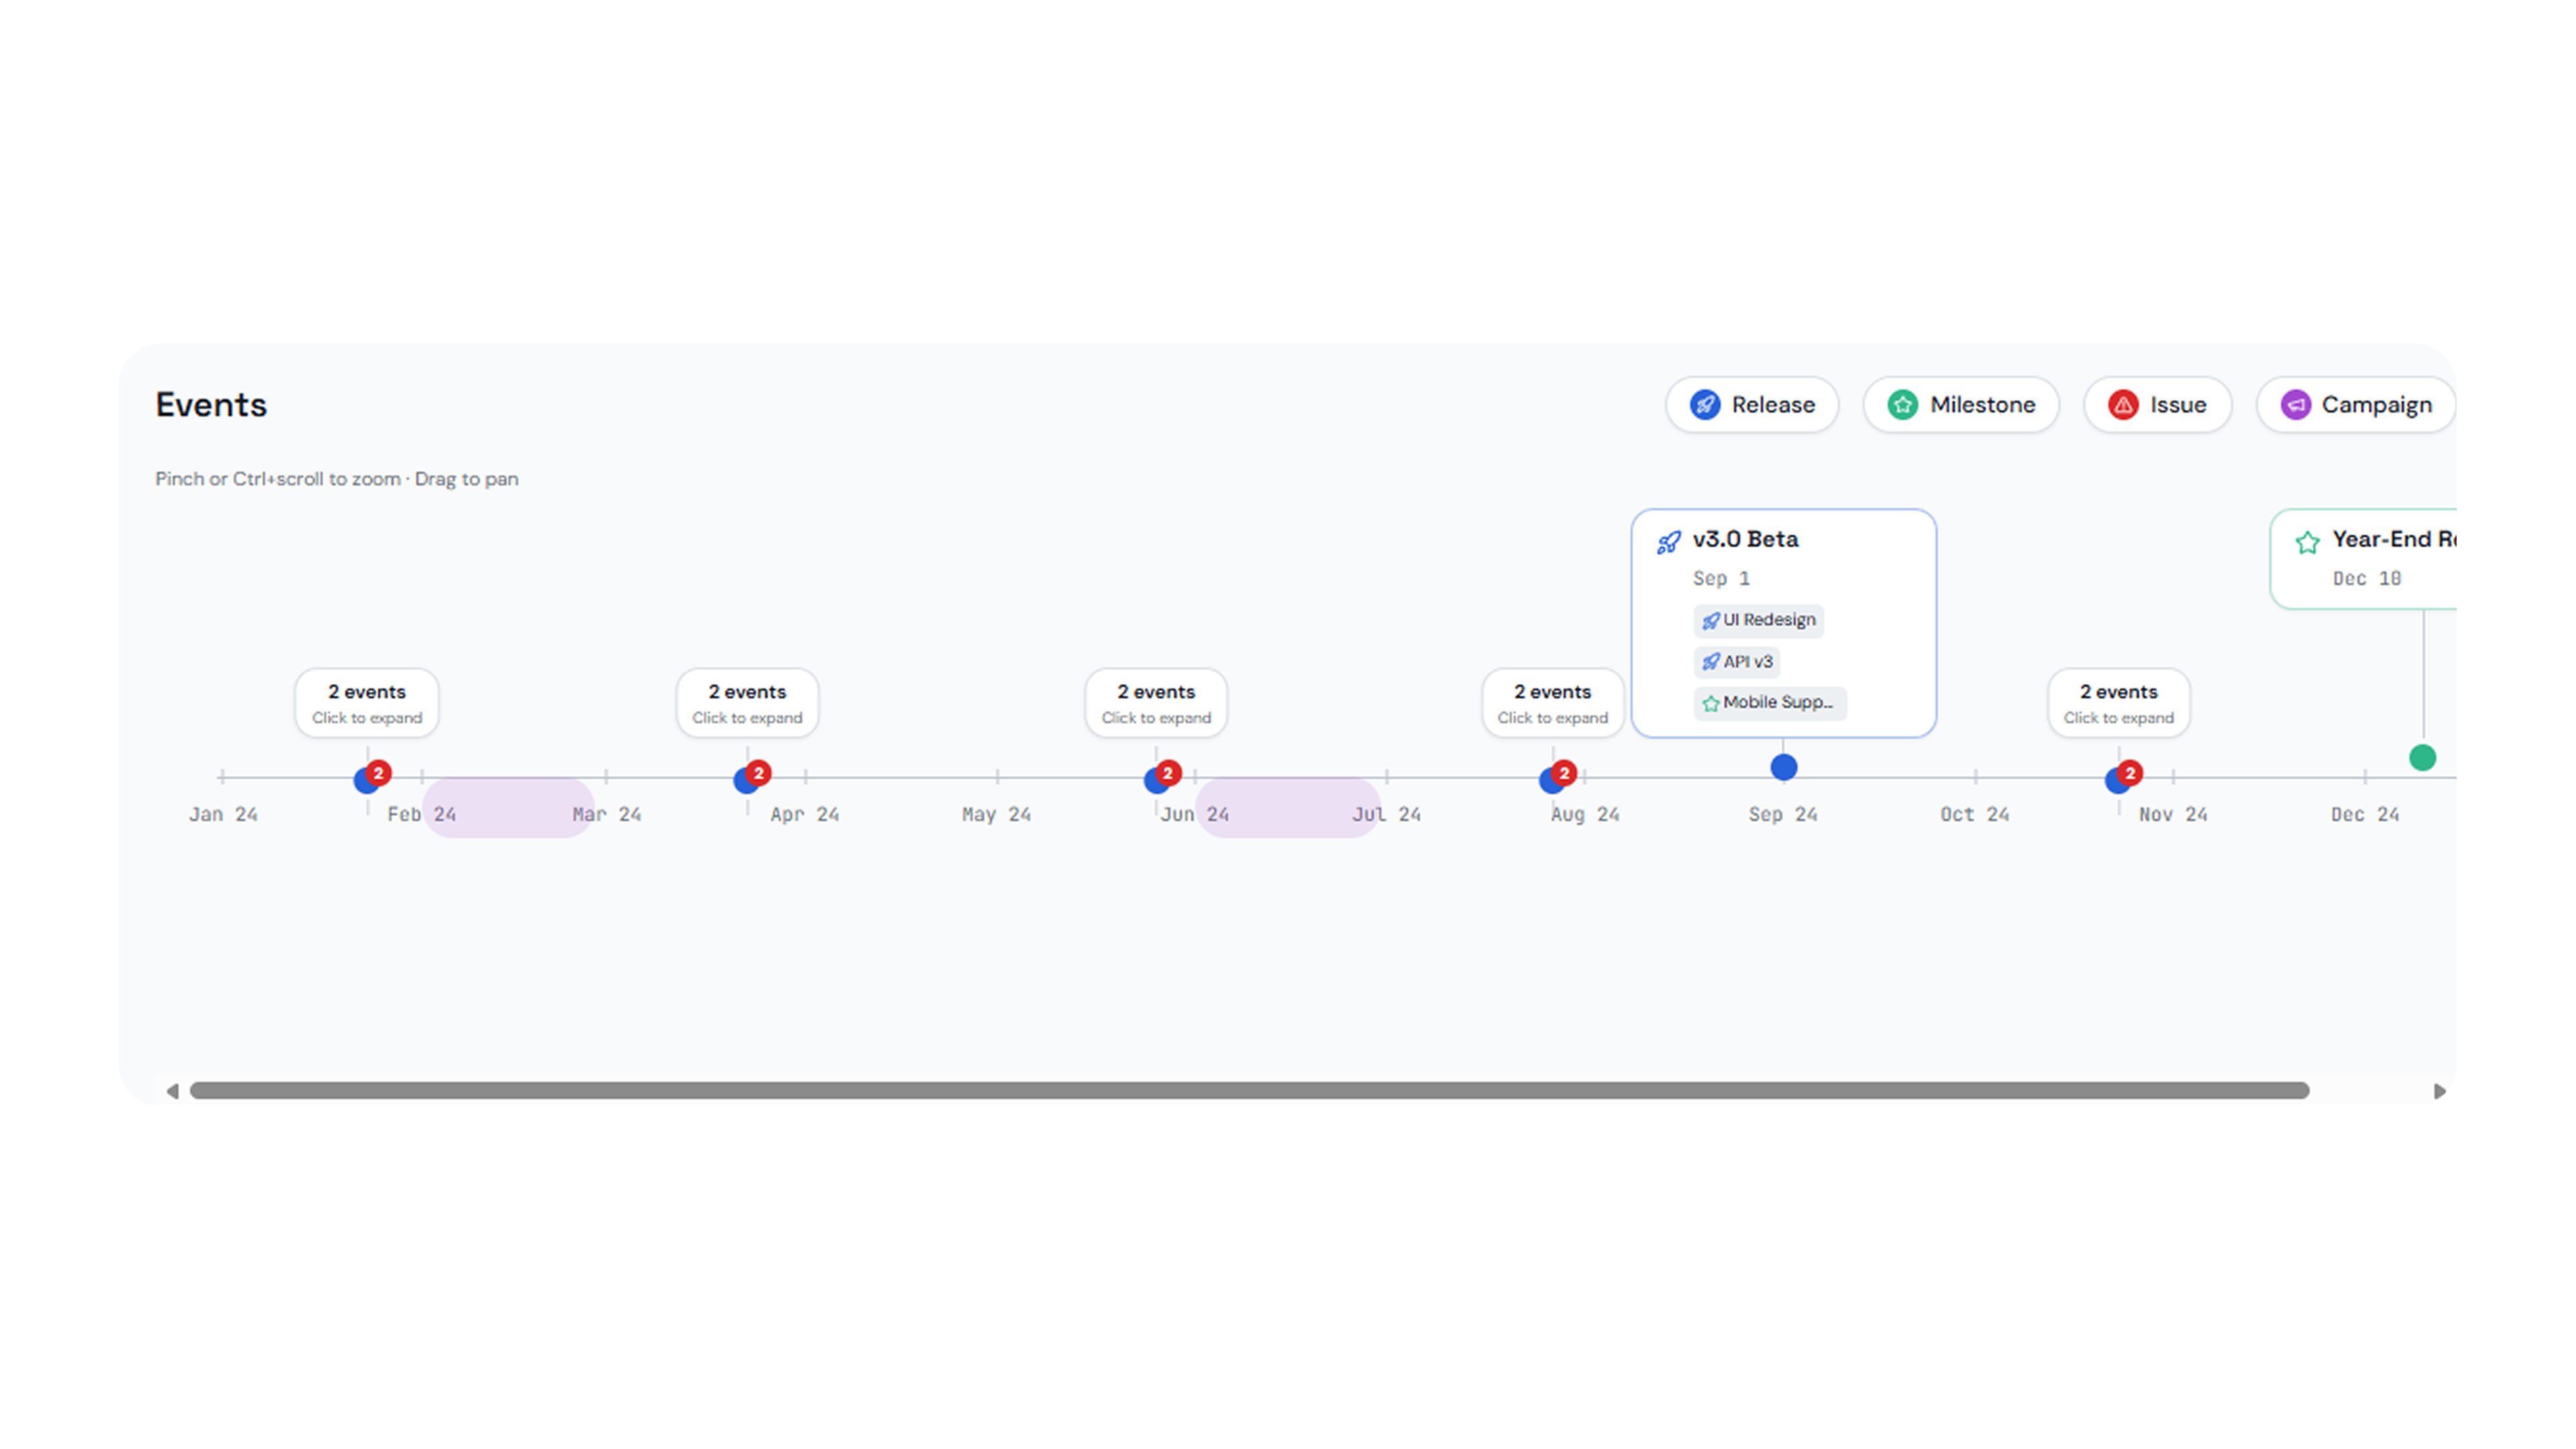
Event Timeline
Interactive, highly customizable Event Timeline for Power BI.
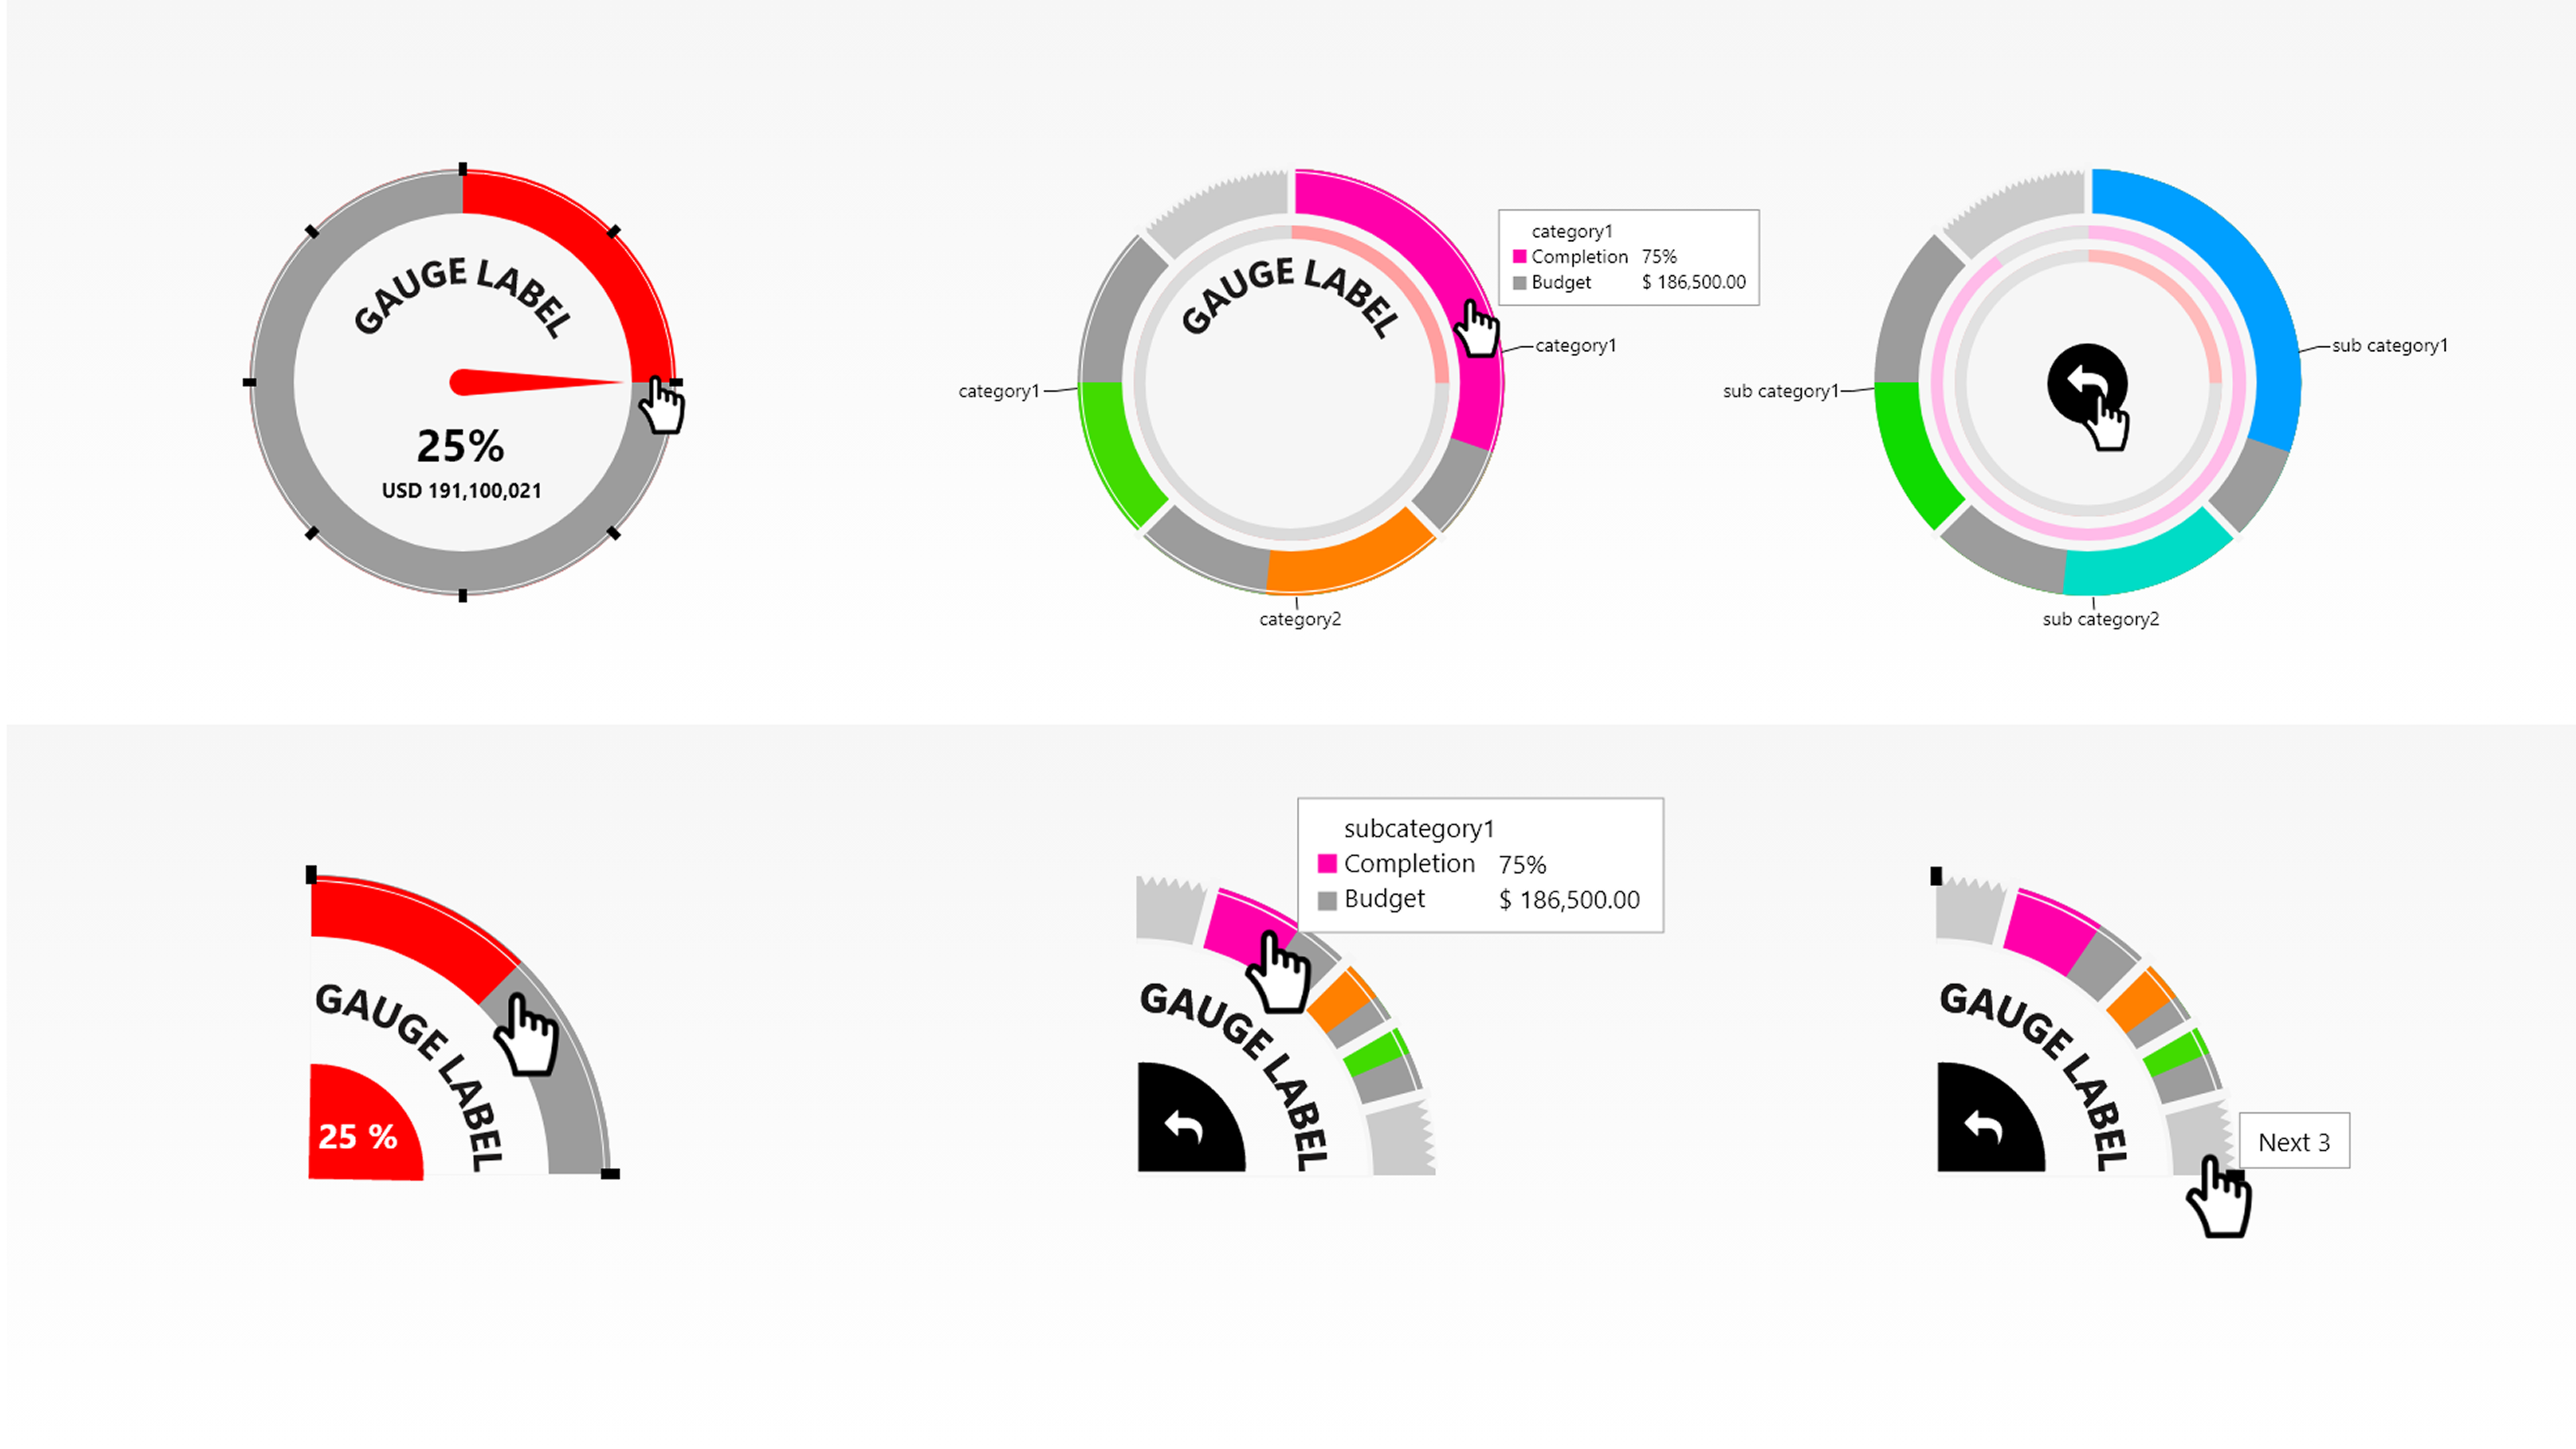
Gauge
A modern and customizable Gauge visual for Power BI.
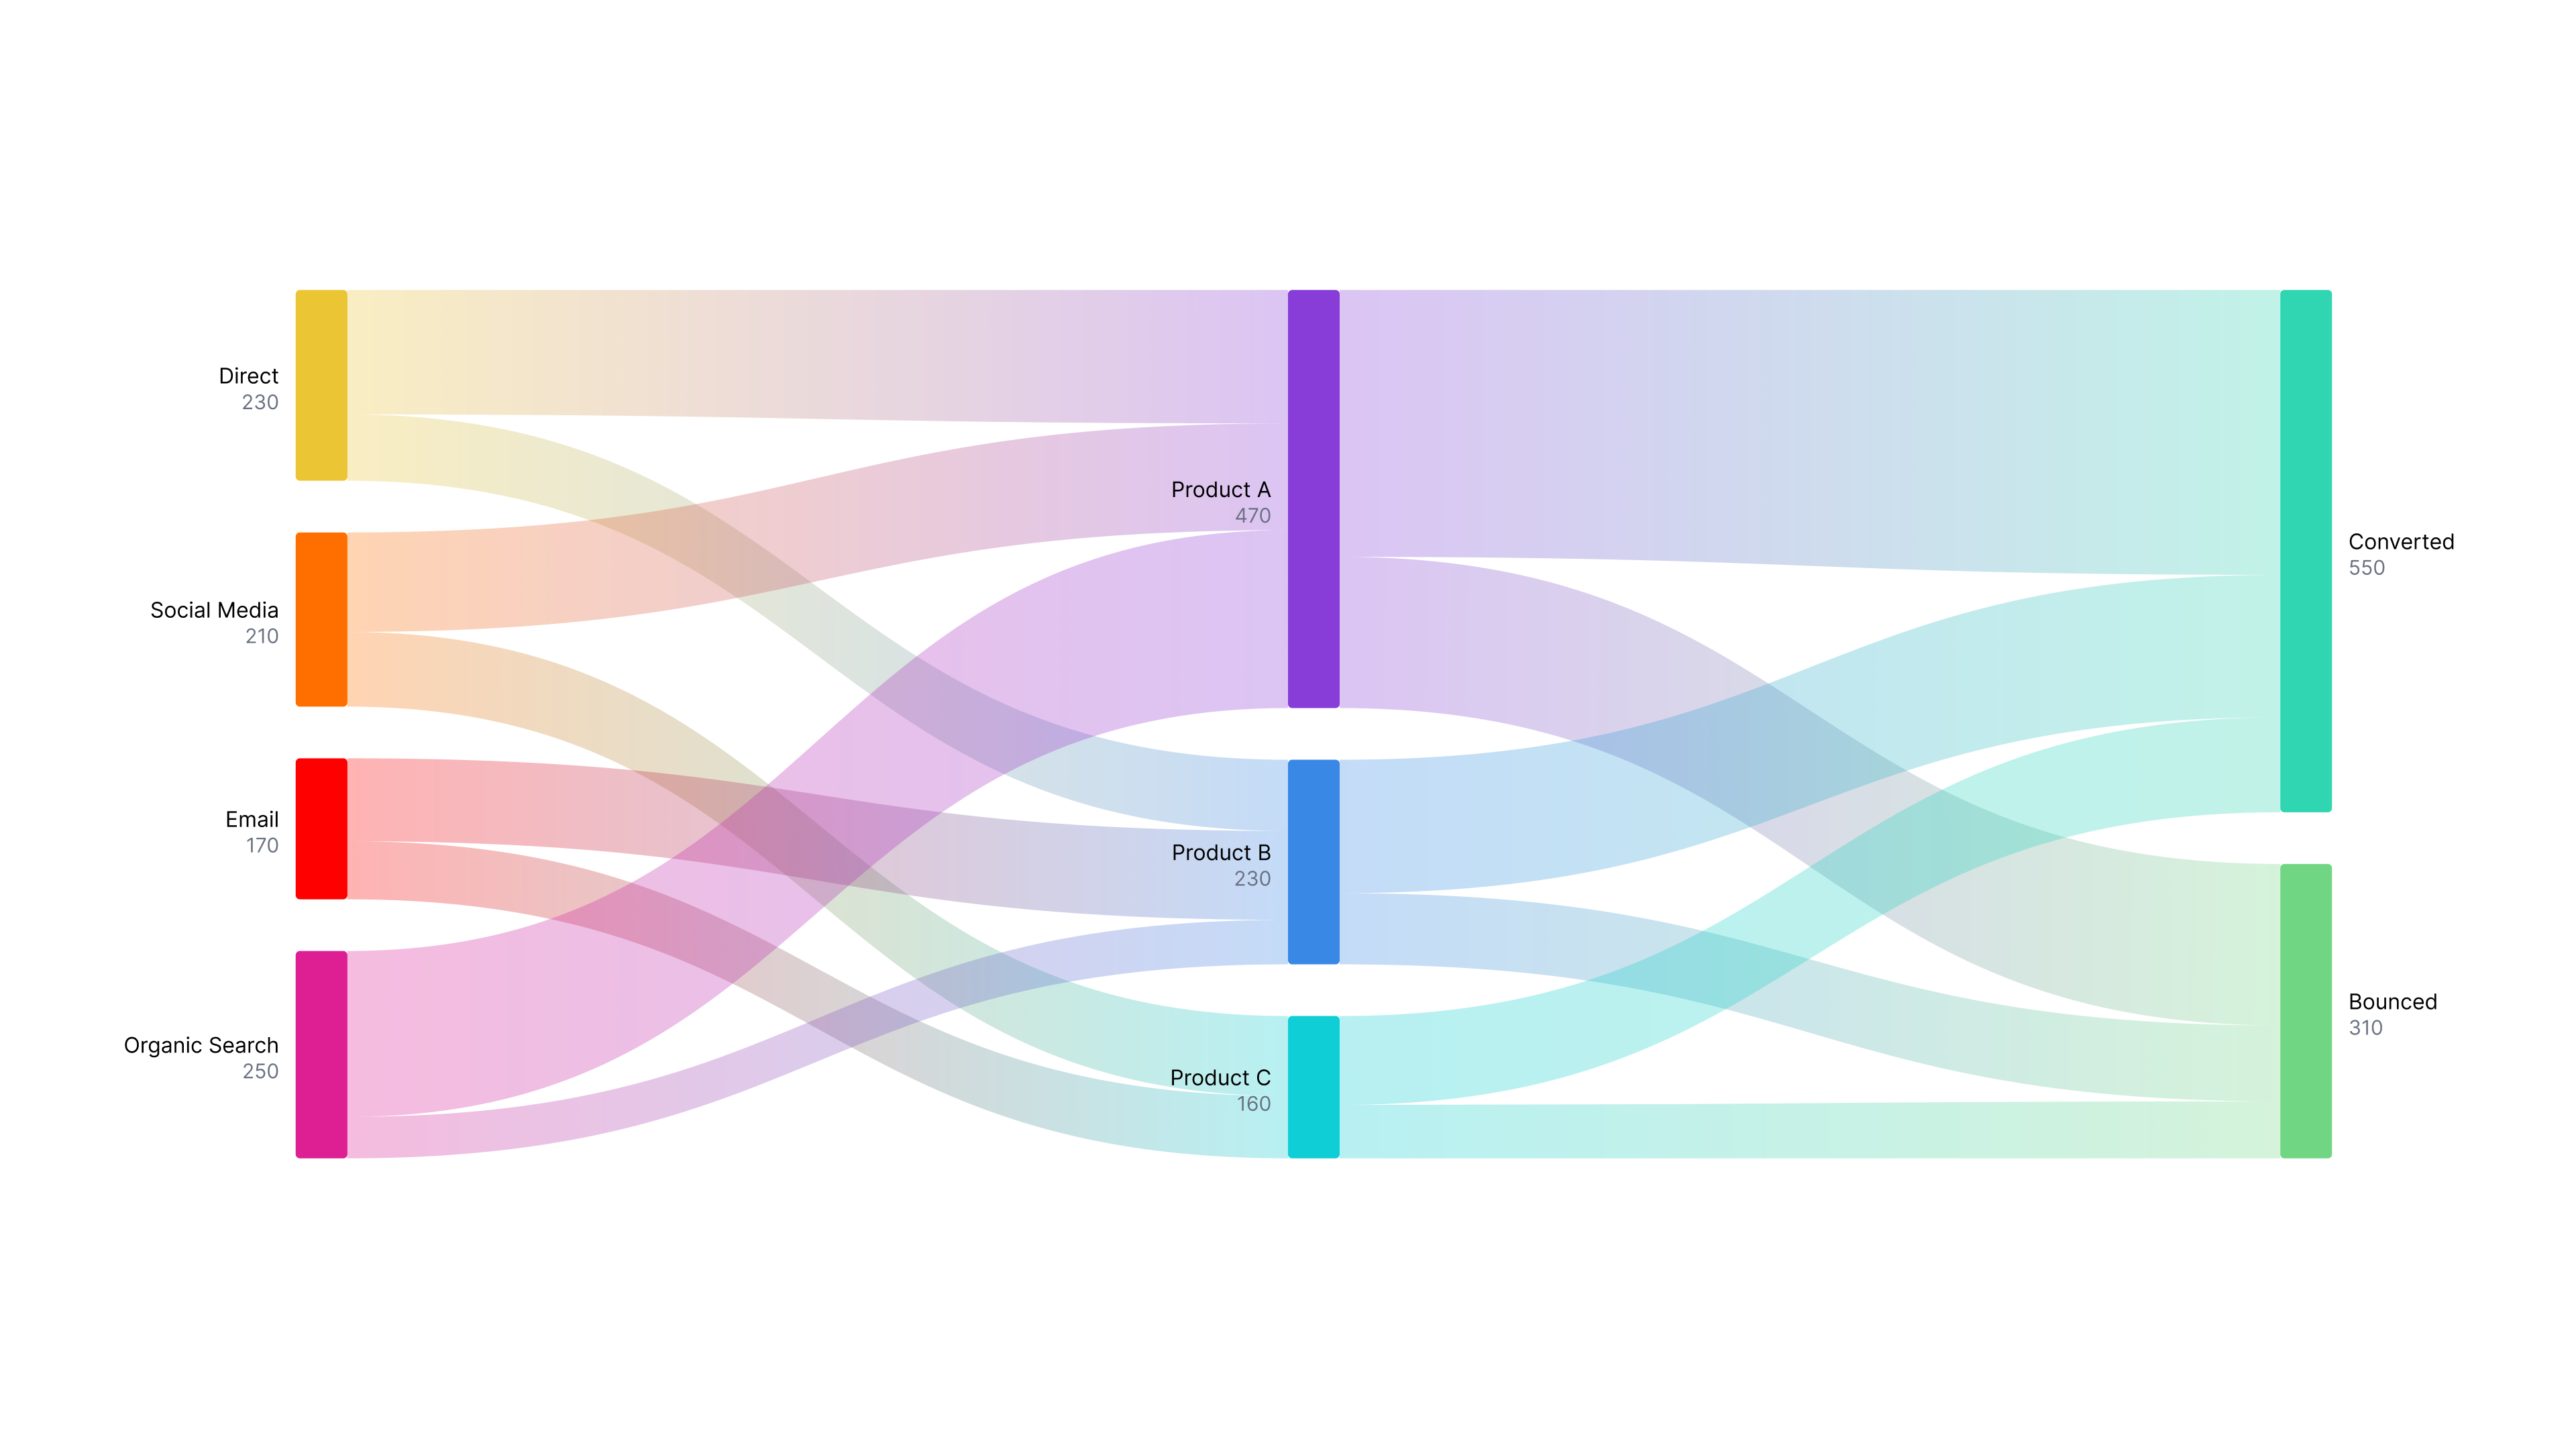
Sankey
Sankey with drill-down capabilities and enhanced interactivity.
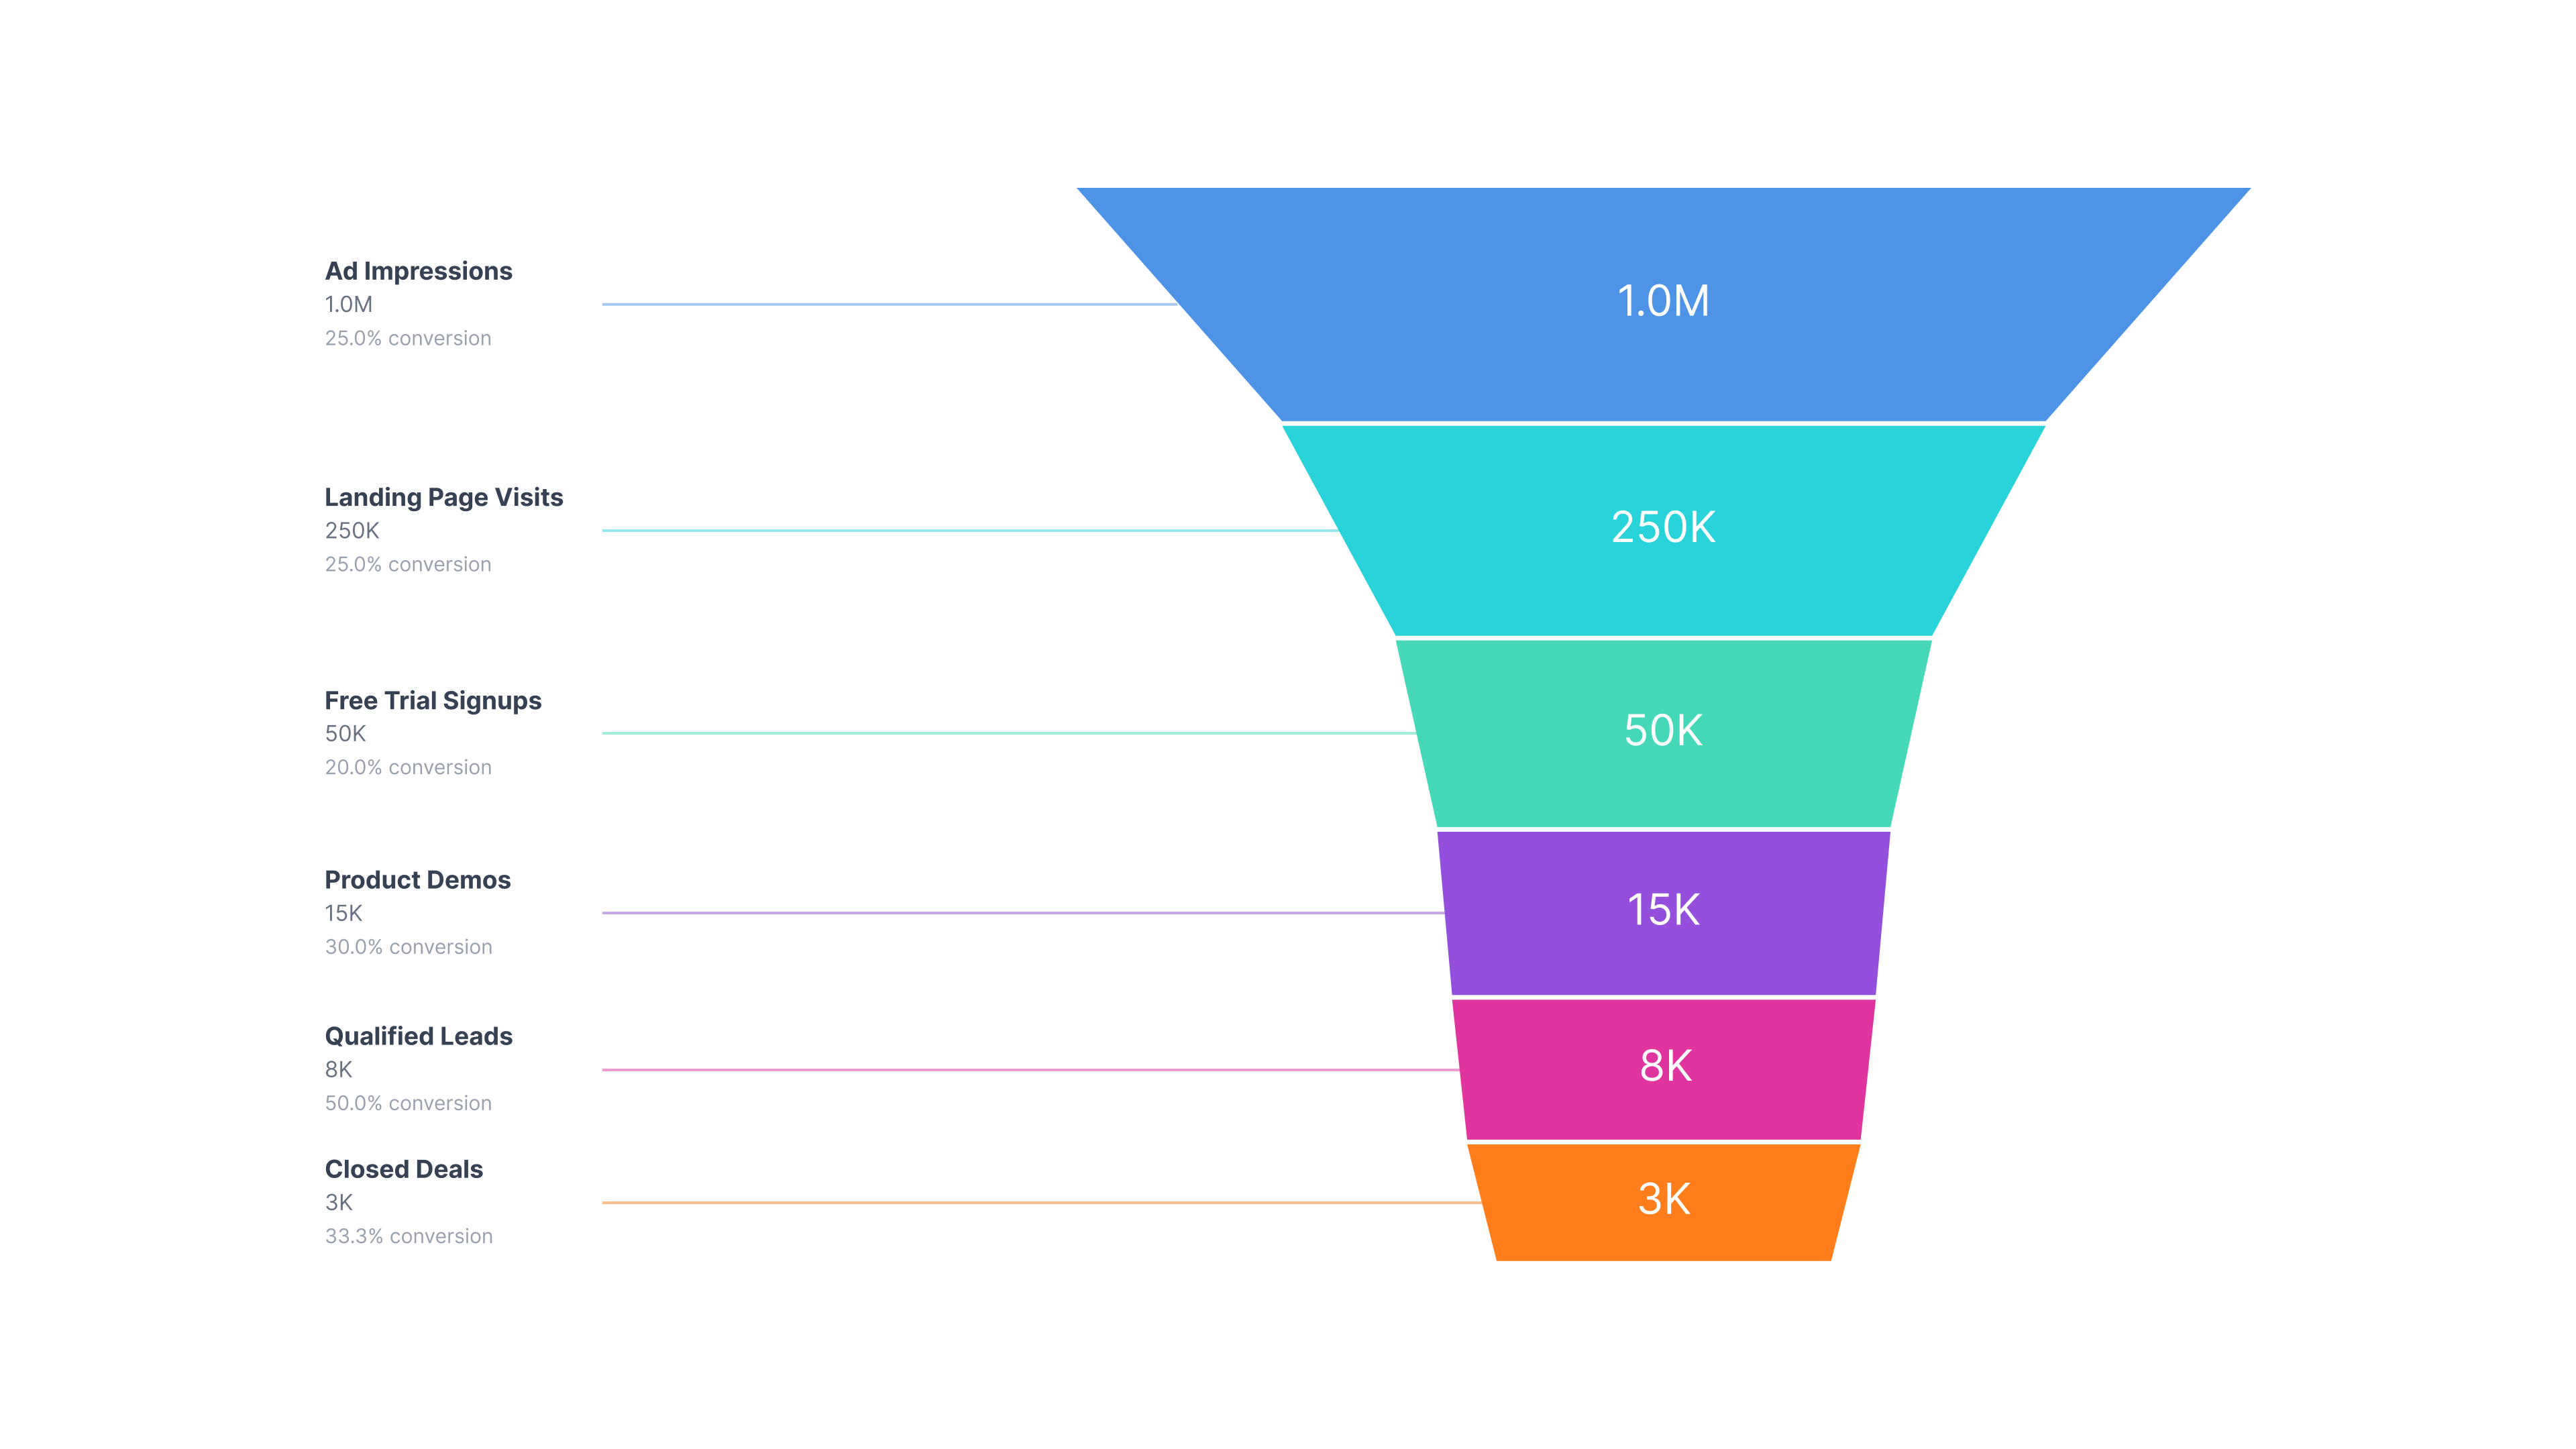
Sales Funnel
Interactive, highly customizable Sales Funnel for Power BI users.
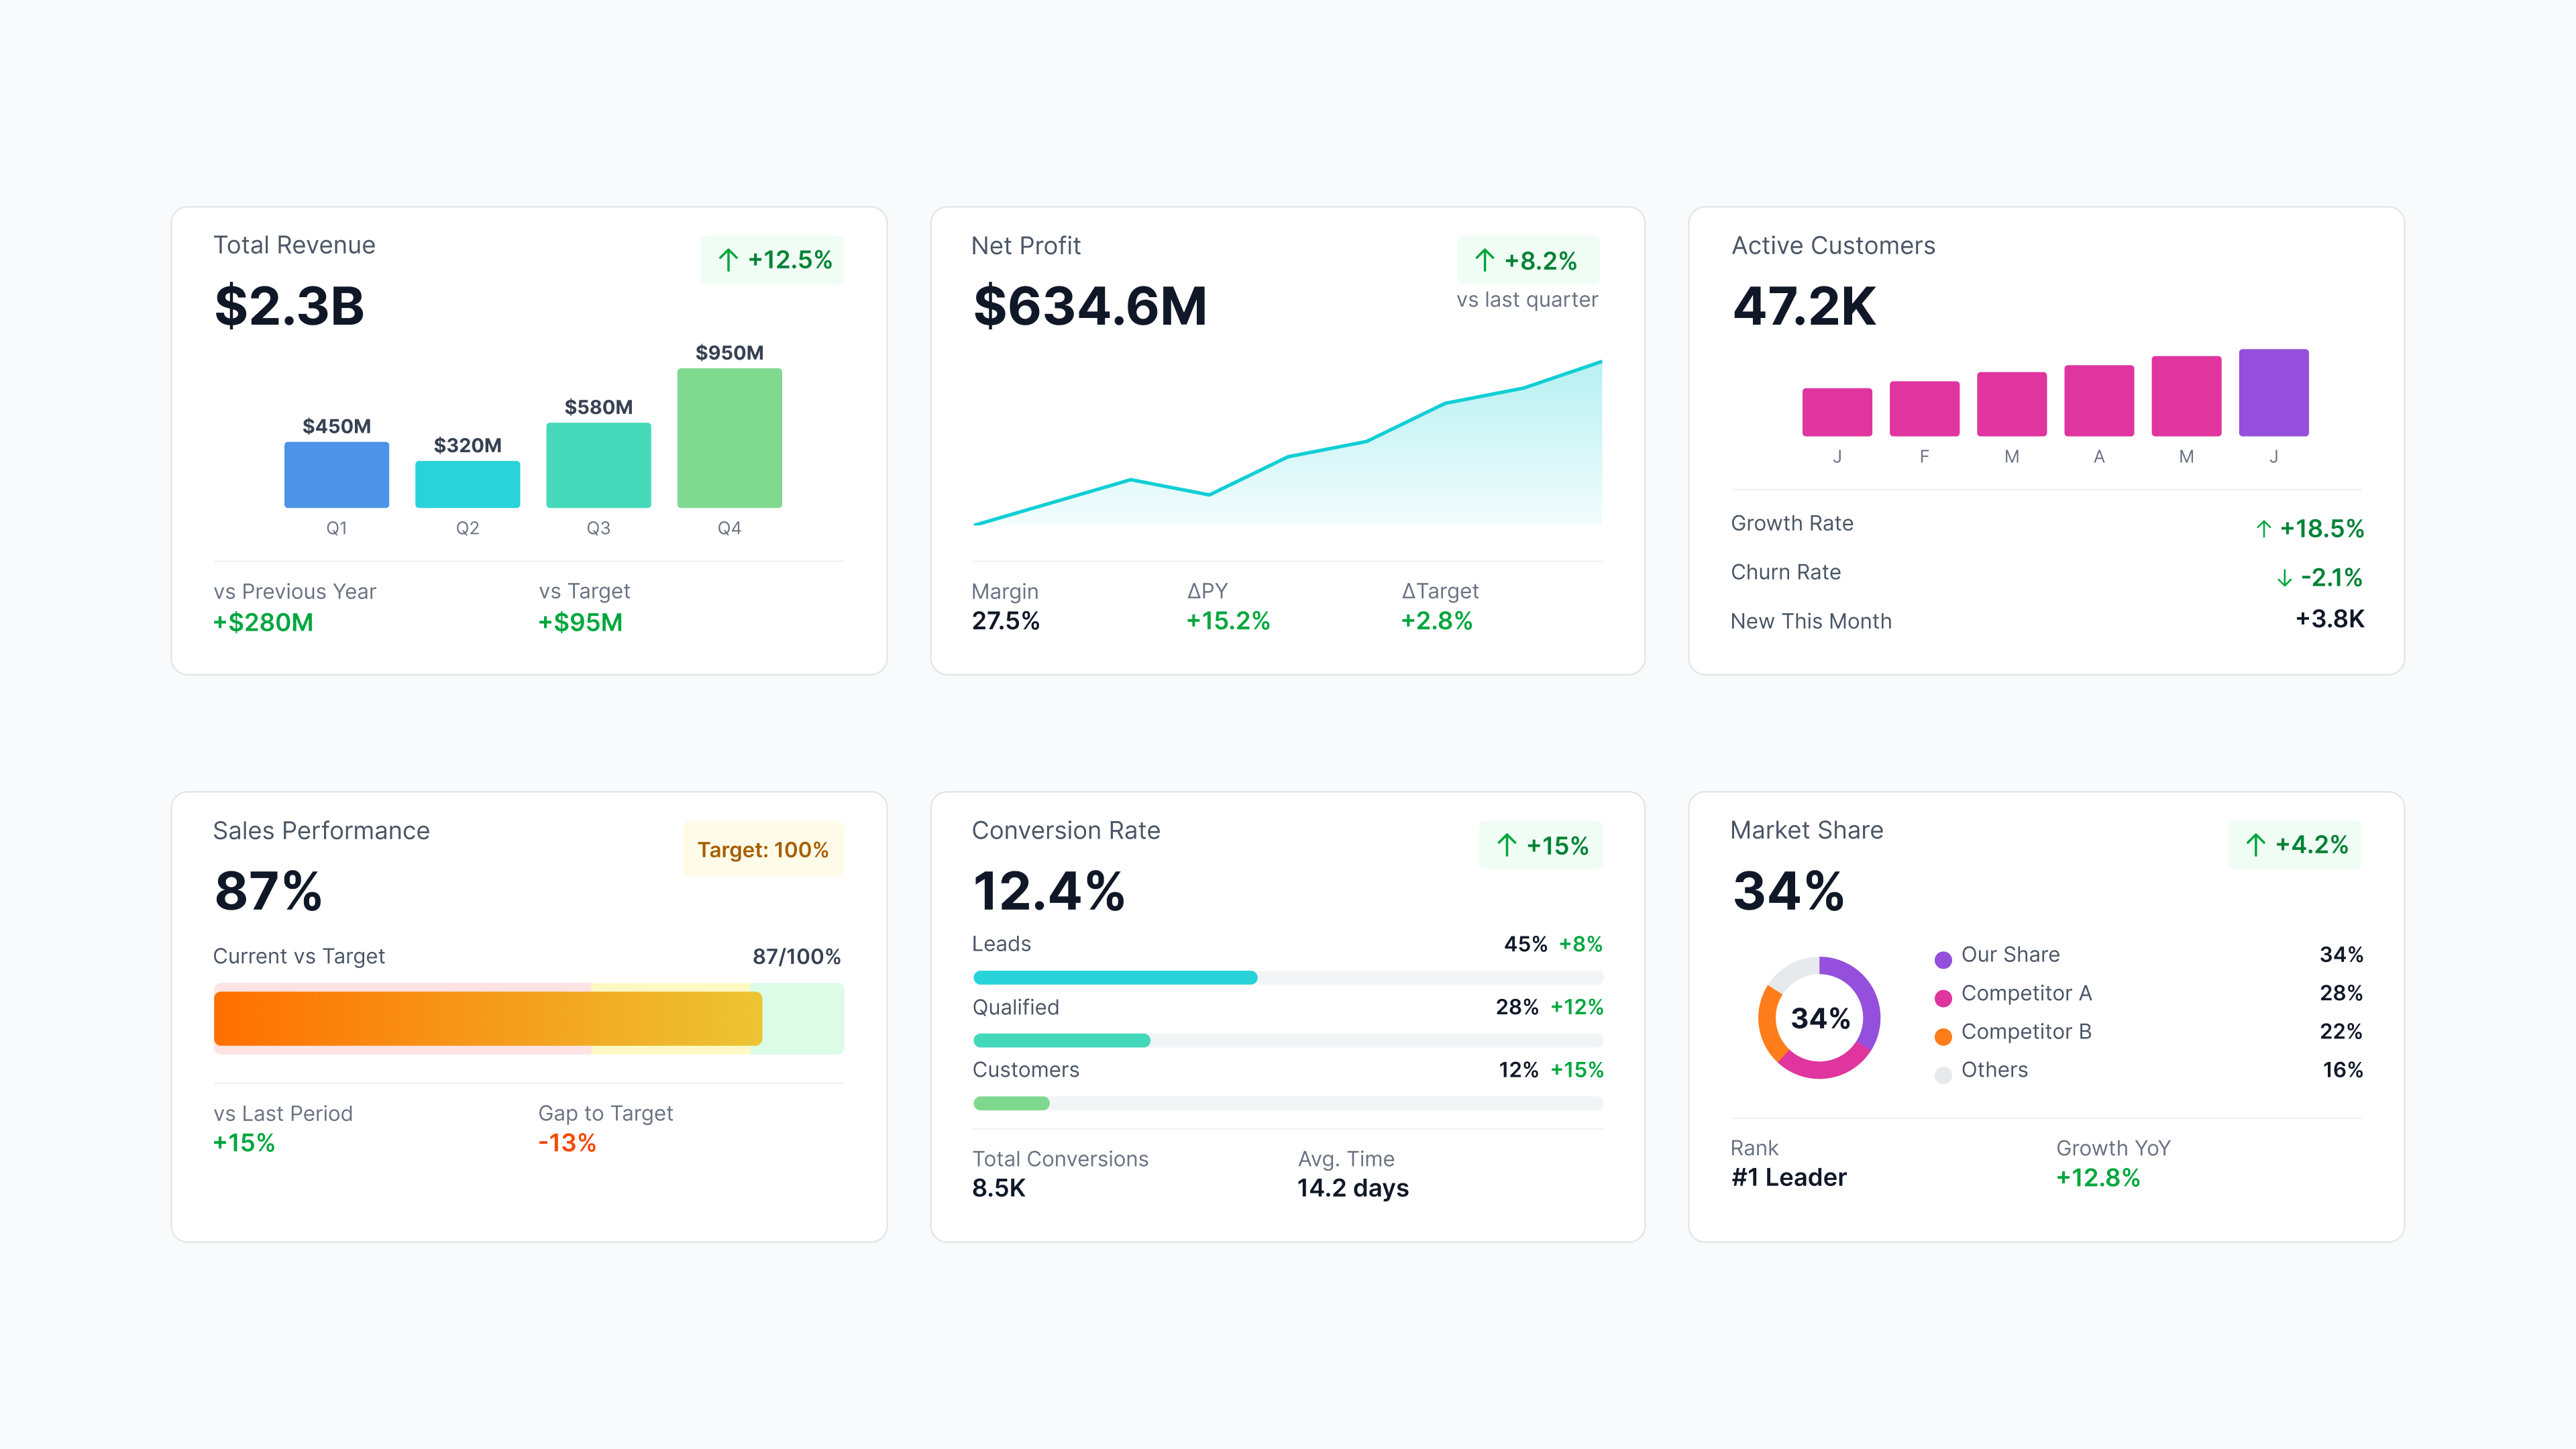
KPI Card
Interactive card with reference values, sparklines and change indicators.
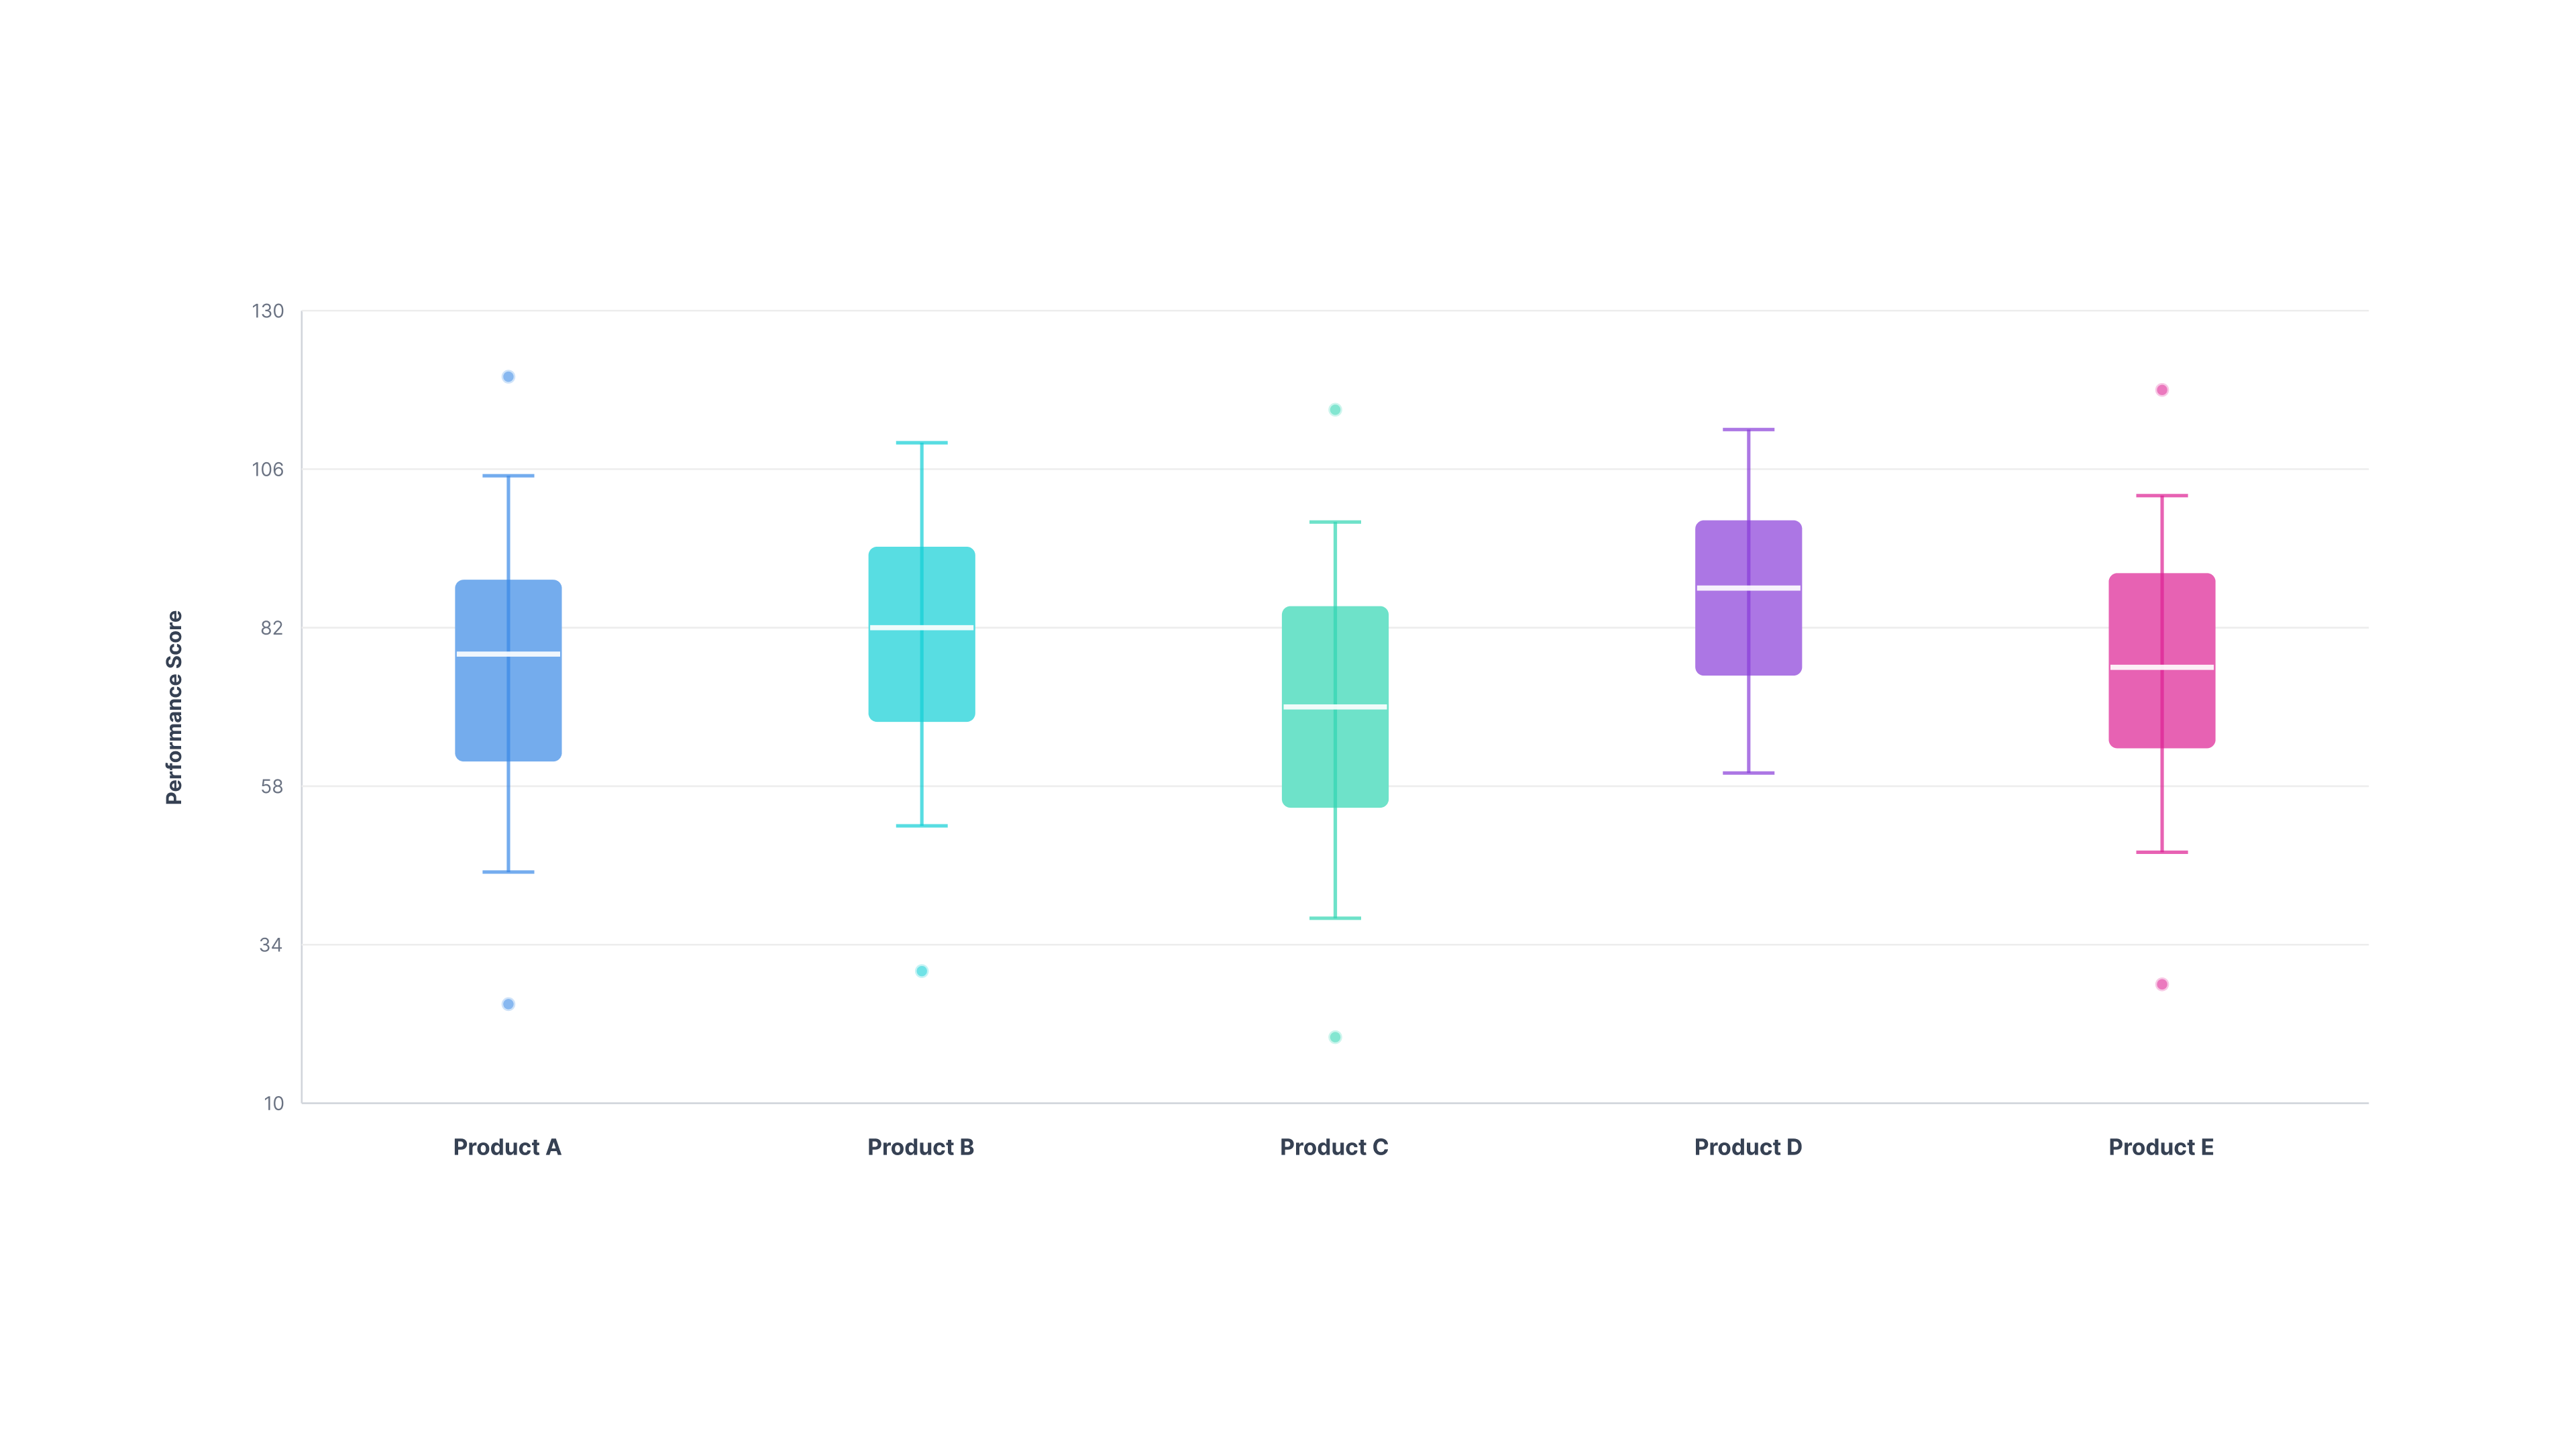
Box and Whiskers
Interactive, highly customizable Box and Whiskers chart.
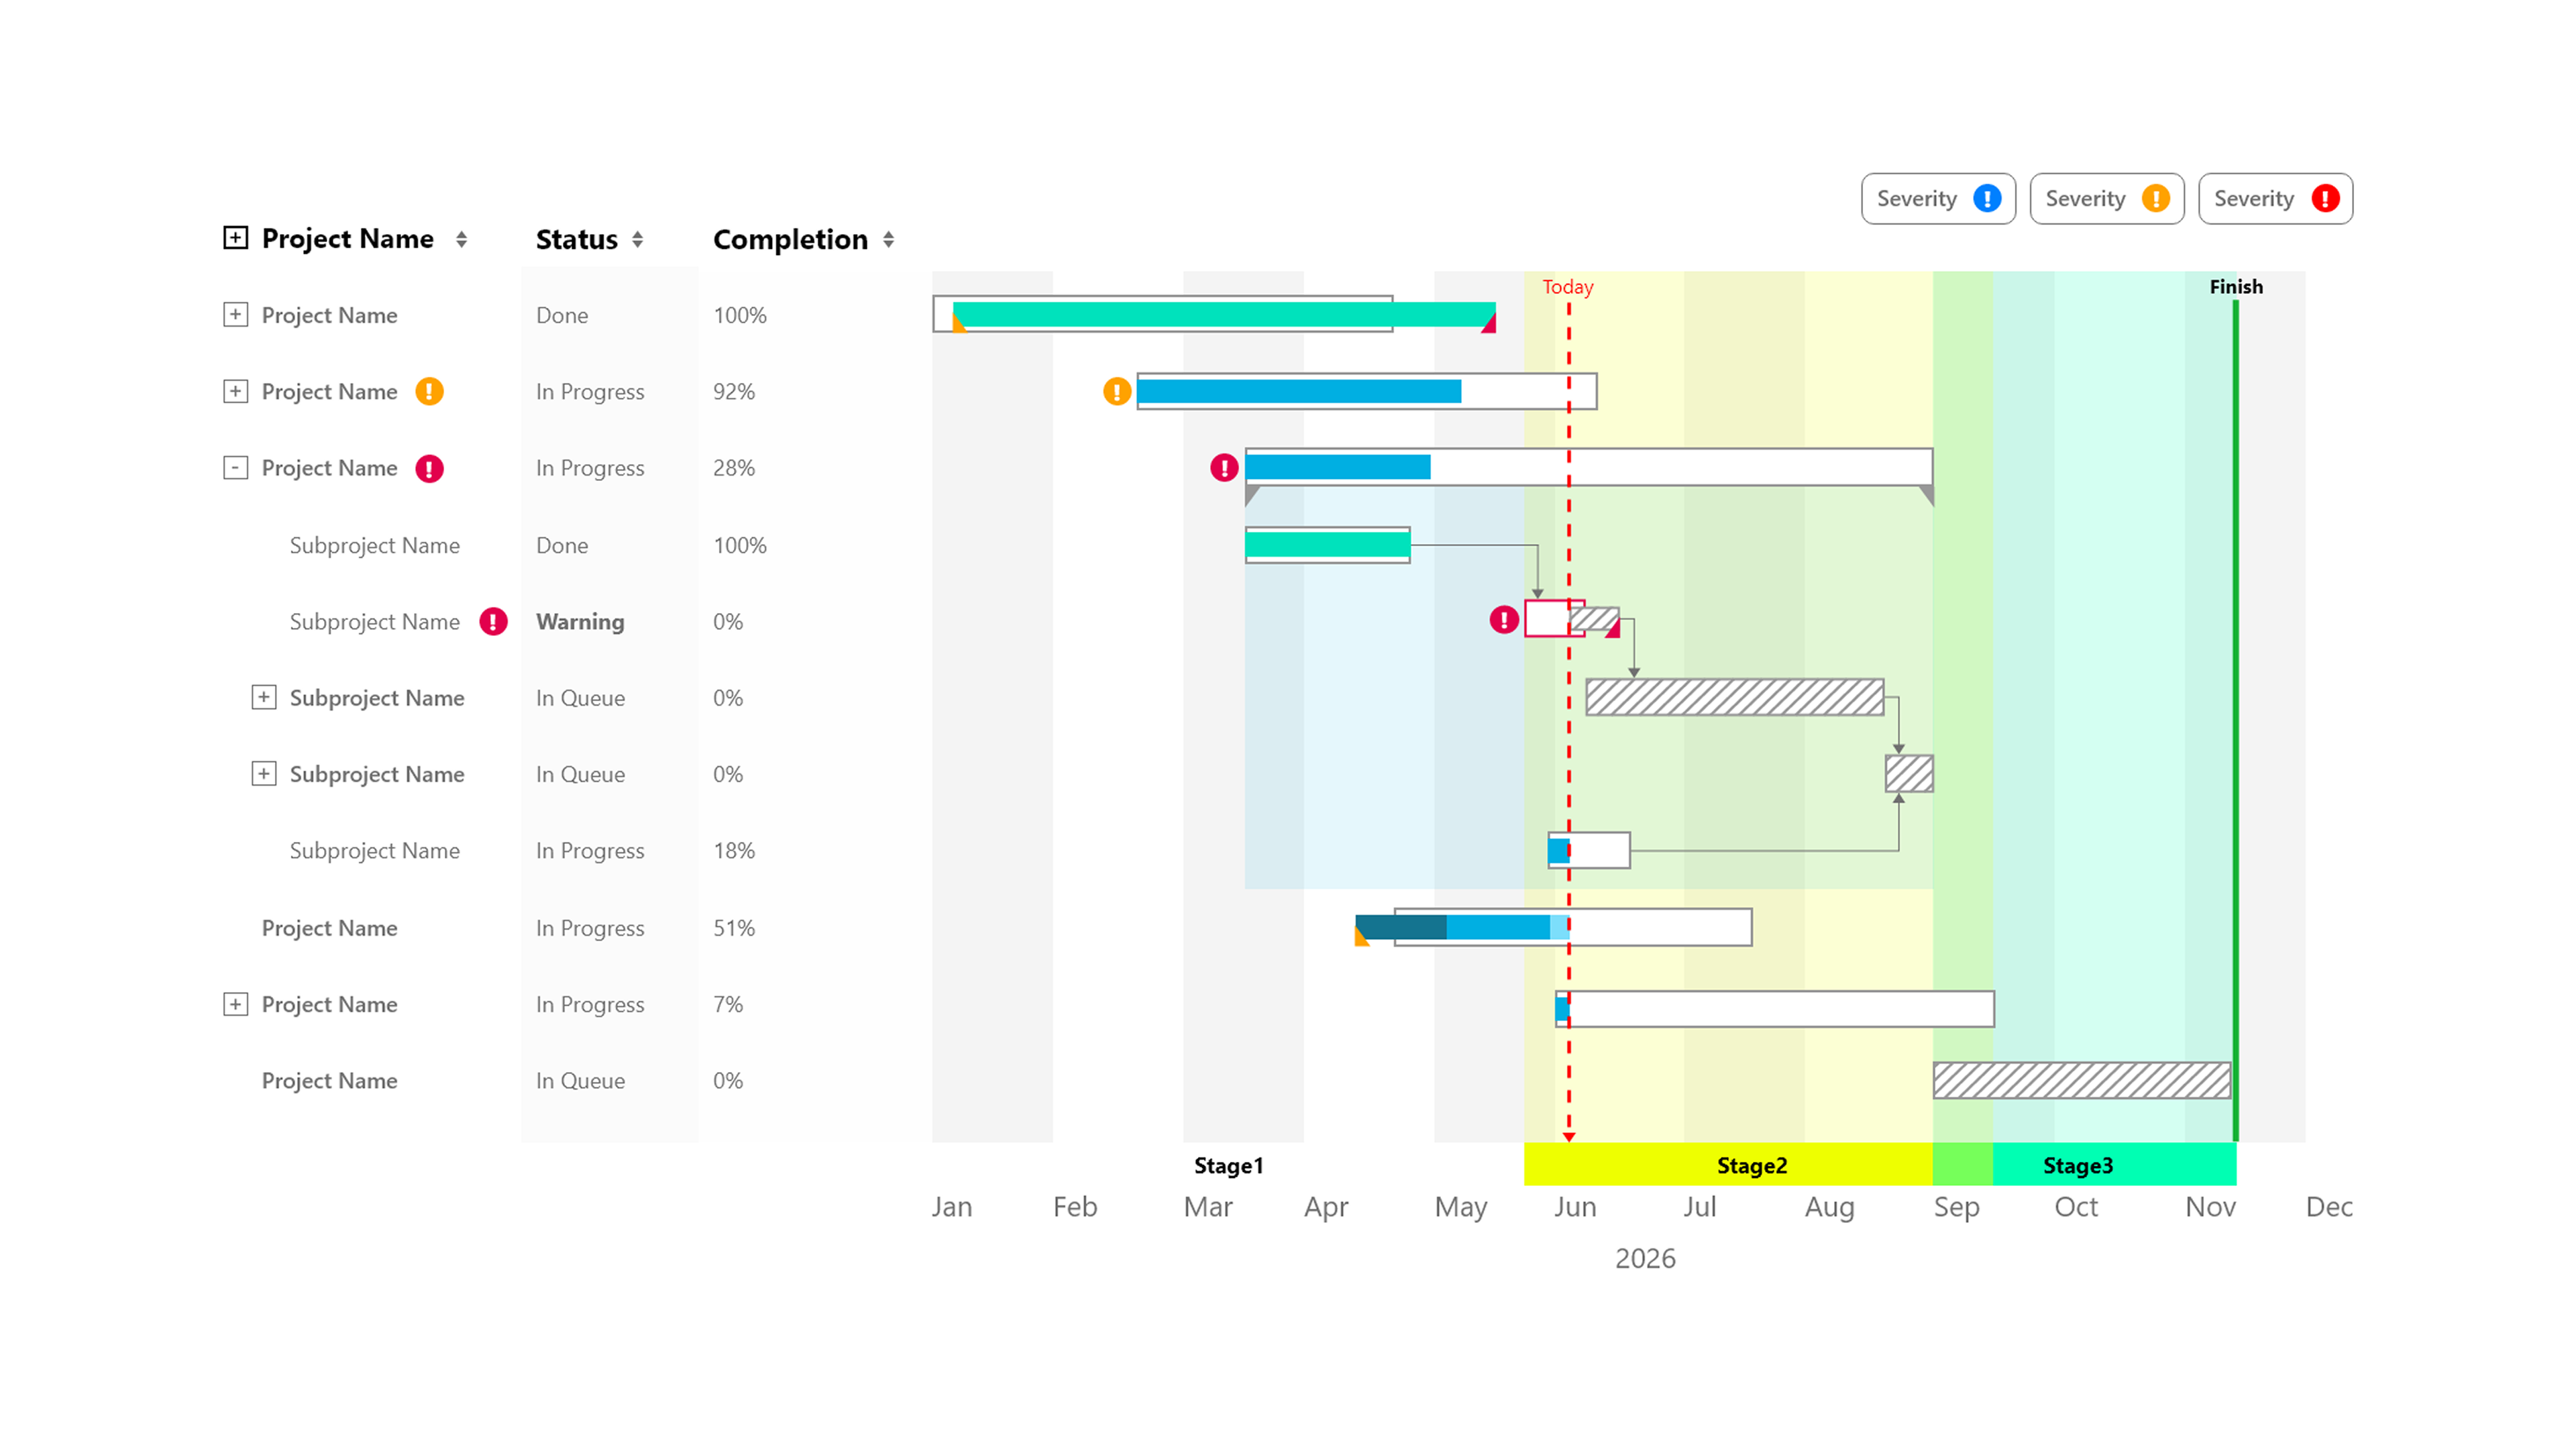
Gantt
Advanced and scalable Gantt chart.
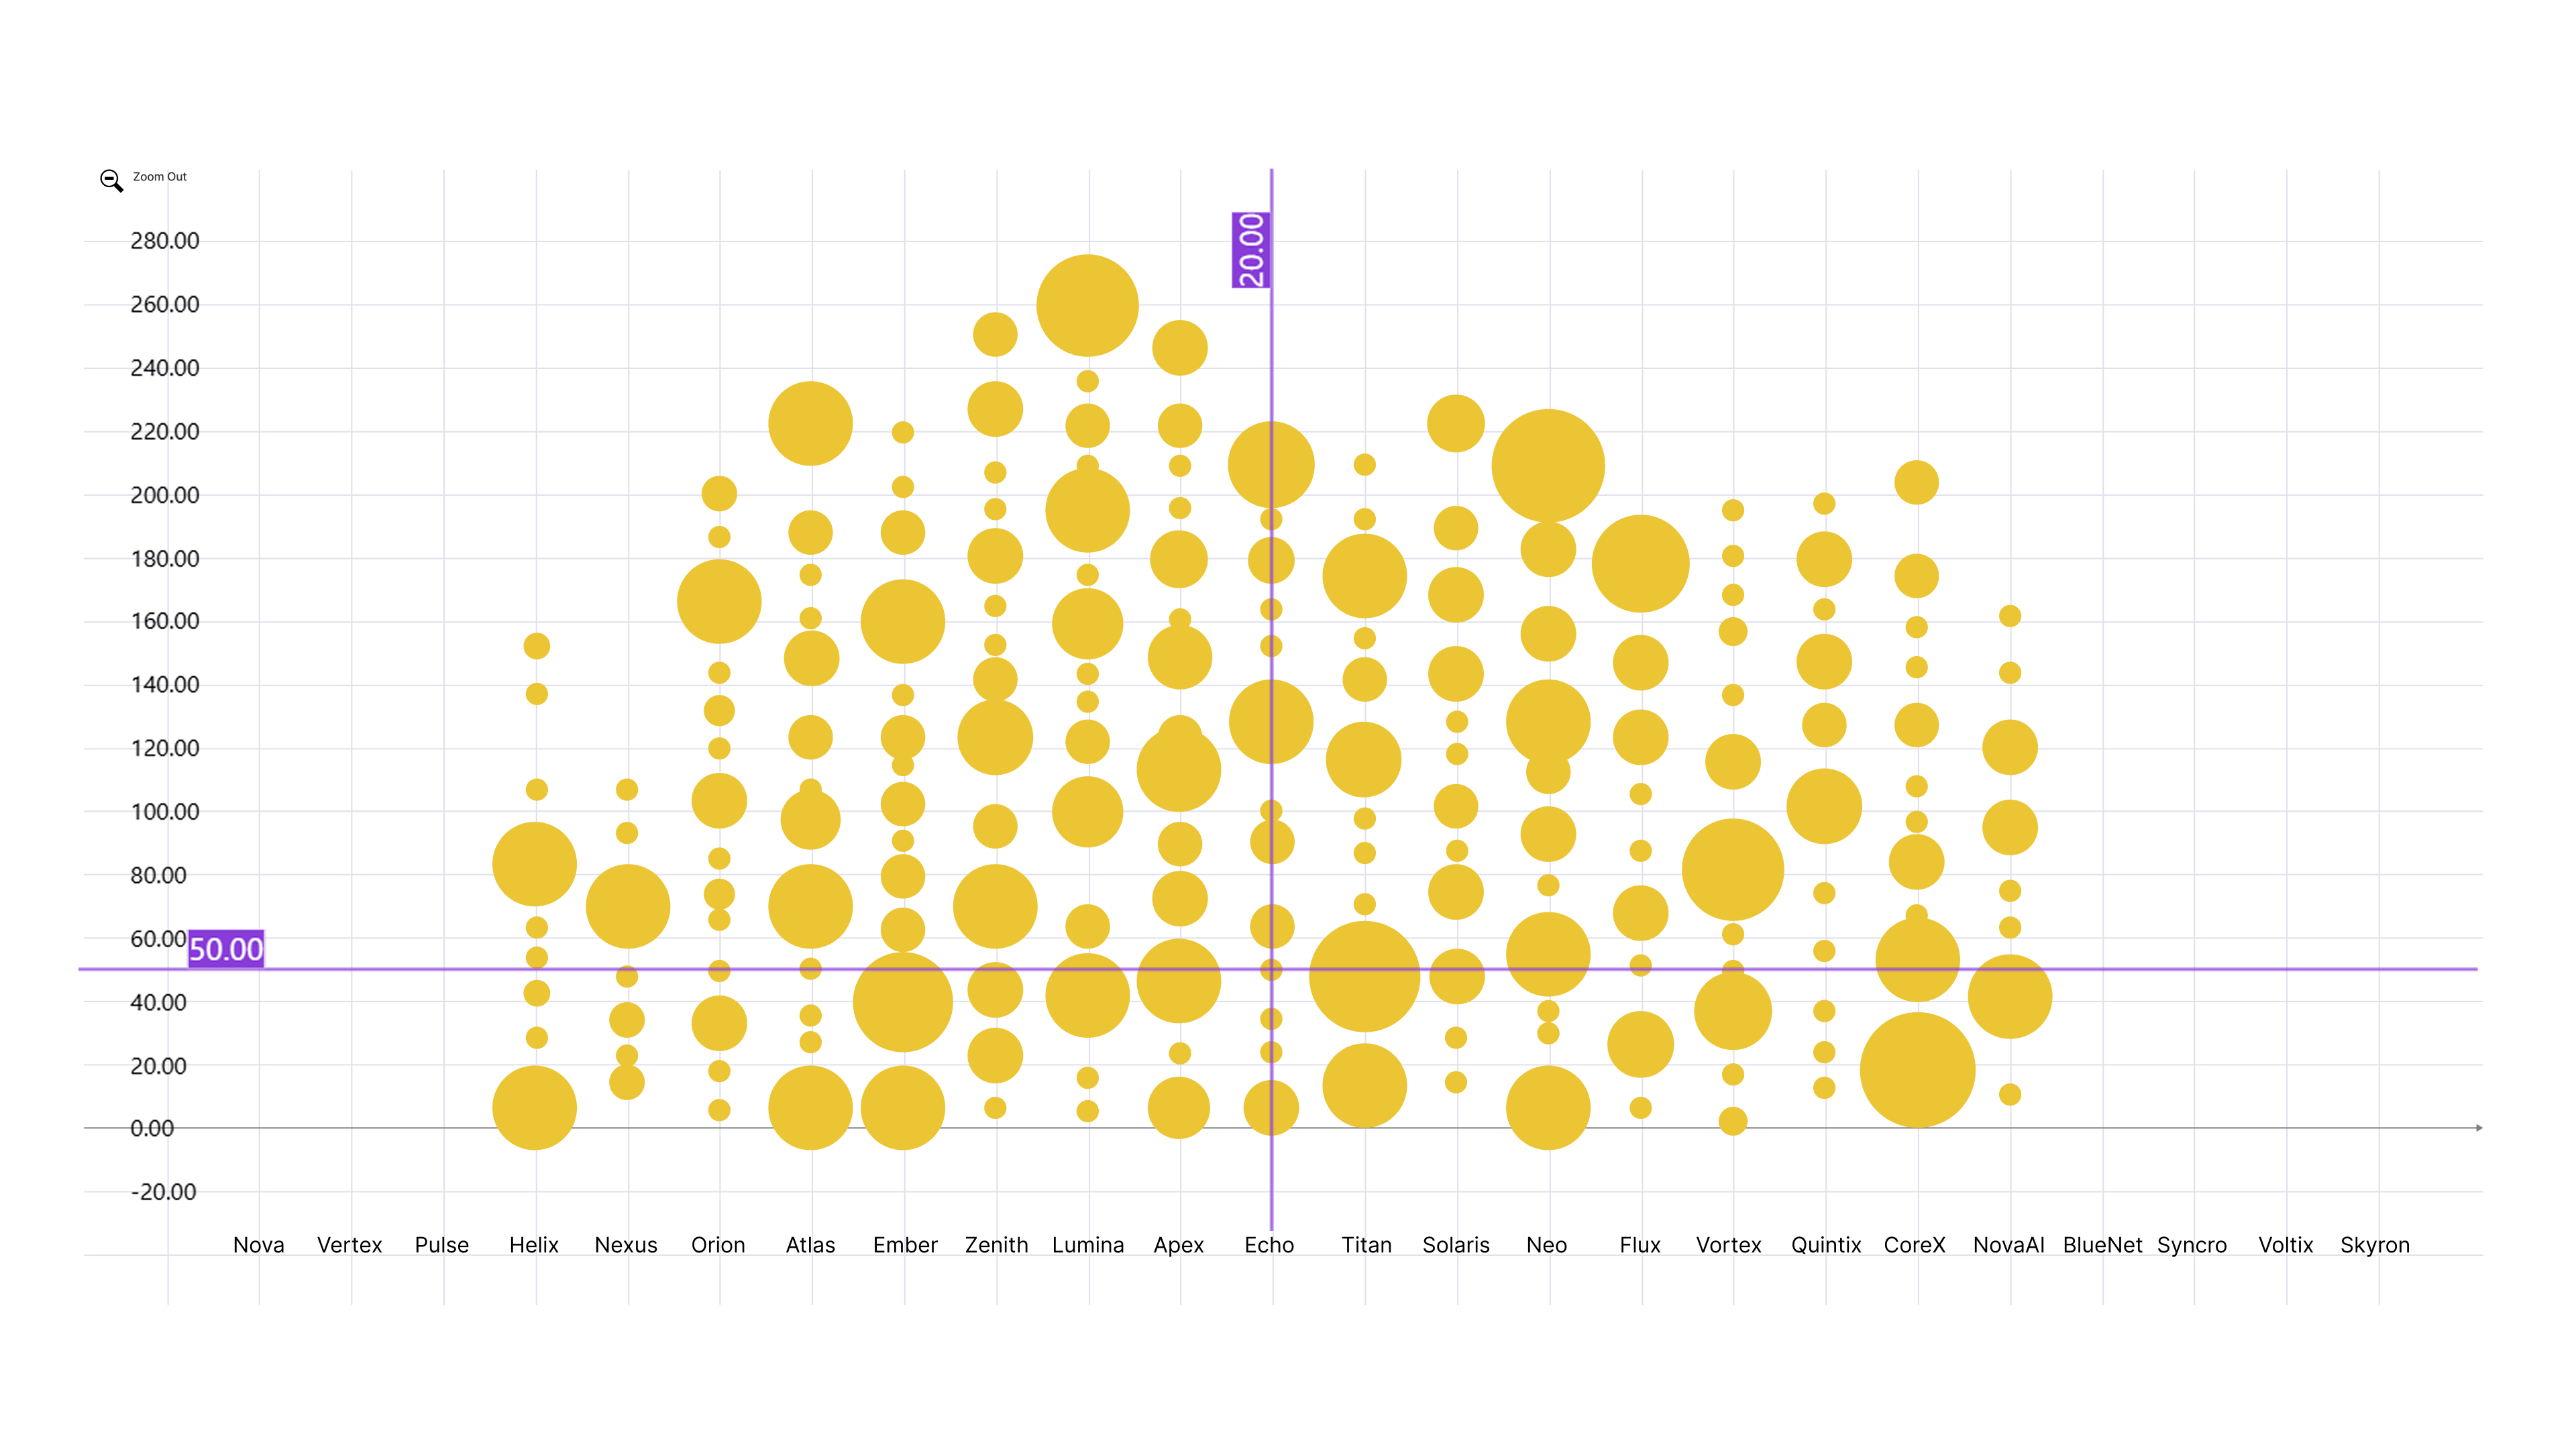
Categorical Bubble
Advanced interactive Categorical Bubble chart.
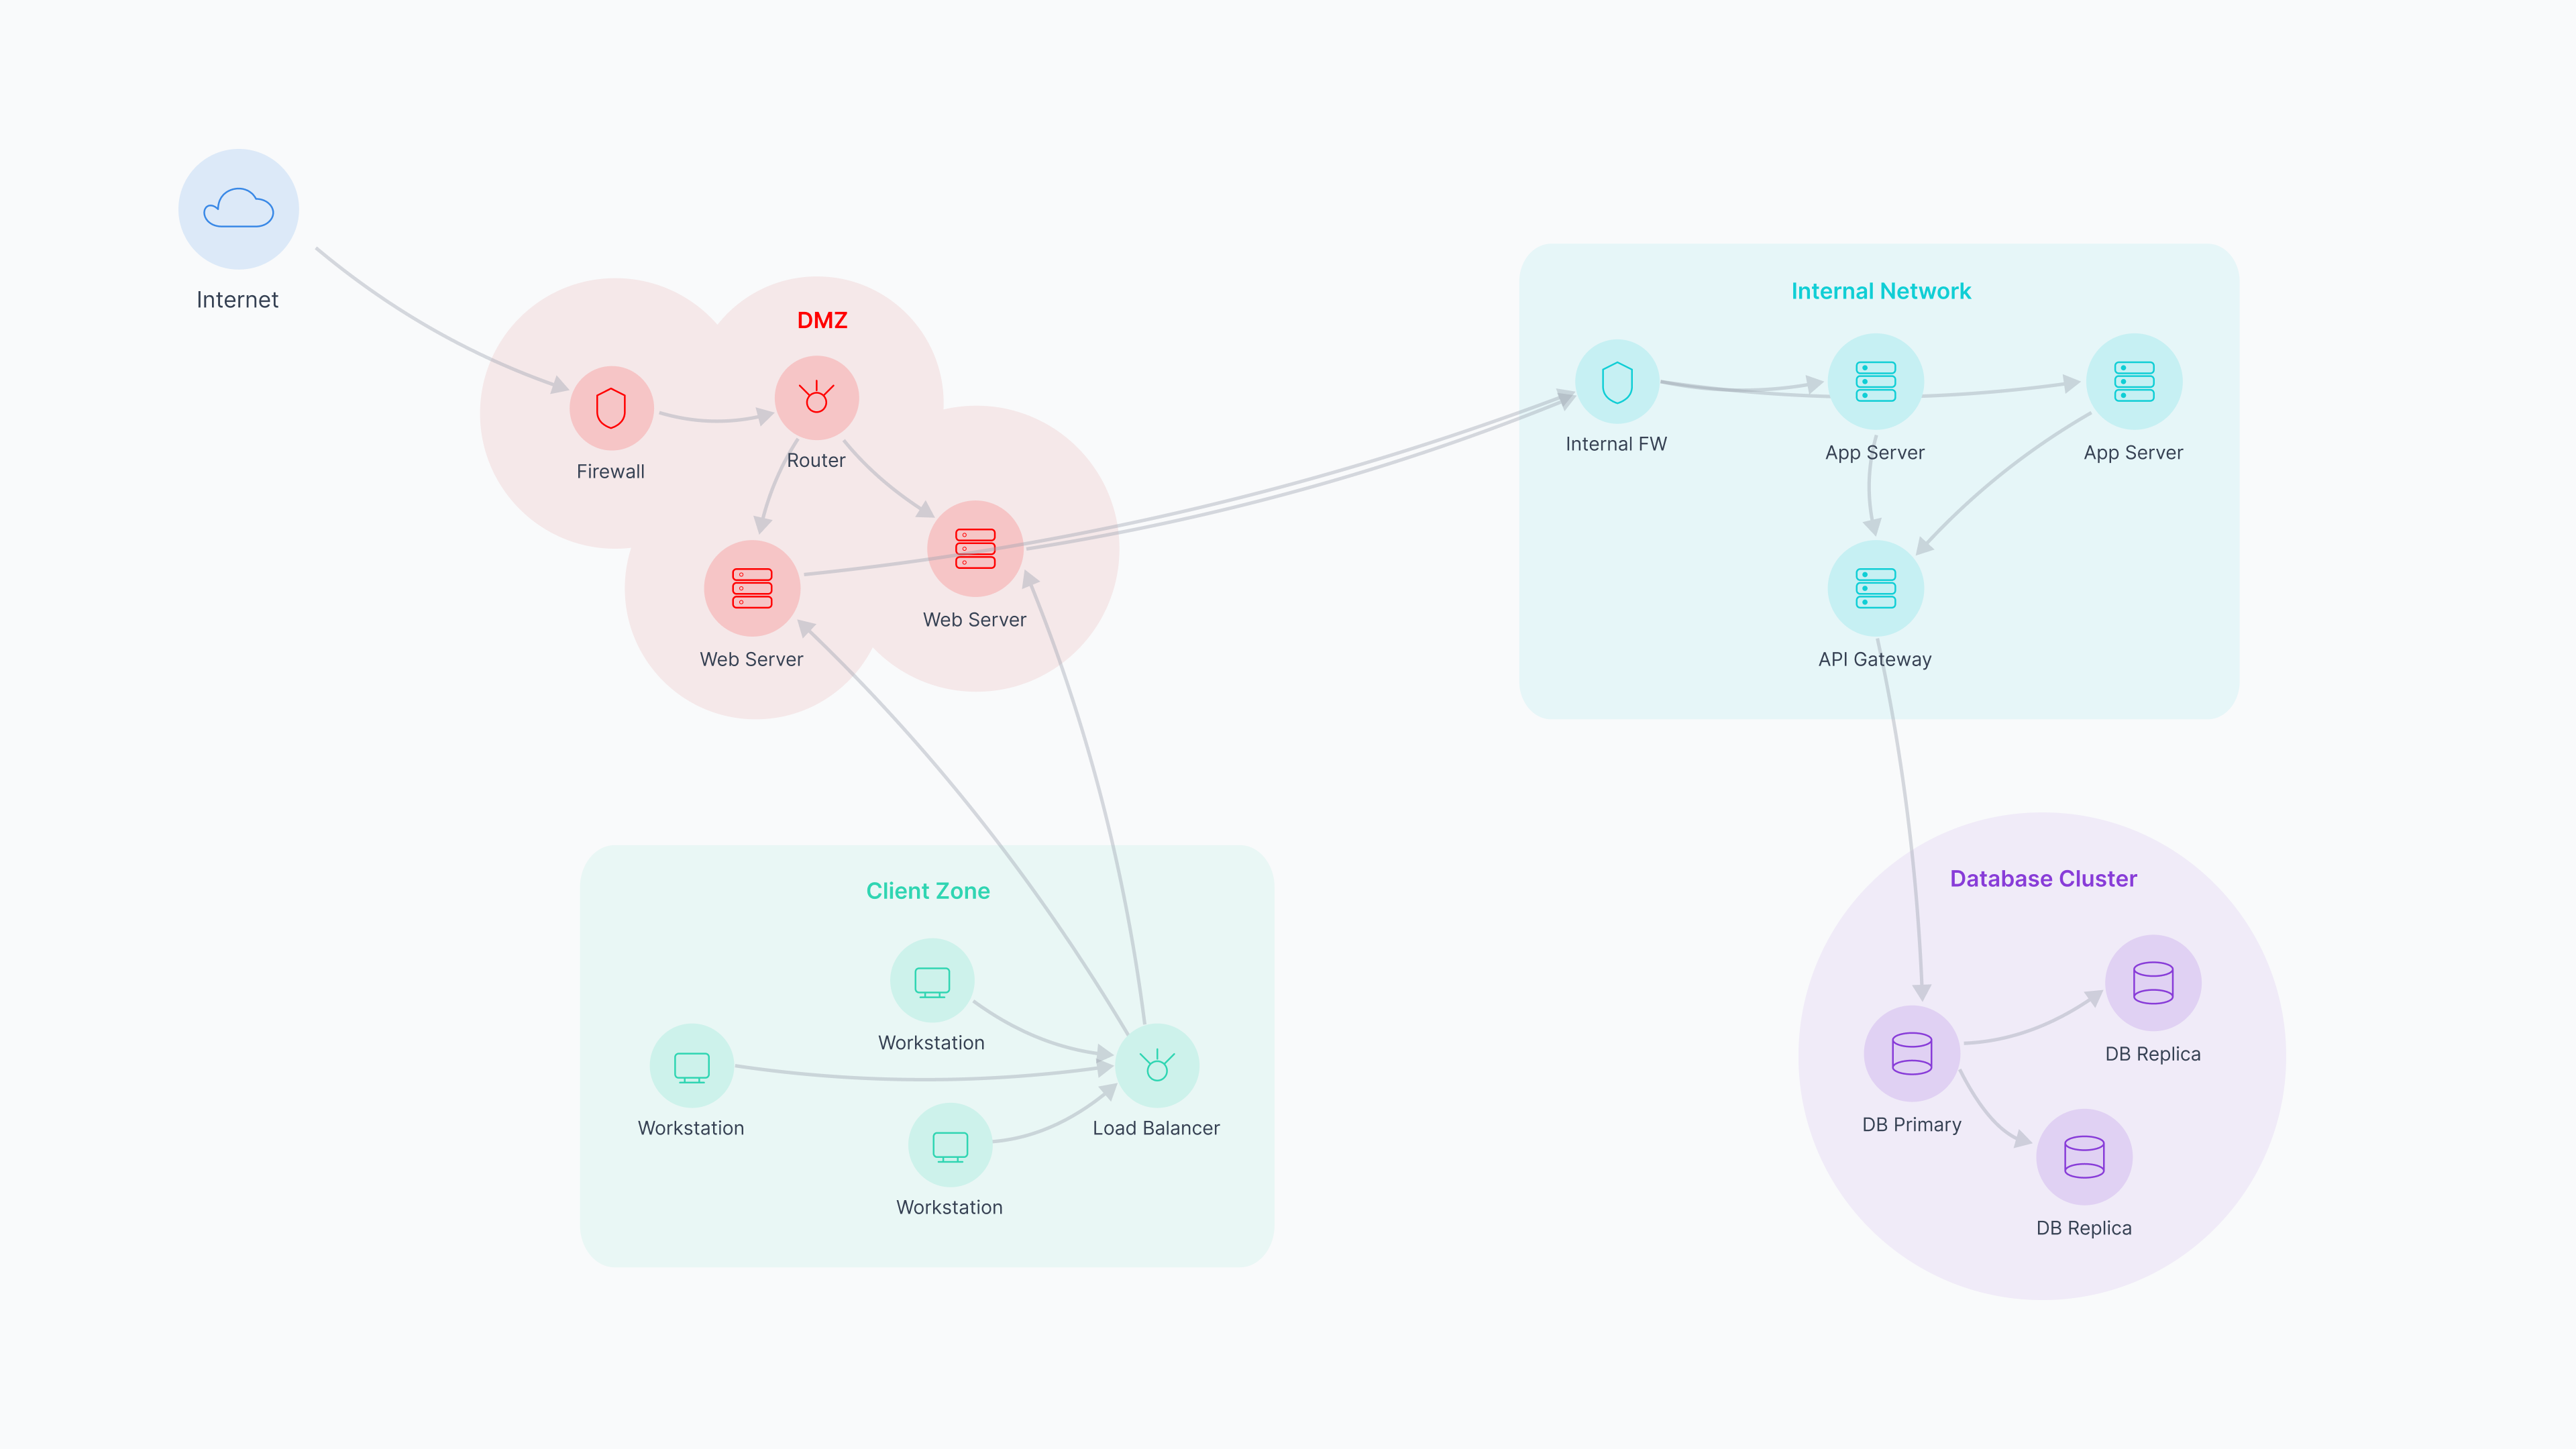
Infrastructure graph
Explore system architectures, database mappings, and hierarchical structures.
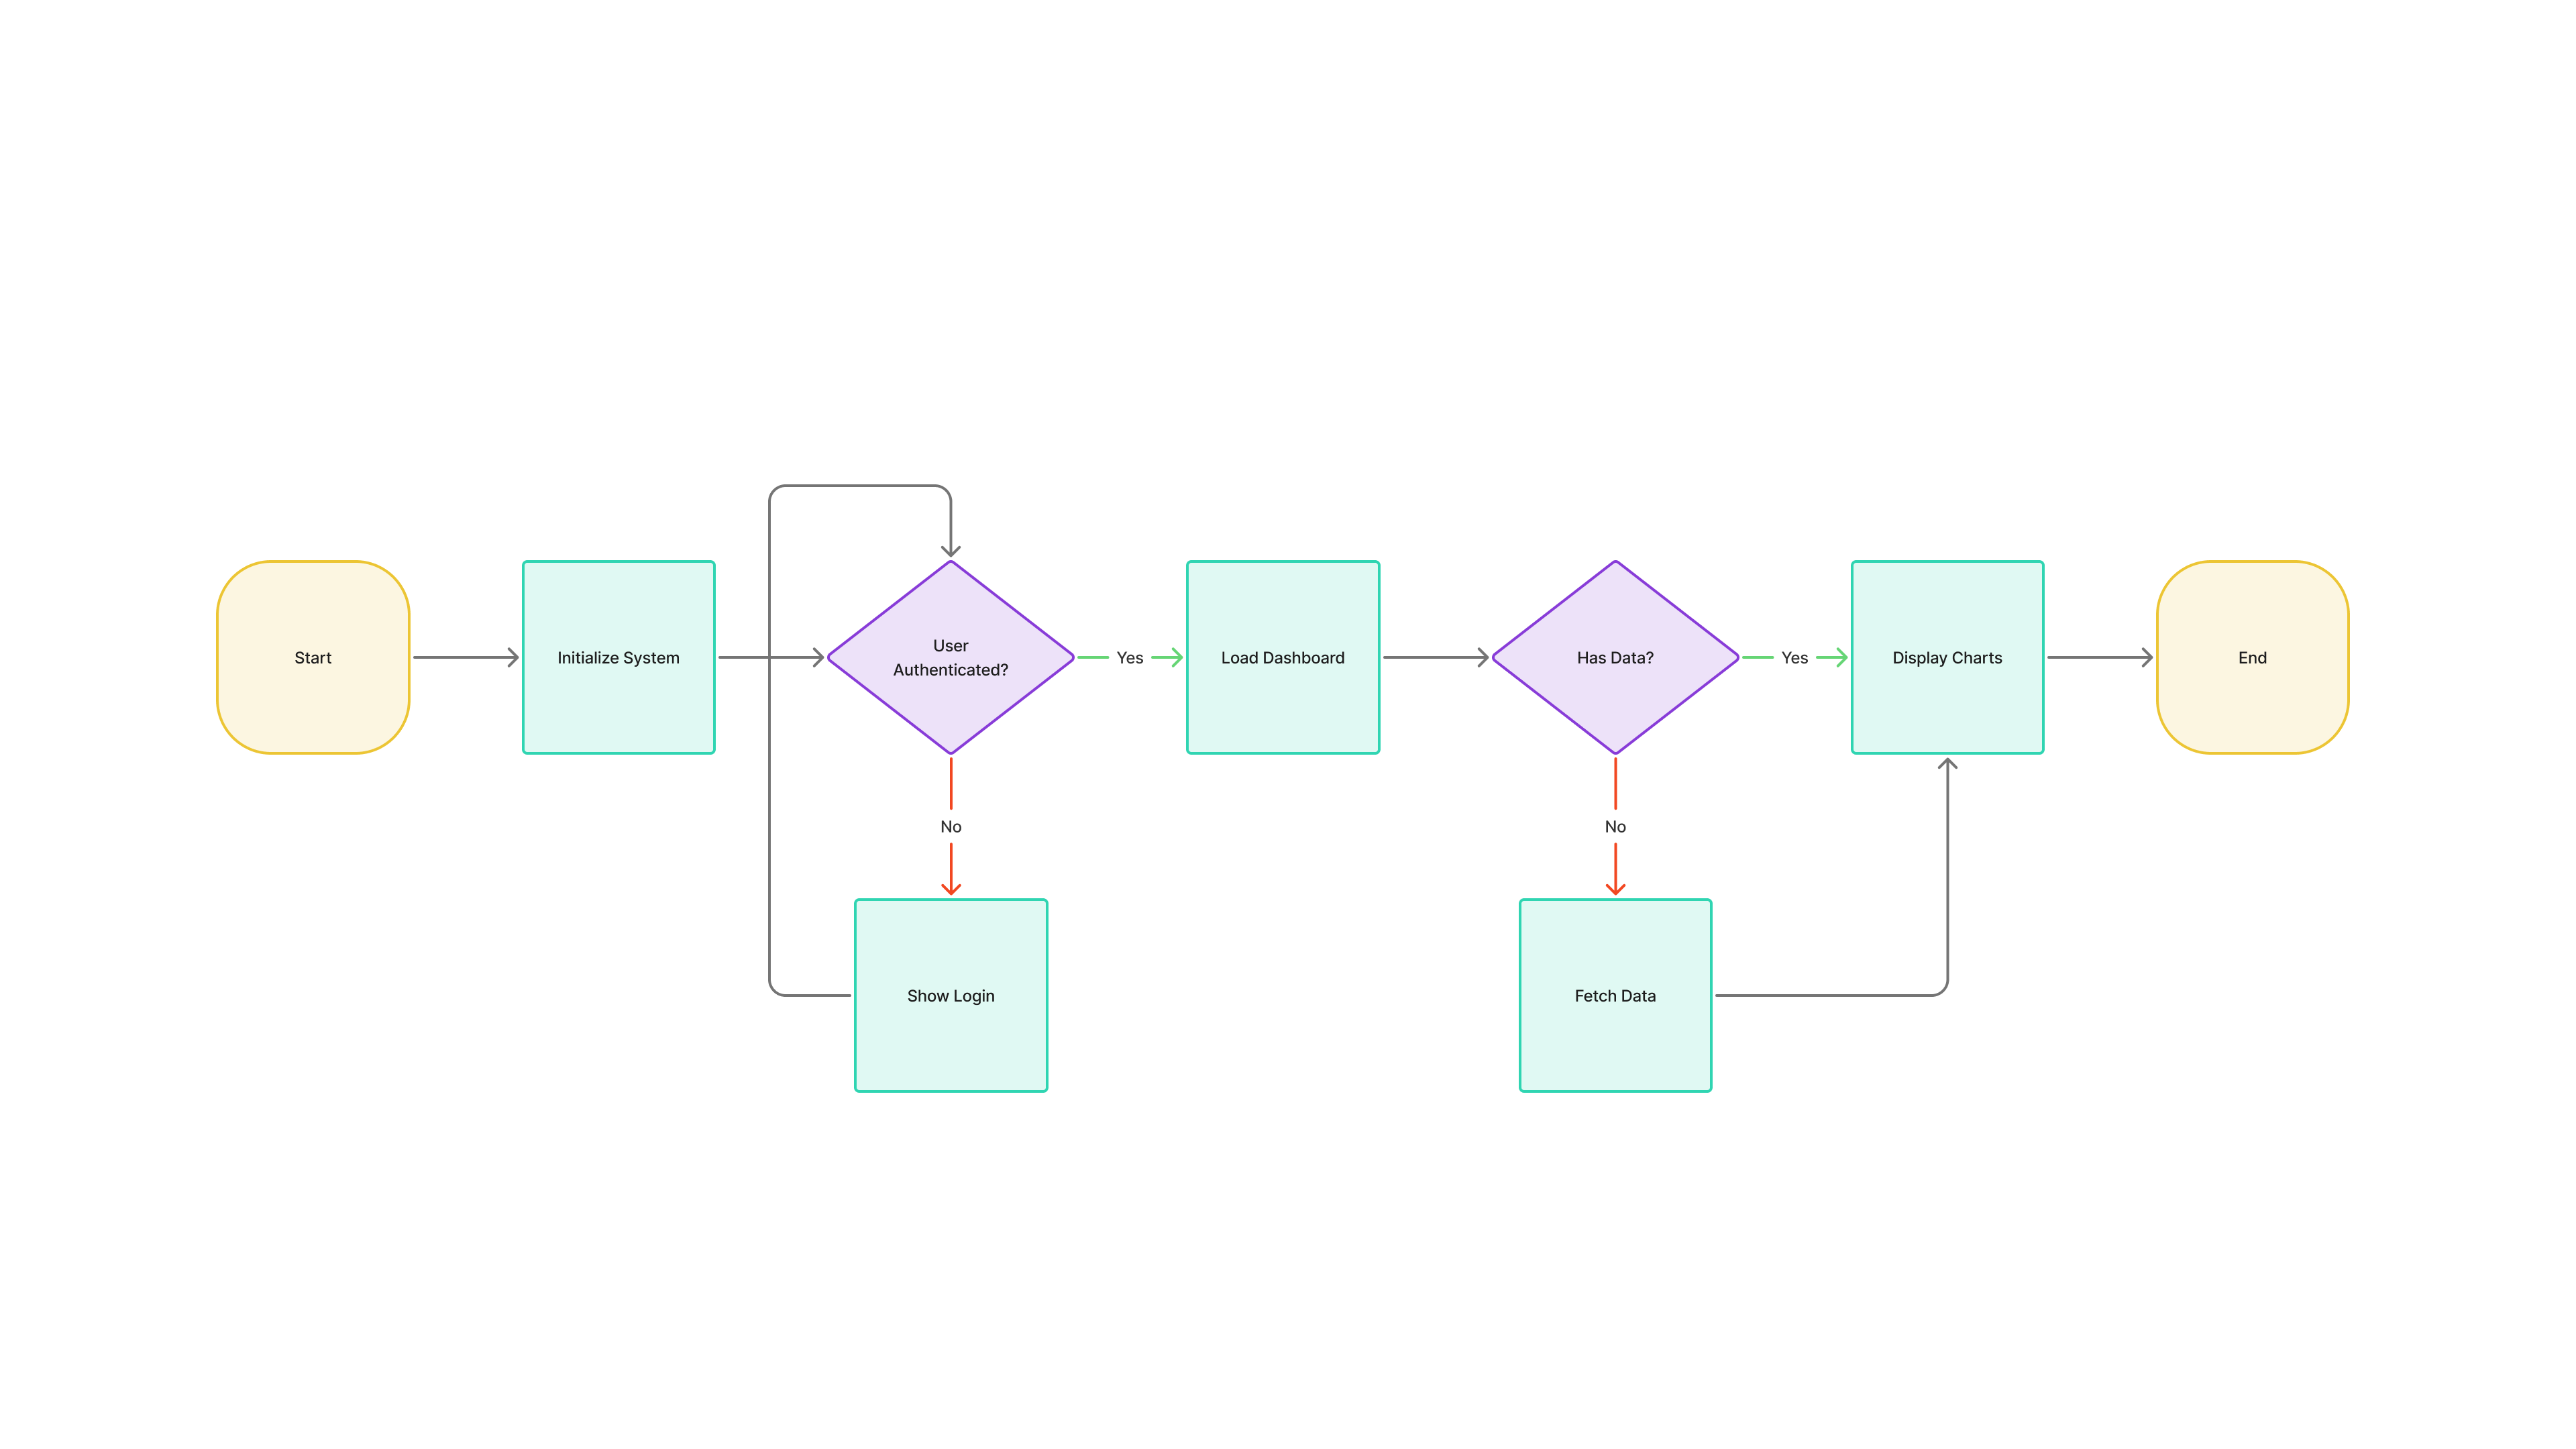
Flow Chart (Graph)
Interactive process mapping, workflow visualization, and operational diagramming.
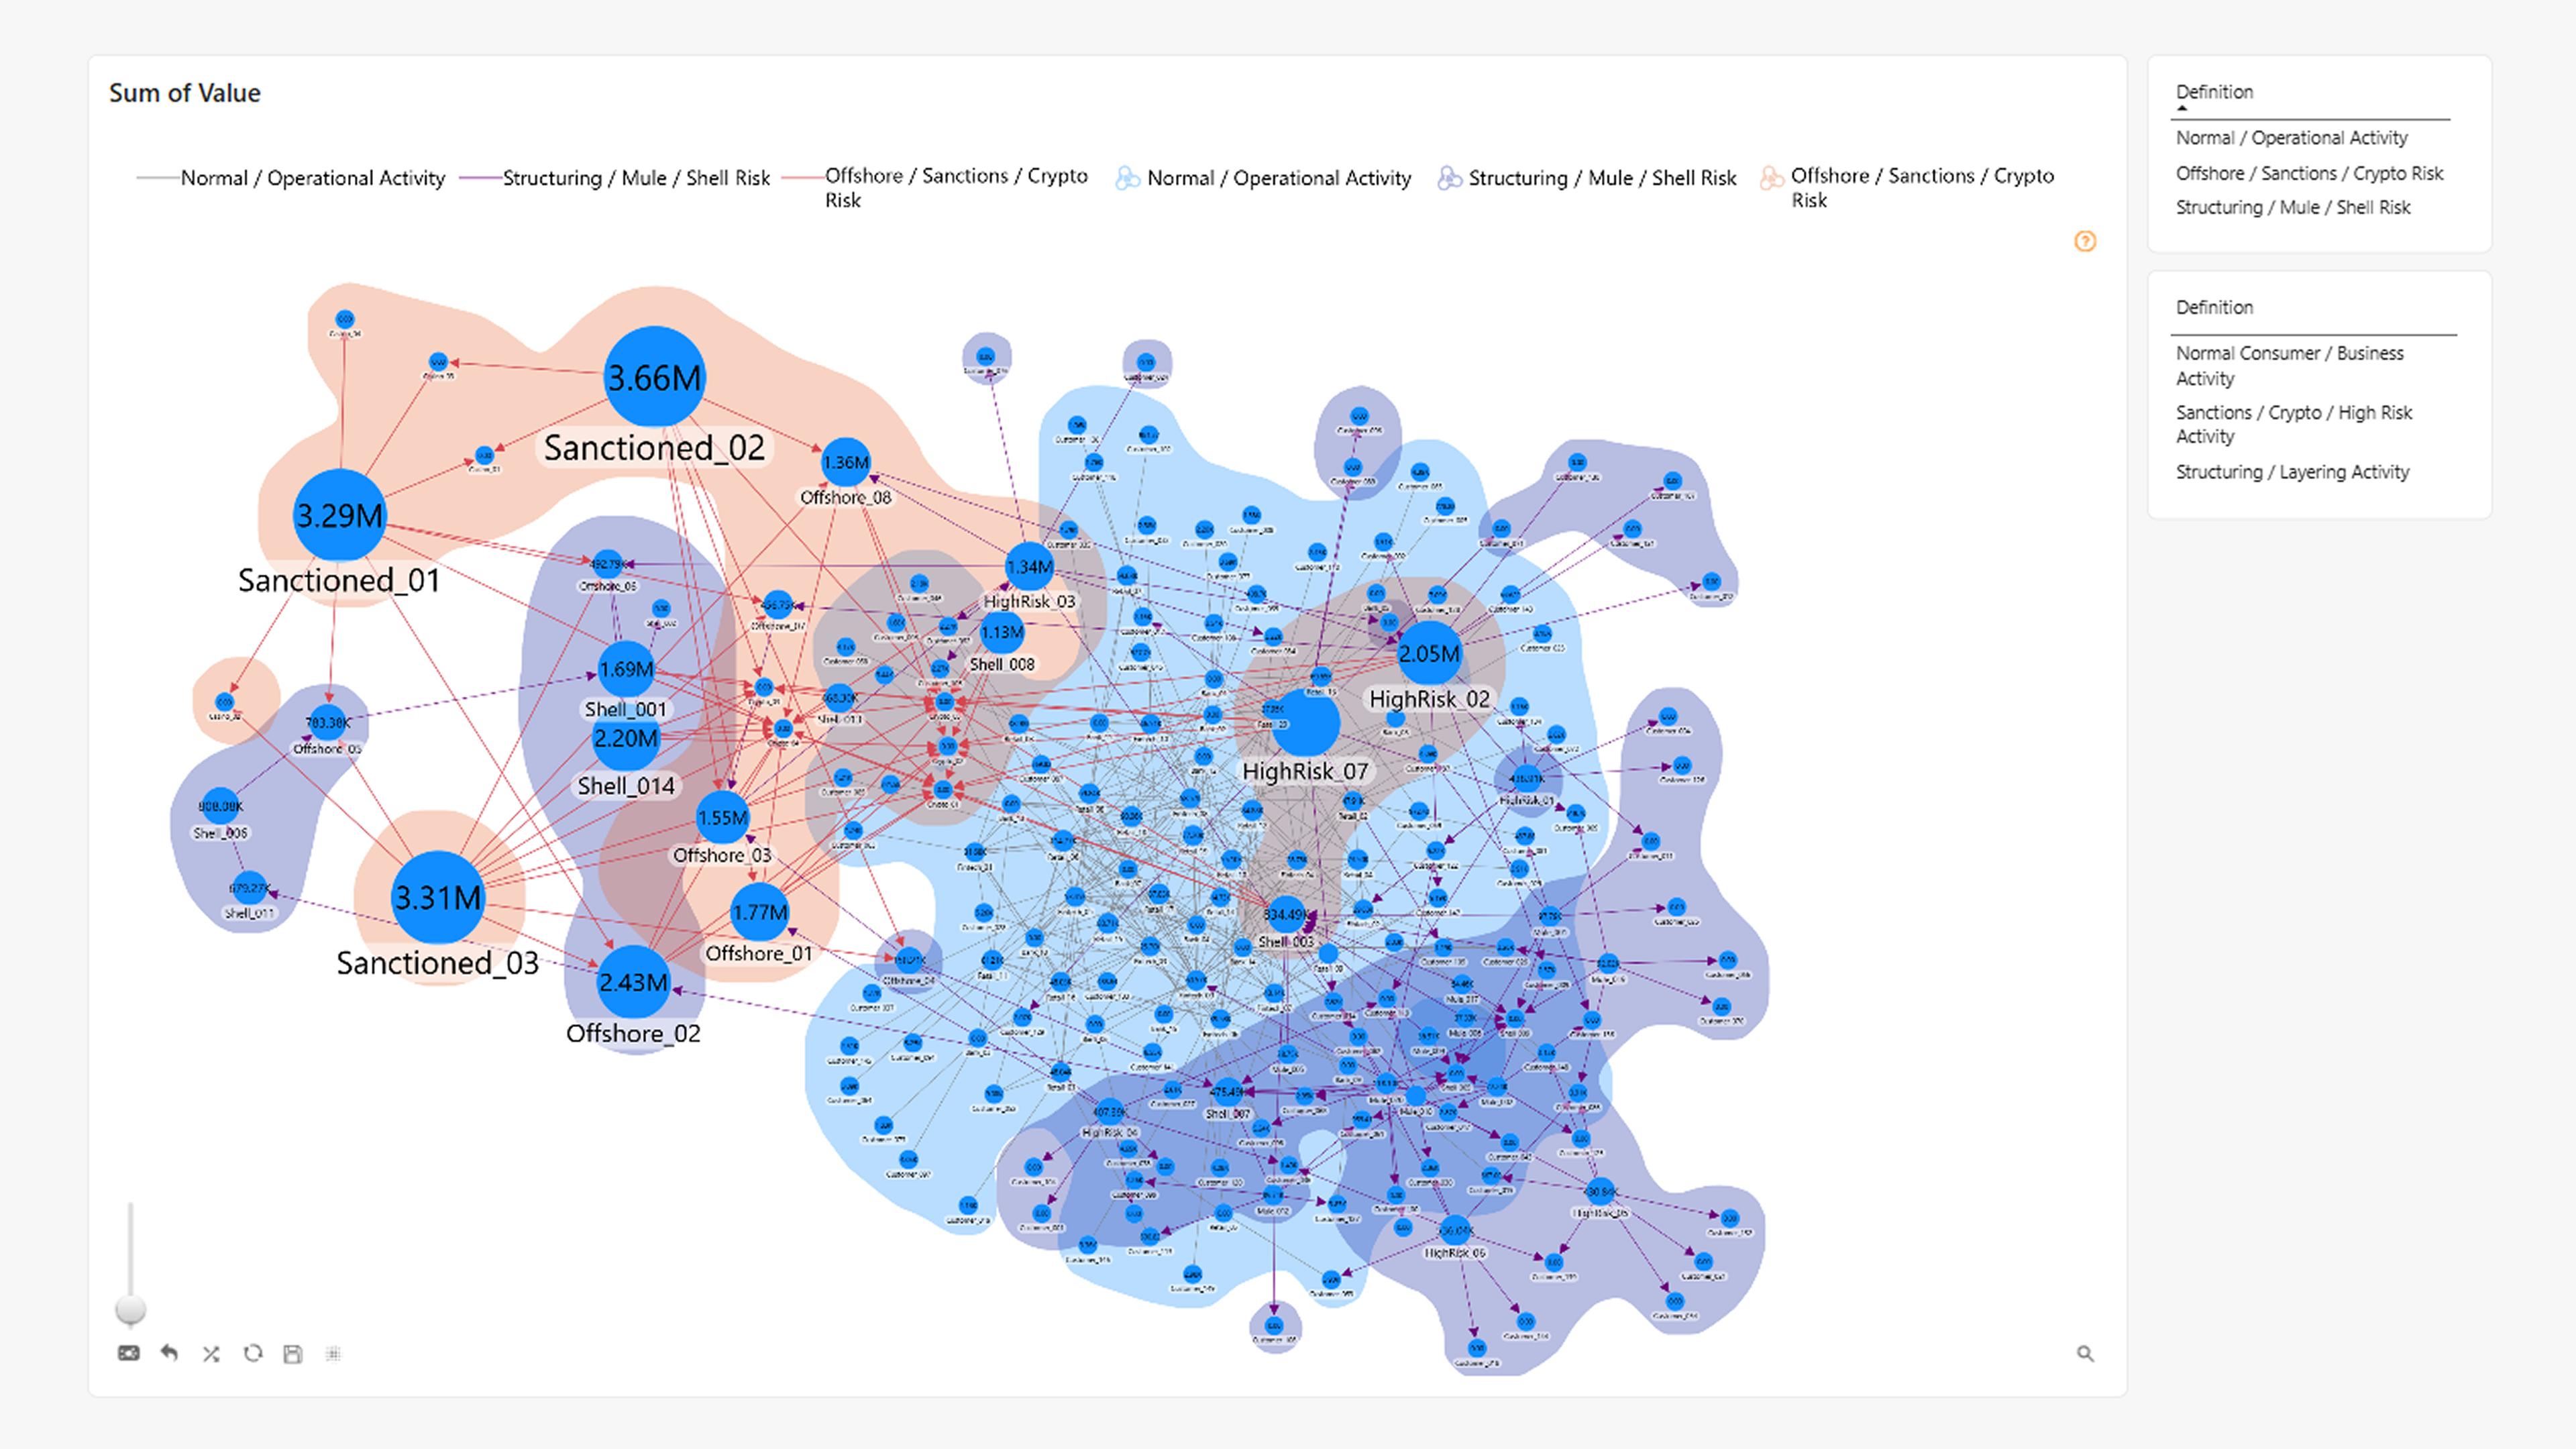
Connection Explorer
Map and analyze complex relationships between entities.
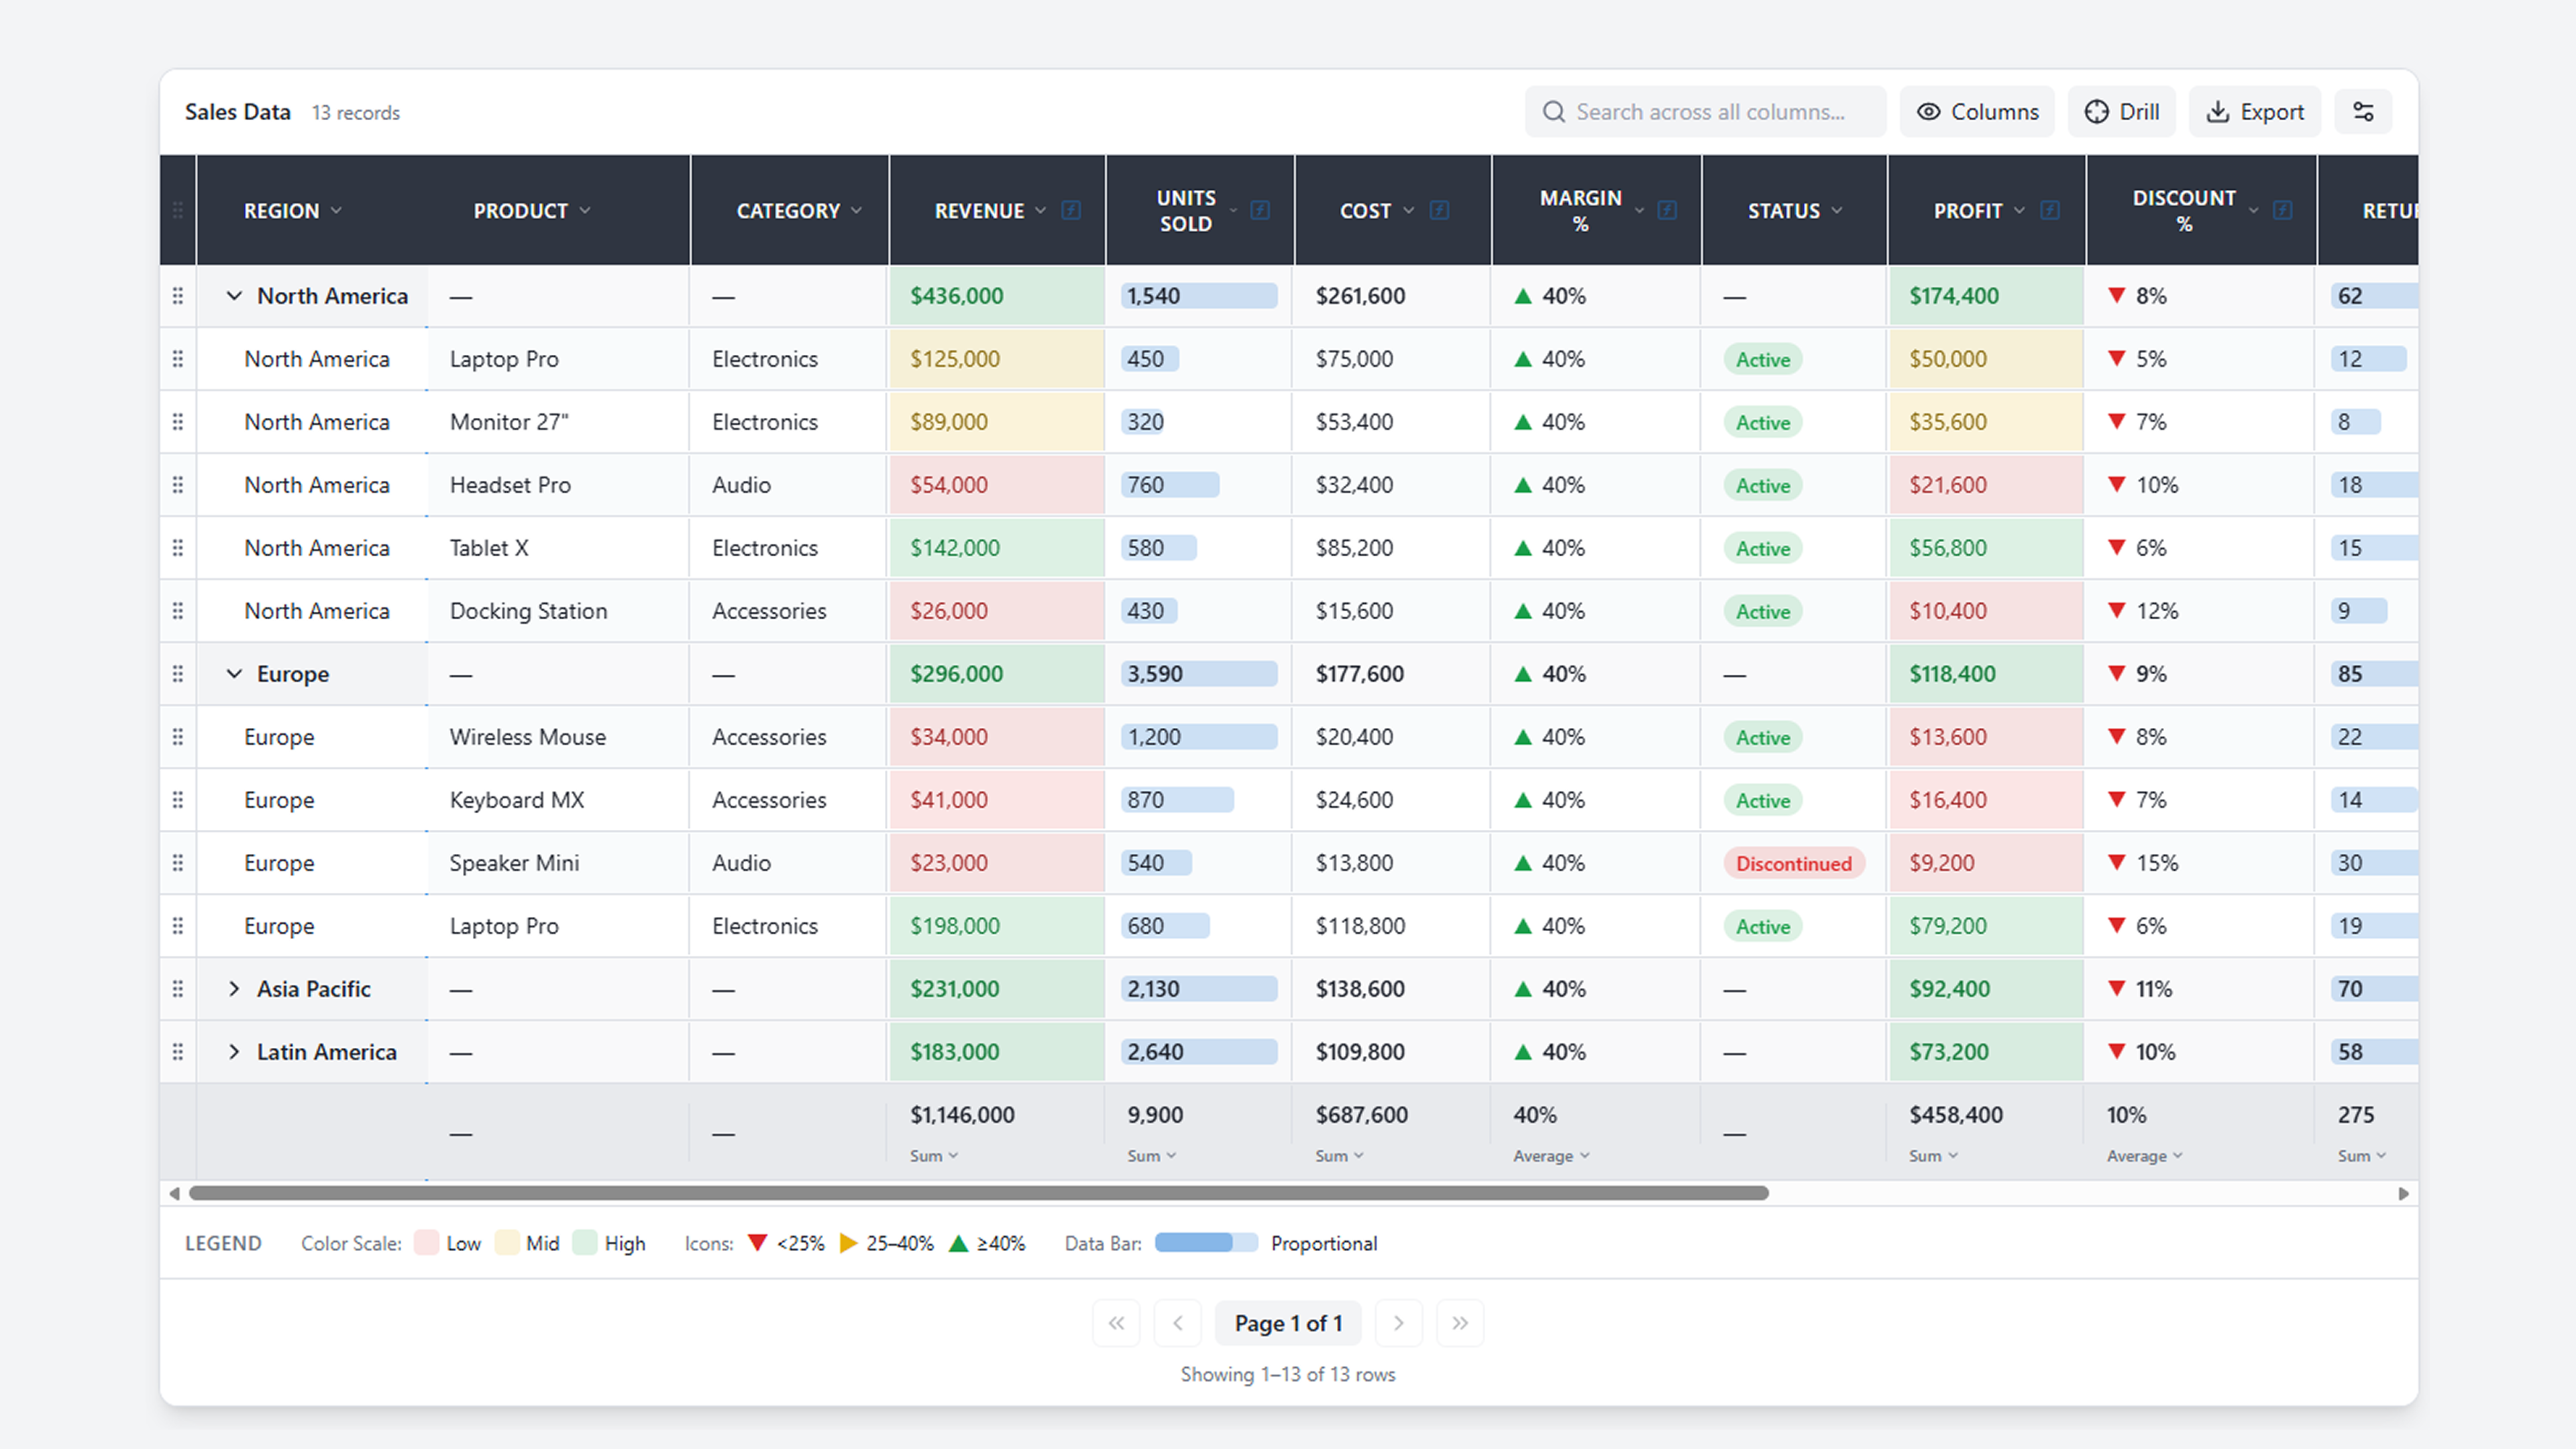
Table / Matrix
Interactive table & matrix visuals, smarter aggregations, advanced customization.
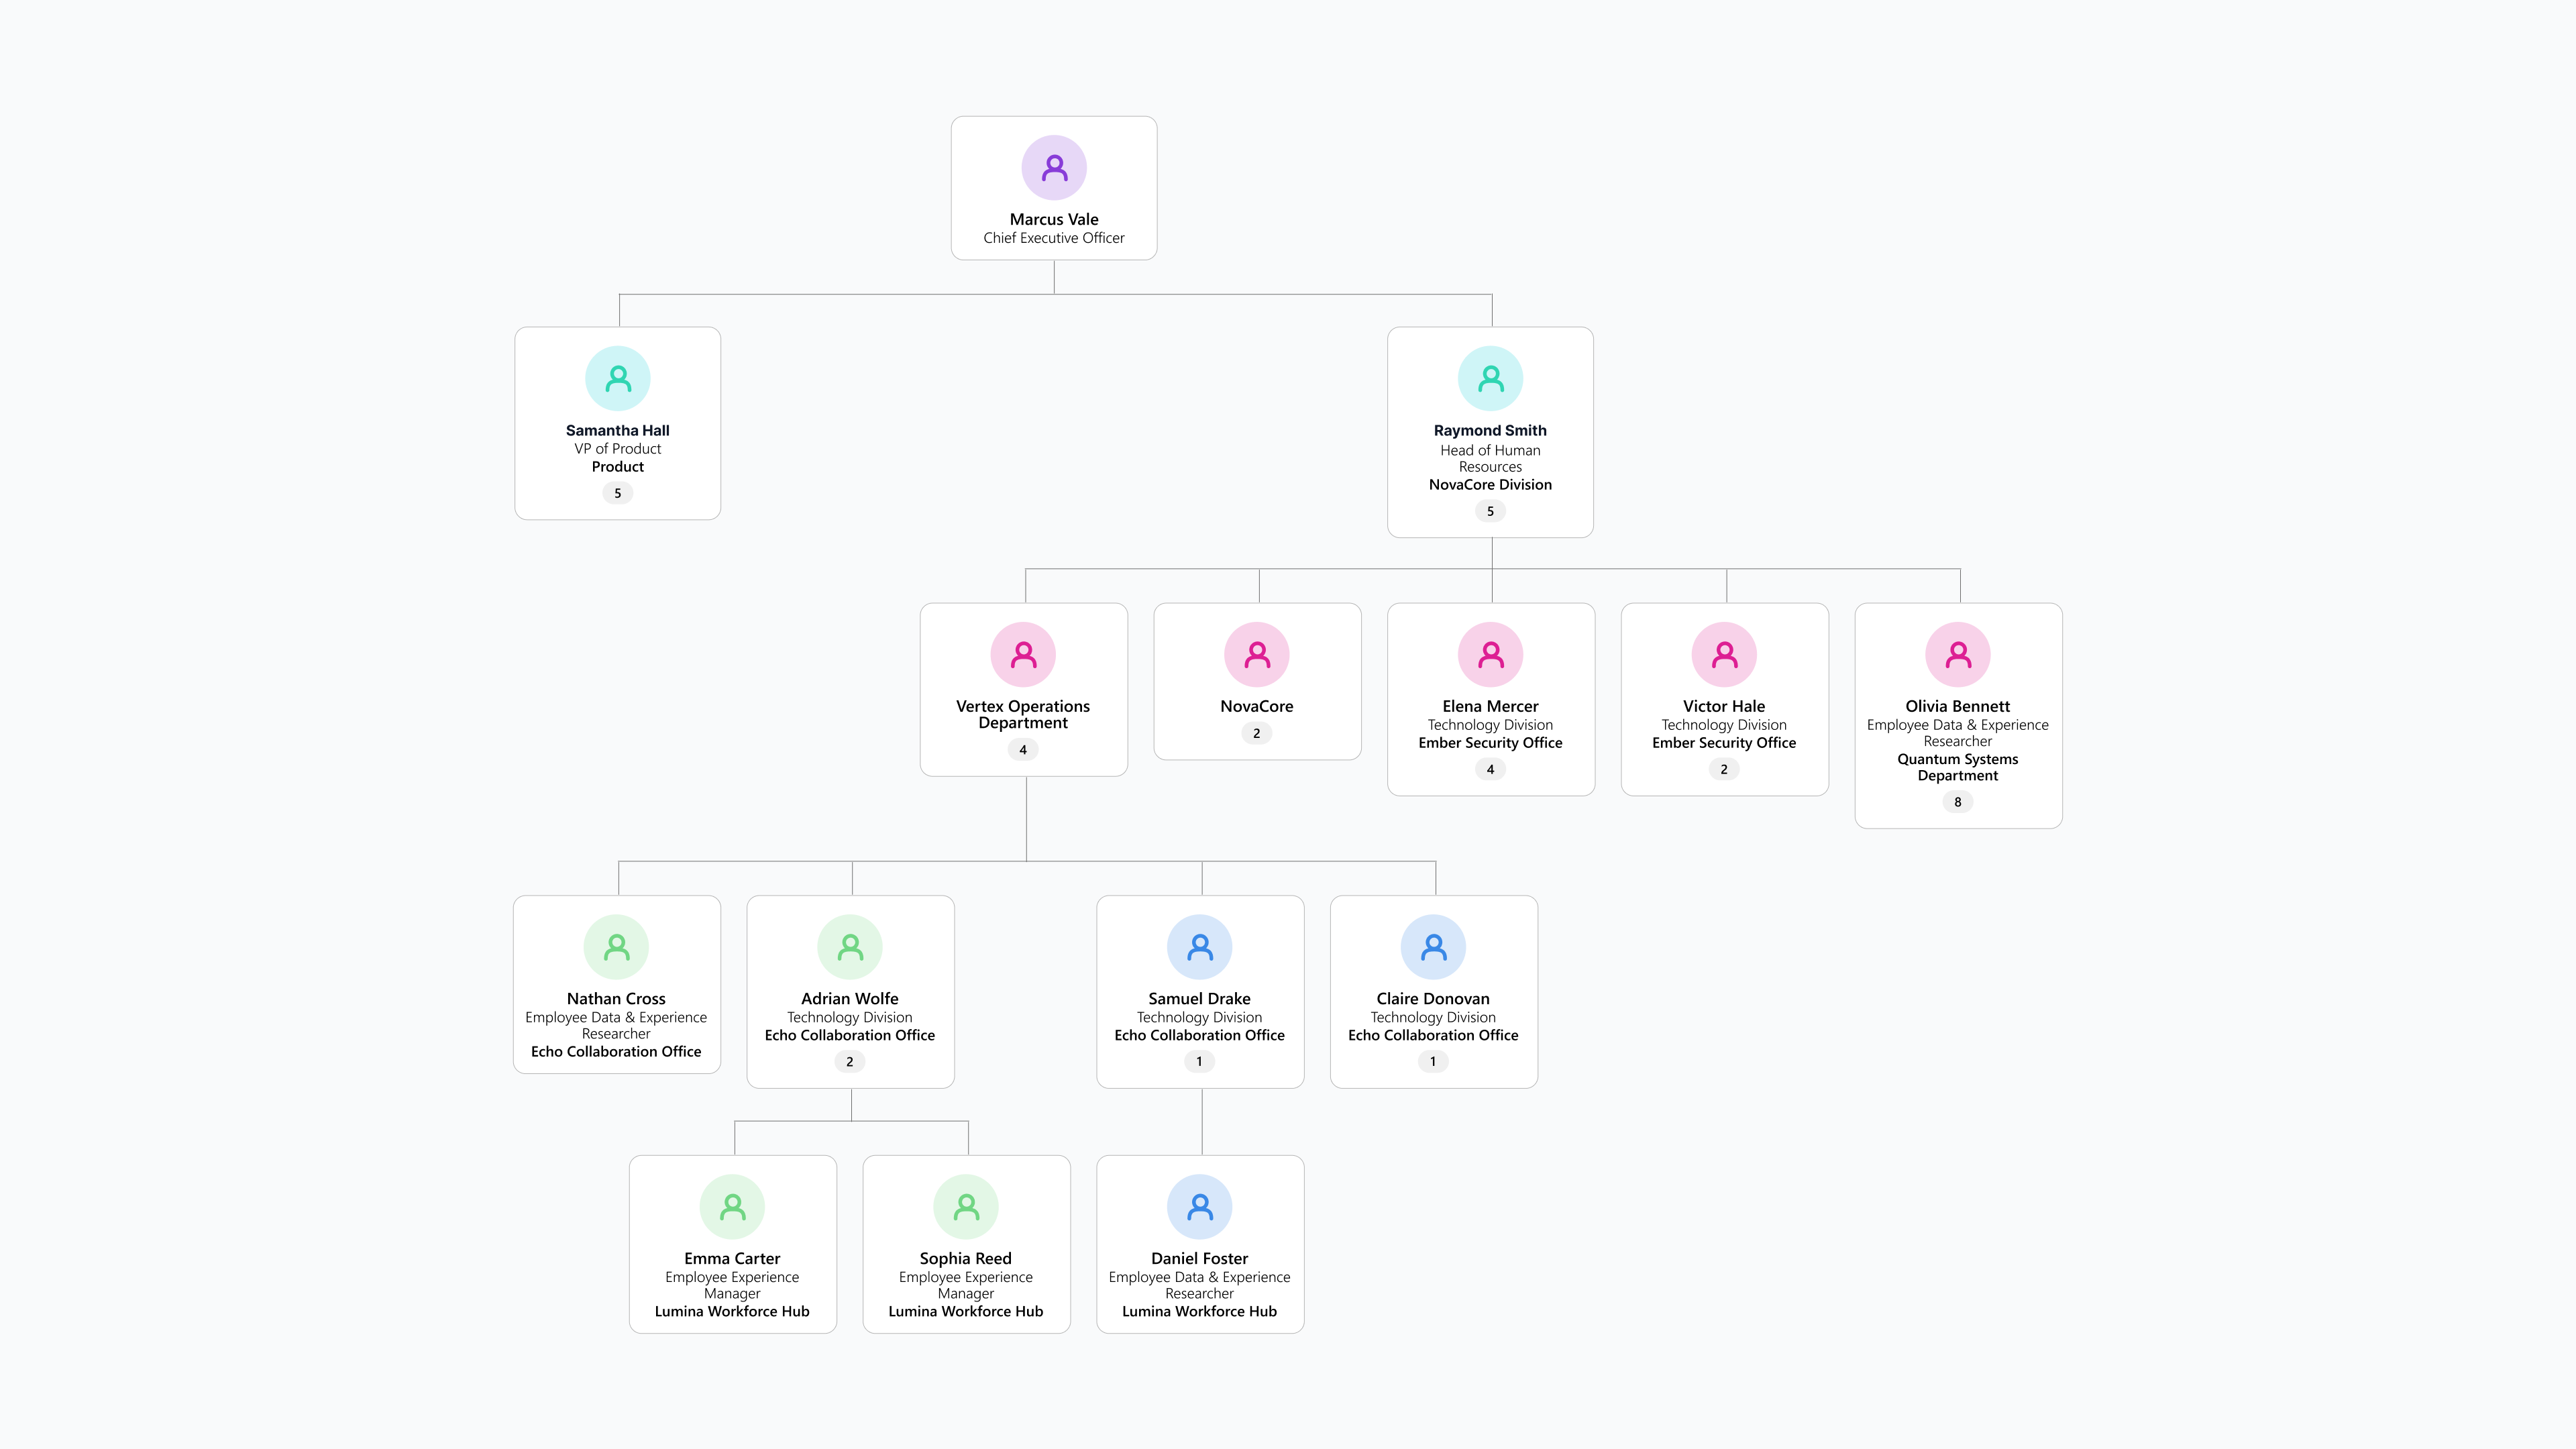
Organization chart
Exploring hierarchies, workforce data, and business metrics.
Don't see the visual you need?
Request visual or feature that fit your business needs.