1689
MFH E-COMMERCE ANALYSIS
MFH E-COMMERCE ANALYSIS
More Report pages
Report Author: María Fernanda Helguero
1689
Share template with others
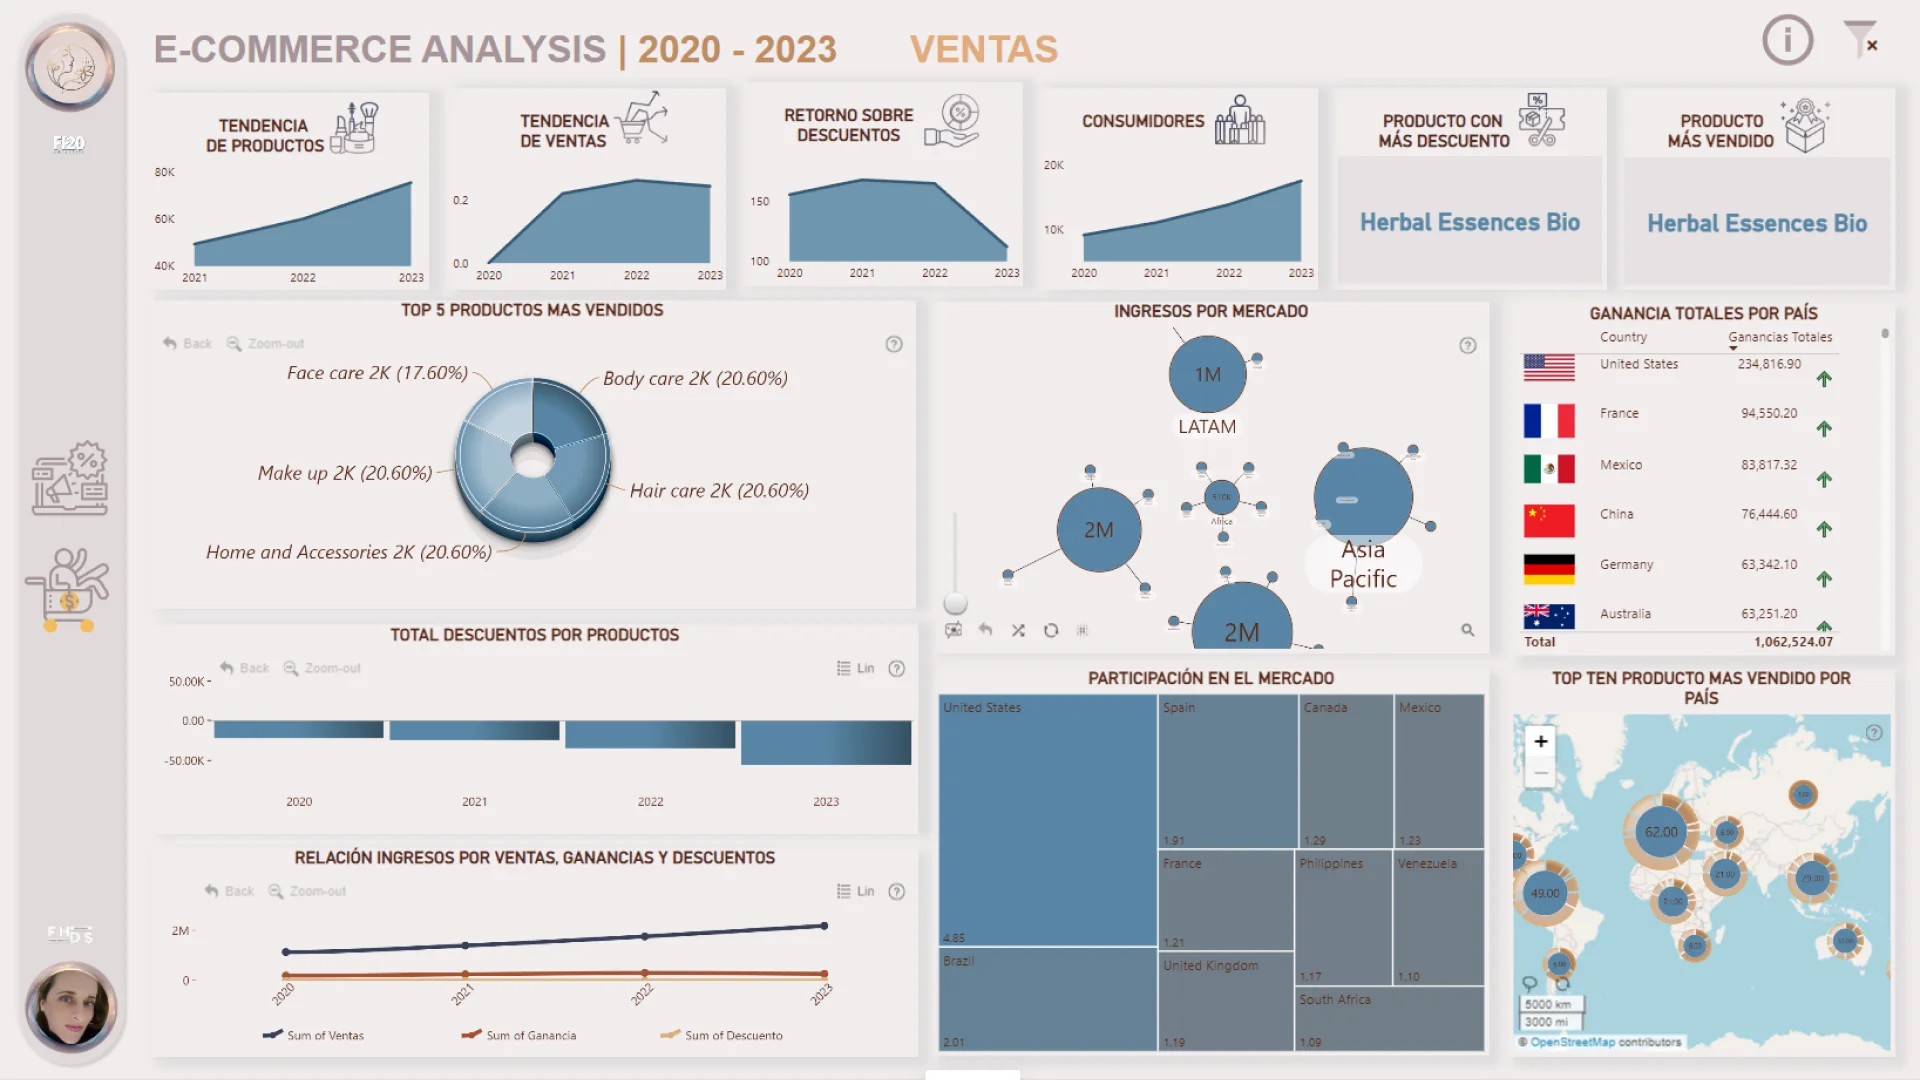
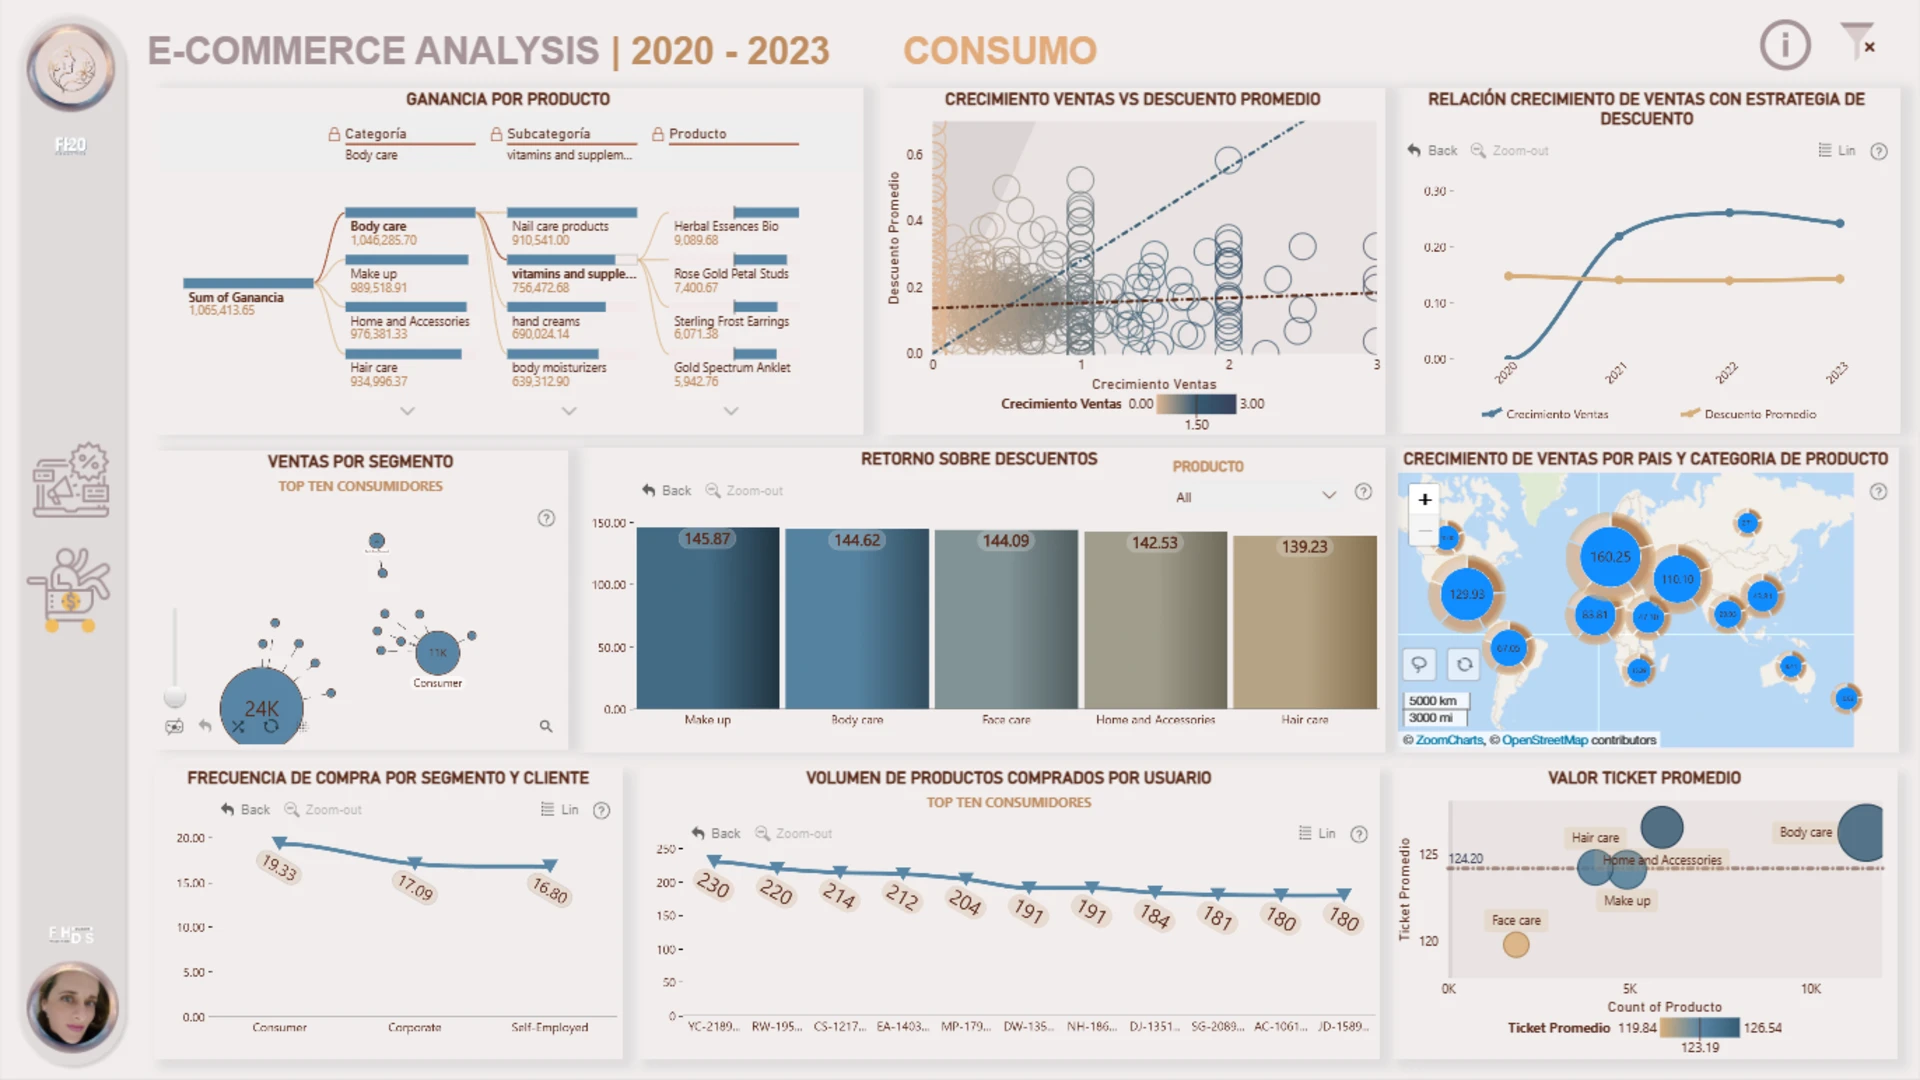
Report submitted for FP20 Analytics ZoomCharts Challenge 19 (September 2024). The report was built with the E-commerce KPI Analysis dataset and includes ZoomCharts custom Drill Down PRO visuals for Power BI.
Author's description:
Envio nuevamente mi reporte, al que le efectué las modificaciones sugeridas por el equipo de zoomcharts en cuanto a sustituir un objeto visual que no tenía permiso de publicación, el boton de inforación, el de borrar segmentaciones y filtros, así como el empleo de colores para la diferenciación de categorias. Ésta es la versión final, ya que si bien existen unos oobjetos visuales (en la págiana de consumos) a los que se les podría aplicar la diferenciación por colores, ello se vuelve muy engorroso por la granulidad de los ID de clientes.
ZoomCharts visuals used




4U Report Challenges
Participate in data challenges, build and submit reports to get free template downloads.
Join CommunityMobile view allows you to interact with the report. To Download the template please switch to desktop view.



How to use a PBIX template
Preview the interactive report, download the PBIX file, open it in Power BI Desktop, and replace the same data connection with your own dataset.
Preview and download
Explore the report online and download the PBIX template file.
Open in Power BI Desktop
Open the downloaded PBIX file in Power BI Desktop.
Connect your data
Replace the sample data source with your own dataset.
Refresh and adjust
Refresh the model and update fields or visual were needed.
Save and share
Save your report and publish it for your audience.


