2159
Skincare and Beauty E-Commerce KPI Dashboard
Skincare and Beauty E-Commerce KPI Dashboard
More Report pages
Report Author: Rakshit Bhadoria
2159
Share template with others
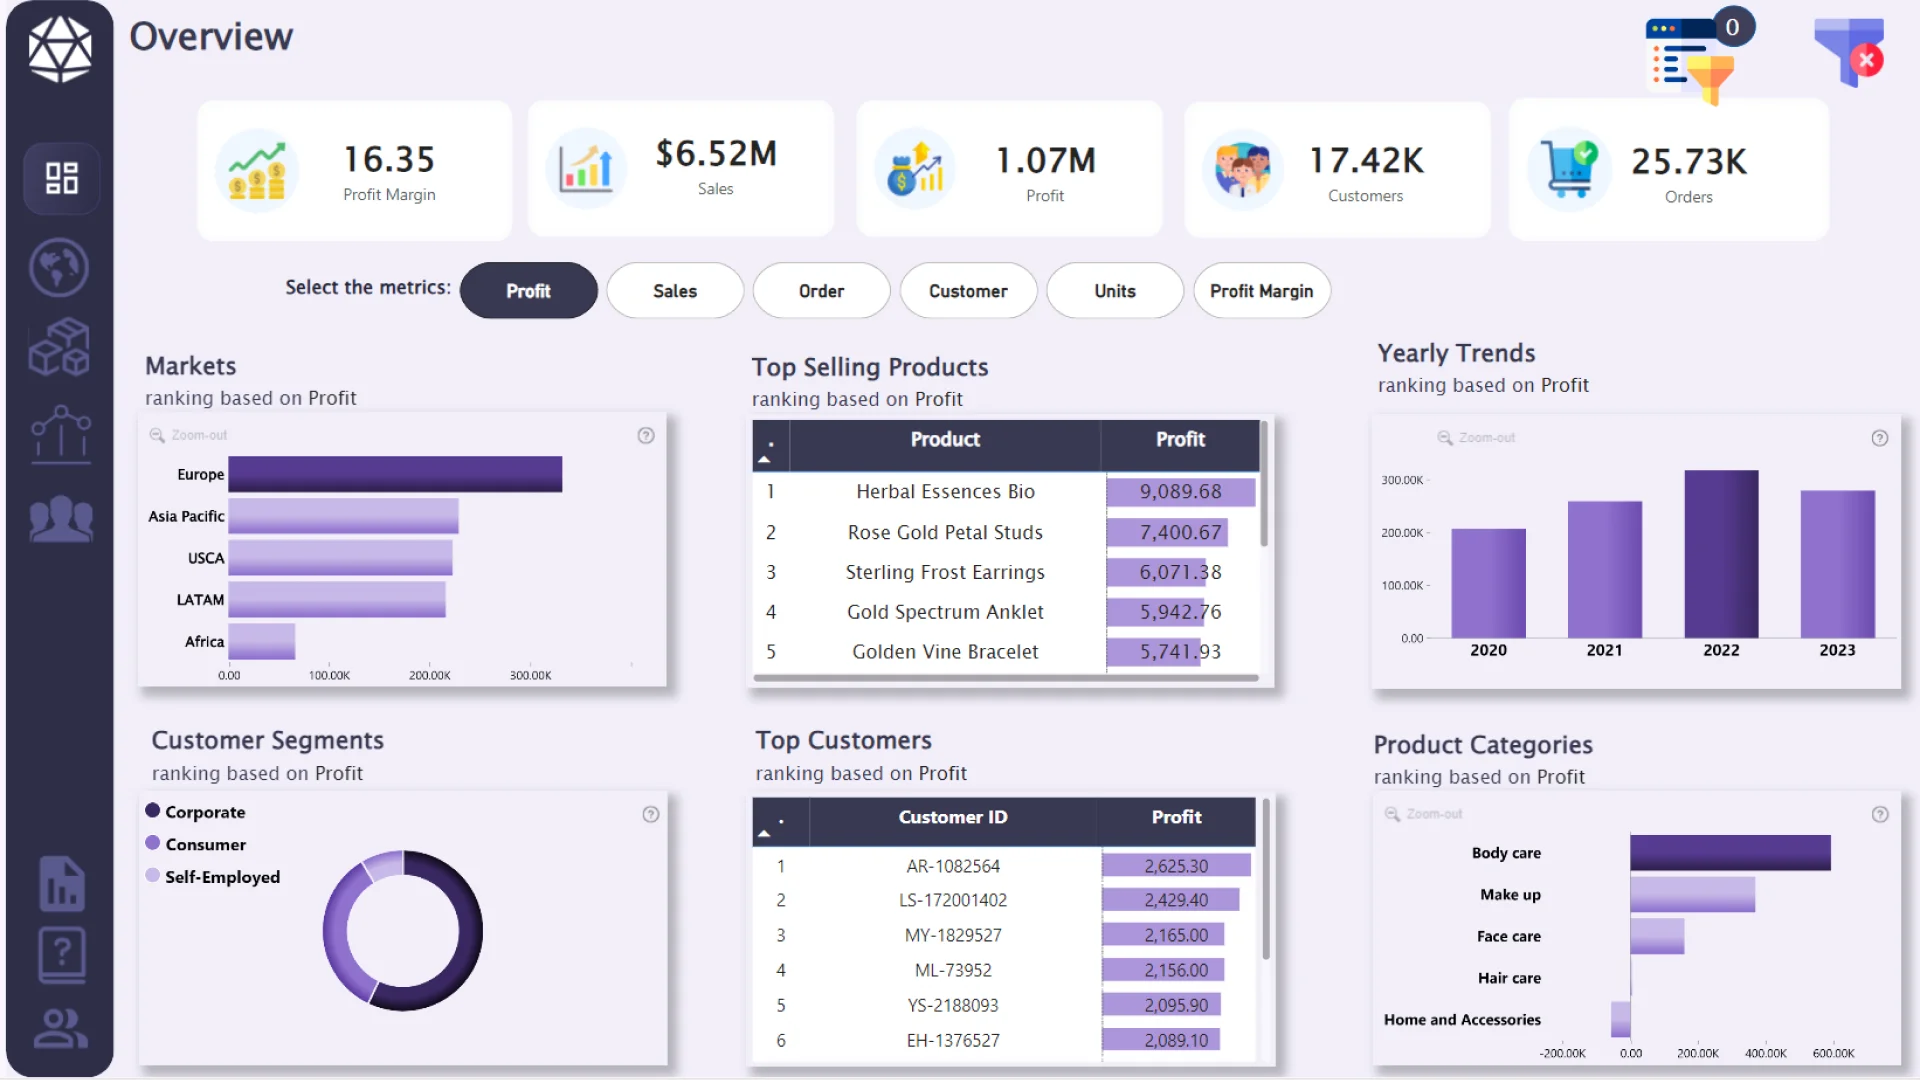
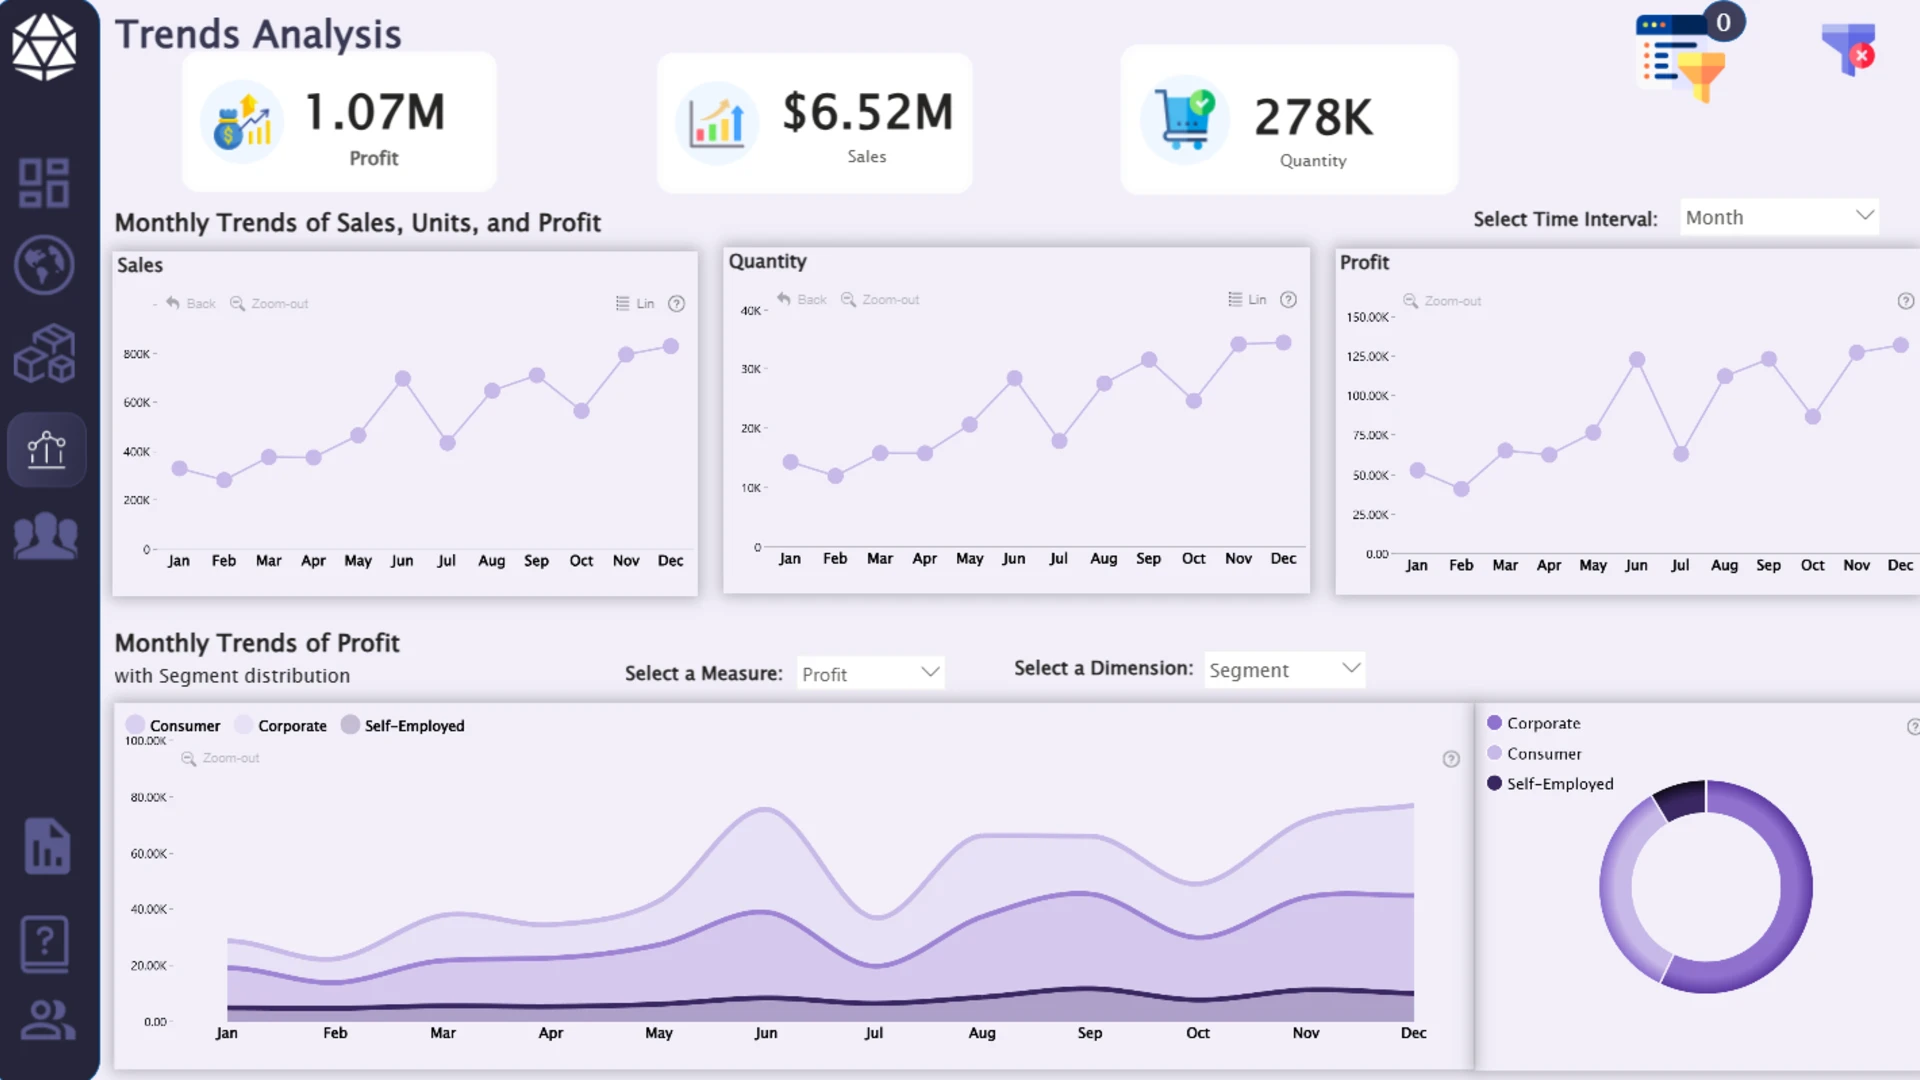
E-Commerce KPI Dashboard
A Power BI dashboard example for analyzing global skincare and beauty e-store sales, profit margins, market performance, and growth trends.
Explore a Power BI dashboard example for a global skincare and beauty e-store, built with native Power BI visuals and ZoomCharts Drill Down PRO visuals. The report helps e-commerce and retail analytics teams analyze sales growth, profit margins, and market performance from 2020 to 2023.
Users can review KPI trends, compare performance across markets, and identify opportunities to improve financial results through interactive sales and profitability analysis.
Key Insights of This E-commerce Dashboard
Sales Growth
Analyze sales performance and growth patterns across the 2020-2023 period.
Profitability Analysis
Review profit margins and identify where financial performance can be improved.
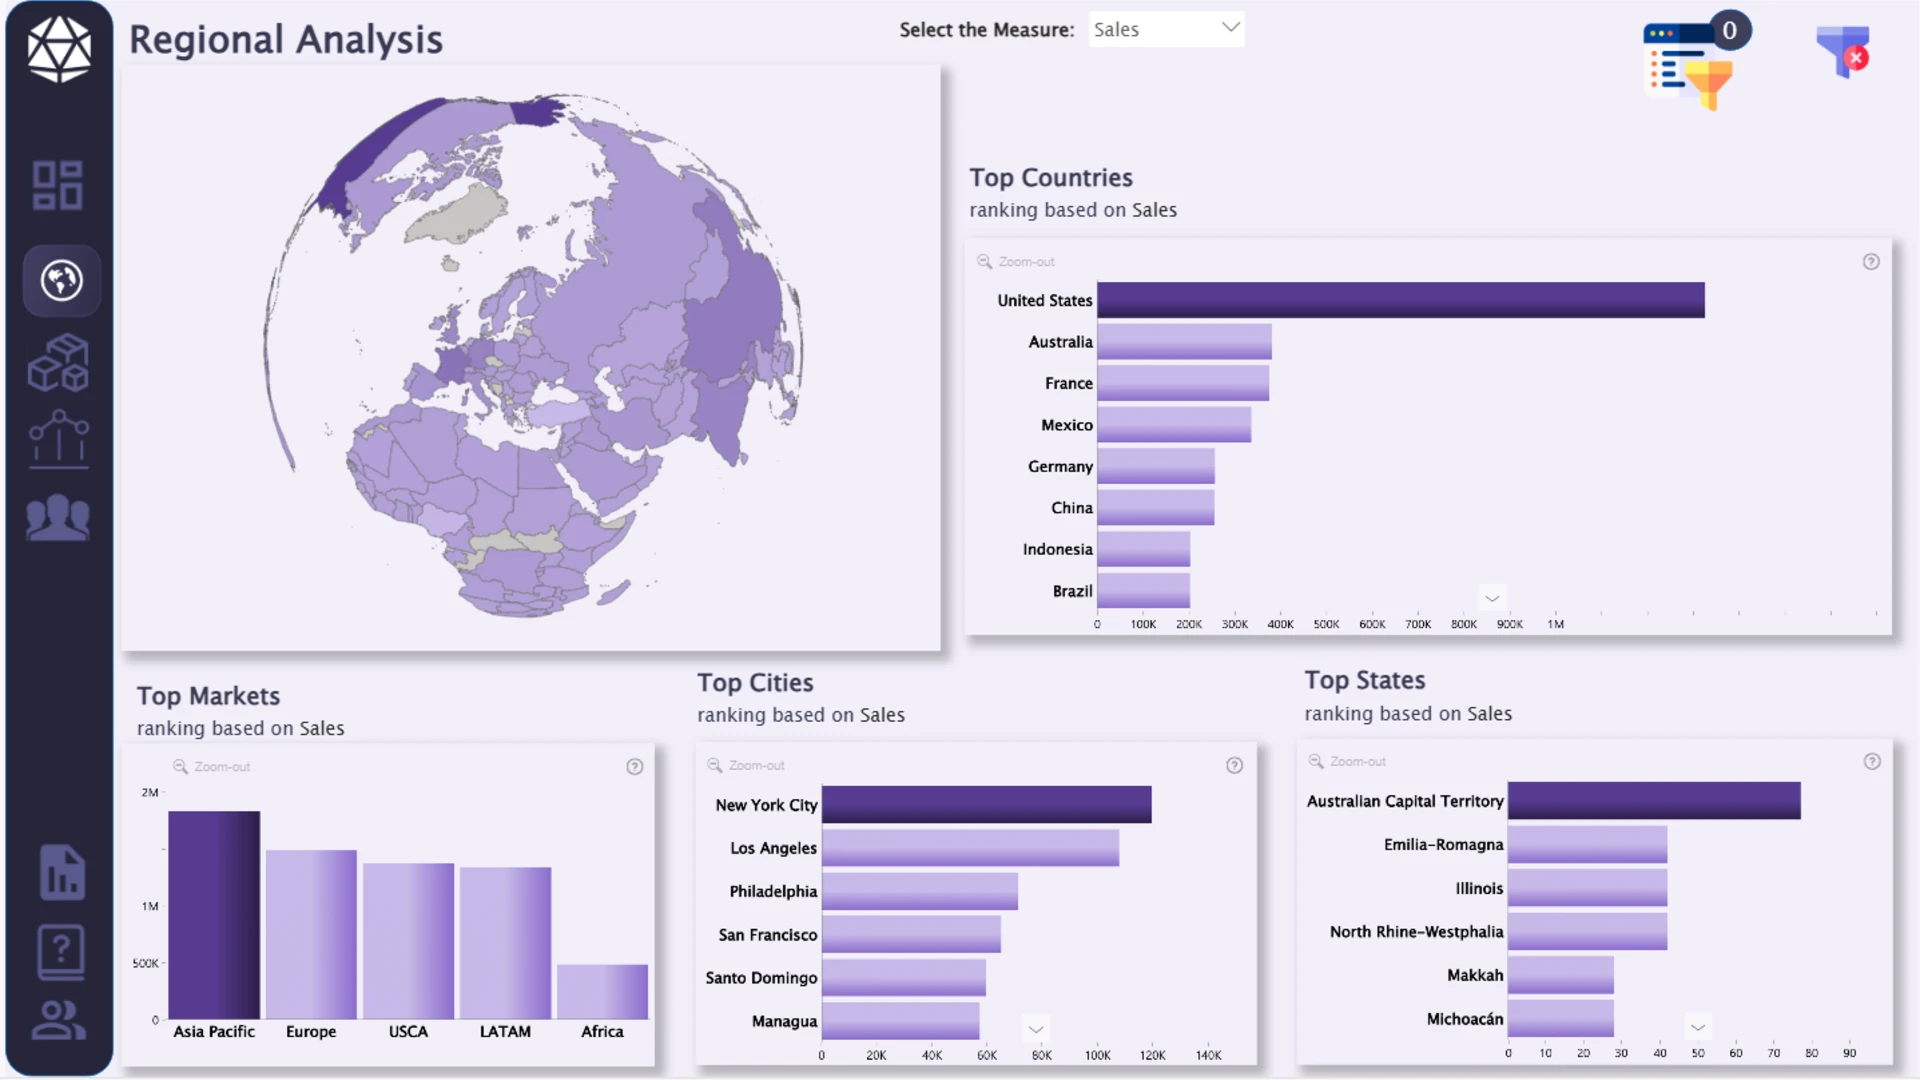
Market Performance
Compare performance across global markets and uncover regional opportunities.
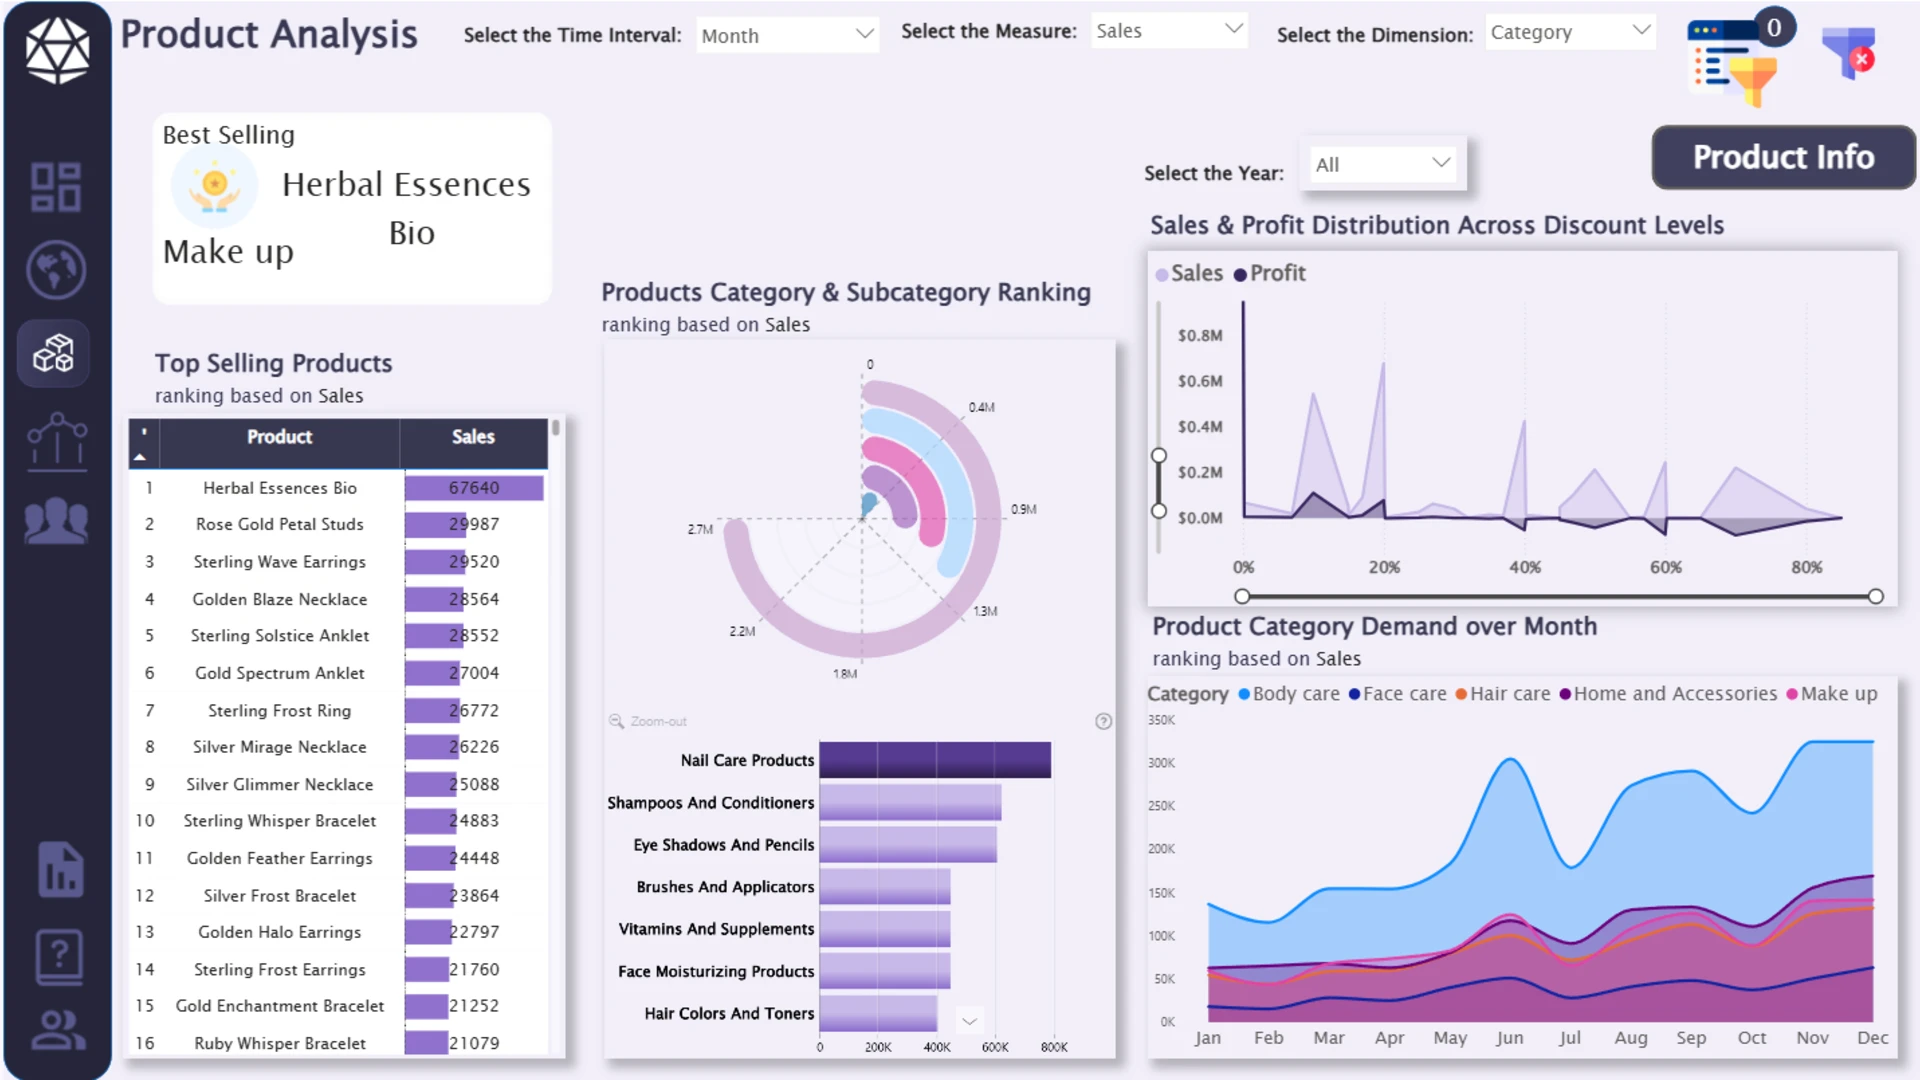
Interactive Drill-Down
Use ZoomCharts Drill Down PRO visuals to explore sales and profitability from summary KPIs to deeper detail.
Why This Report Is Useful
This dashboard gives e-commerce and retail analytics teams a clear way to monitor business performance, compare markets, and discover opportunities for improving sales growth and profitability.
4U Report Challenges
Participate in data challenges, build and submit reports to get free template downloads.
Join CommunityMobile view allows you to interact with the report. To Download the template please switch to desktop view.

Was this helpful? Thank you for your feedback!
Sorry about that.
How can we improve it?