675
E-commerce C19 FP20 Challenge
E-commerce C19 FP20 Challenge
Report Author: Thet Pyae Sone Aung
675
Share template with others
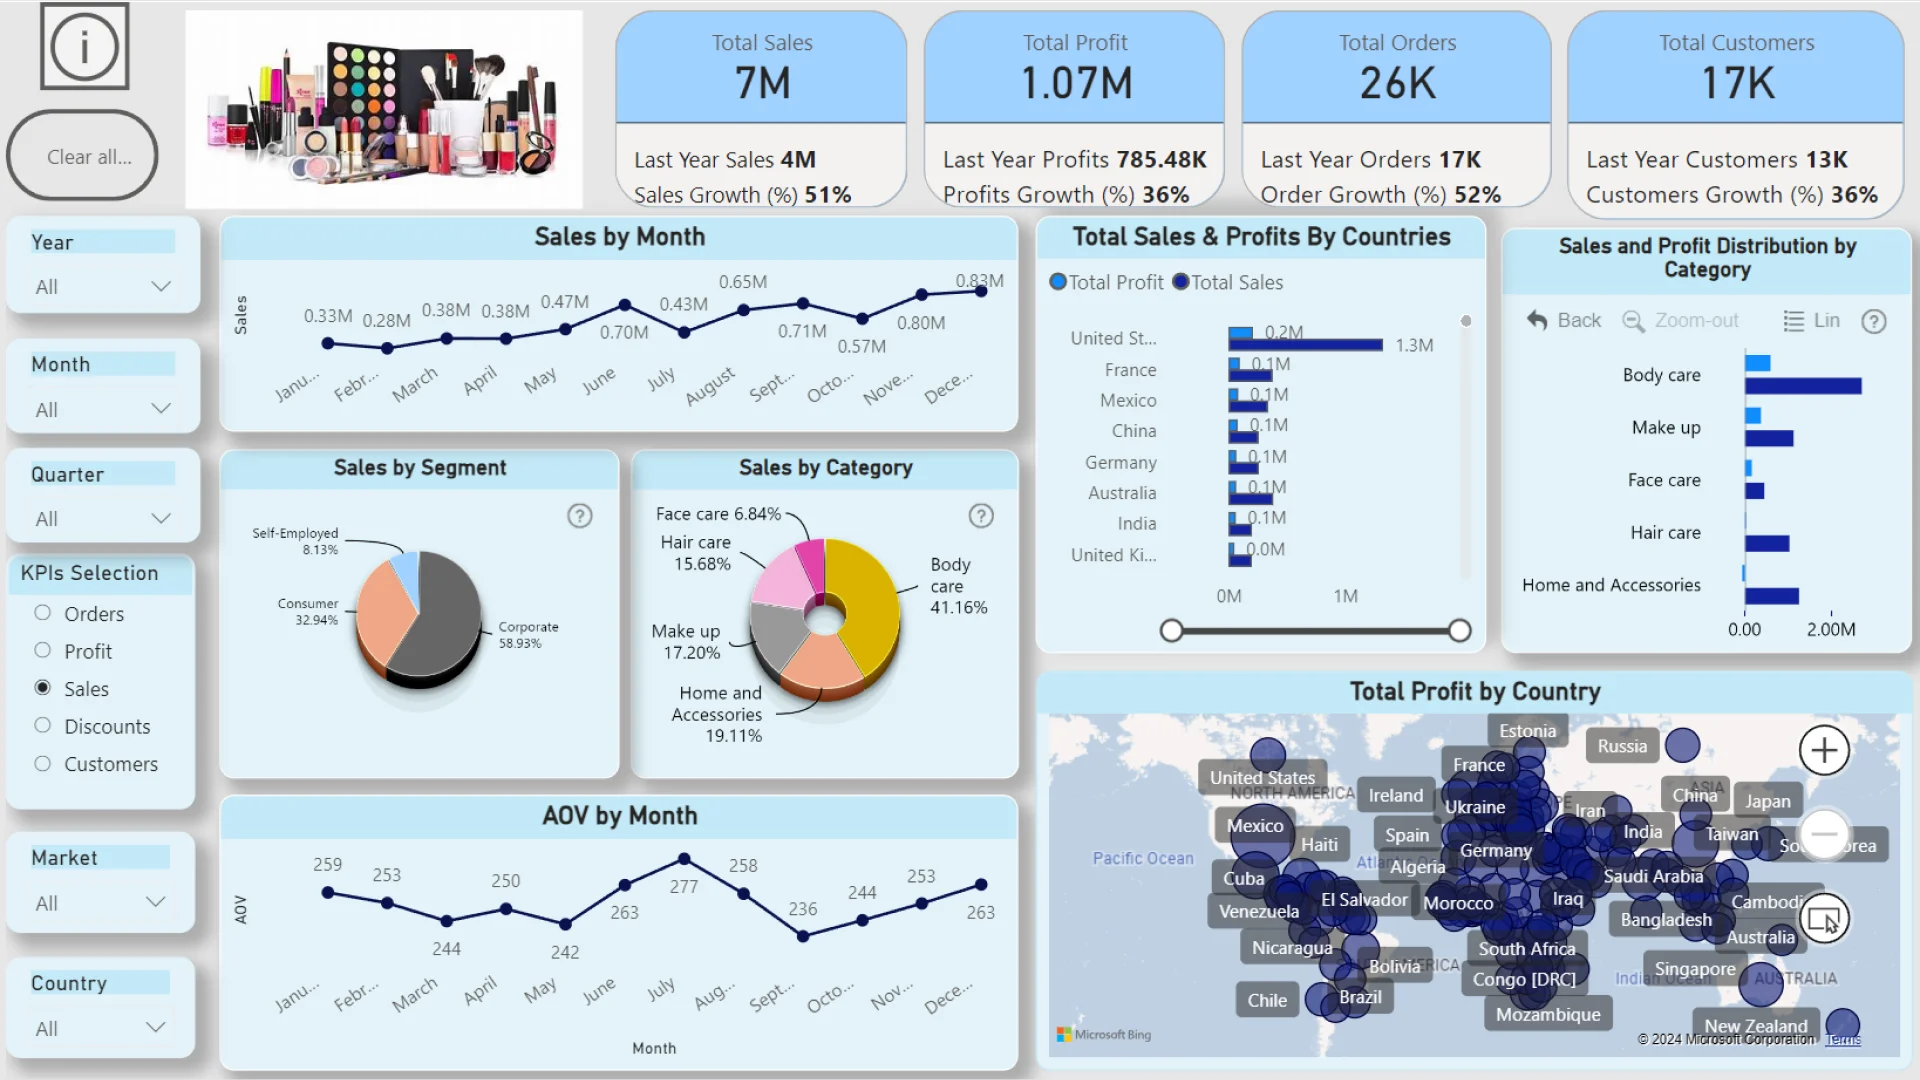
Report submitted for FP20 Analytics ZoomCharts Challenge 19 (September 2024). The report was built with the E-commerce KPI Analysis dataset and includes ZoomCharts custom Drill Down PRO visuals for Power BI.
Author's description:
This dashboard provides a comprehensive analysis of sales volumes and profitability across various product groups and markets, with a focus on key performance indicators (KPIs) essential to the success of the e-store. The dashboard is designed to help the business achieve specific targets, including an annual profit margin of 36%, 51% annual overall sales growth (with a higher target of 59% for the corporate segment), and at least $400K in annual sales for each market.
ZoomCharts visuals used
4U Report Challenges
Participate in data challenges, build and submit reports to get free template downloads.
Join CommunityMobile view allows you to interact with the report. To Download the template please switch to desktop view.
Was this helpful? Thank you for your feedback!
Sorry about that.
How can we improve it?