1488
ECommerce Sales Dashboard by Abhijeet Pathak
ECommerce Sales Dashboard by Abhijeet Pathak
More Report pages
Report Author: Abhijeet Pathak
1488
Share template with others
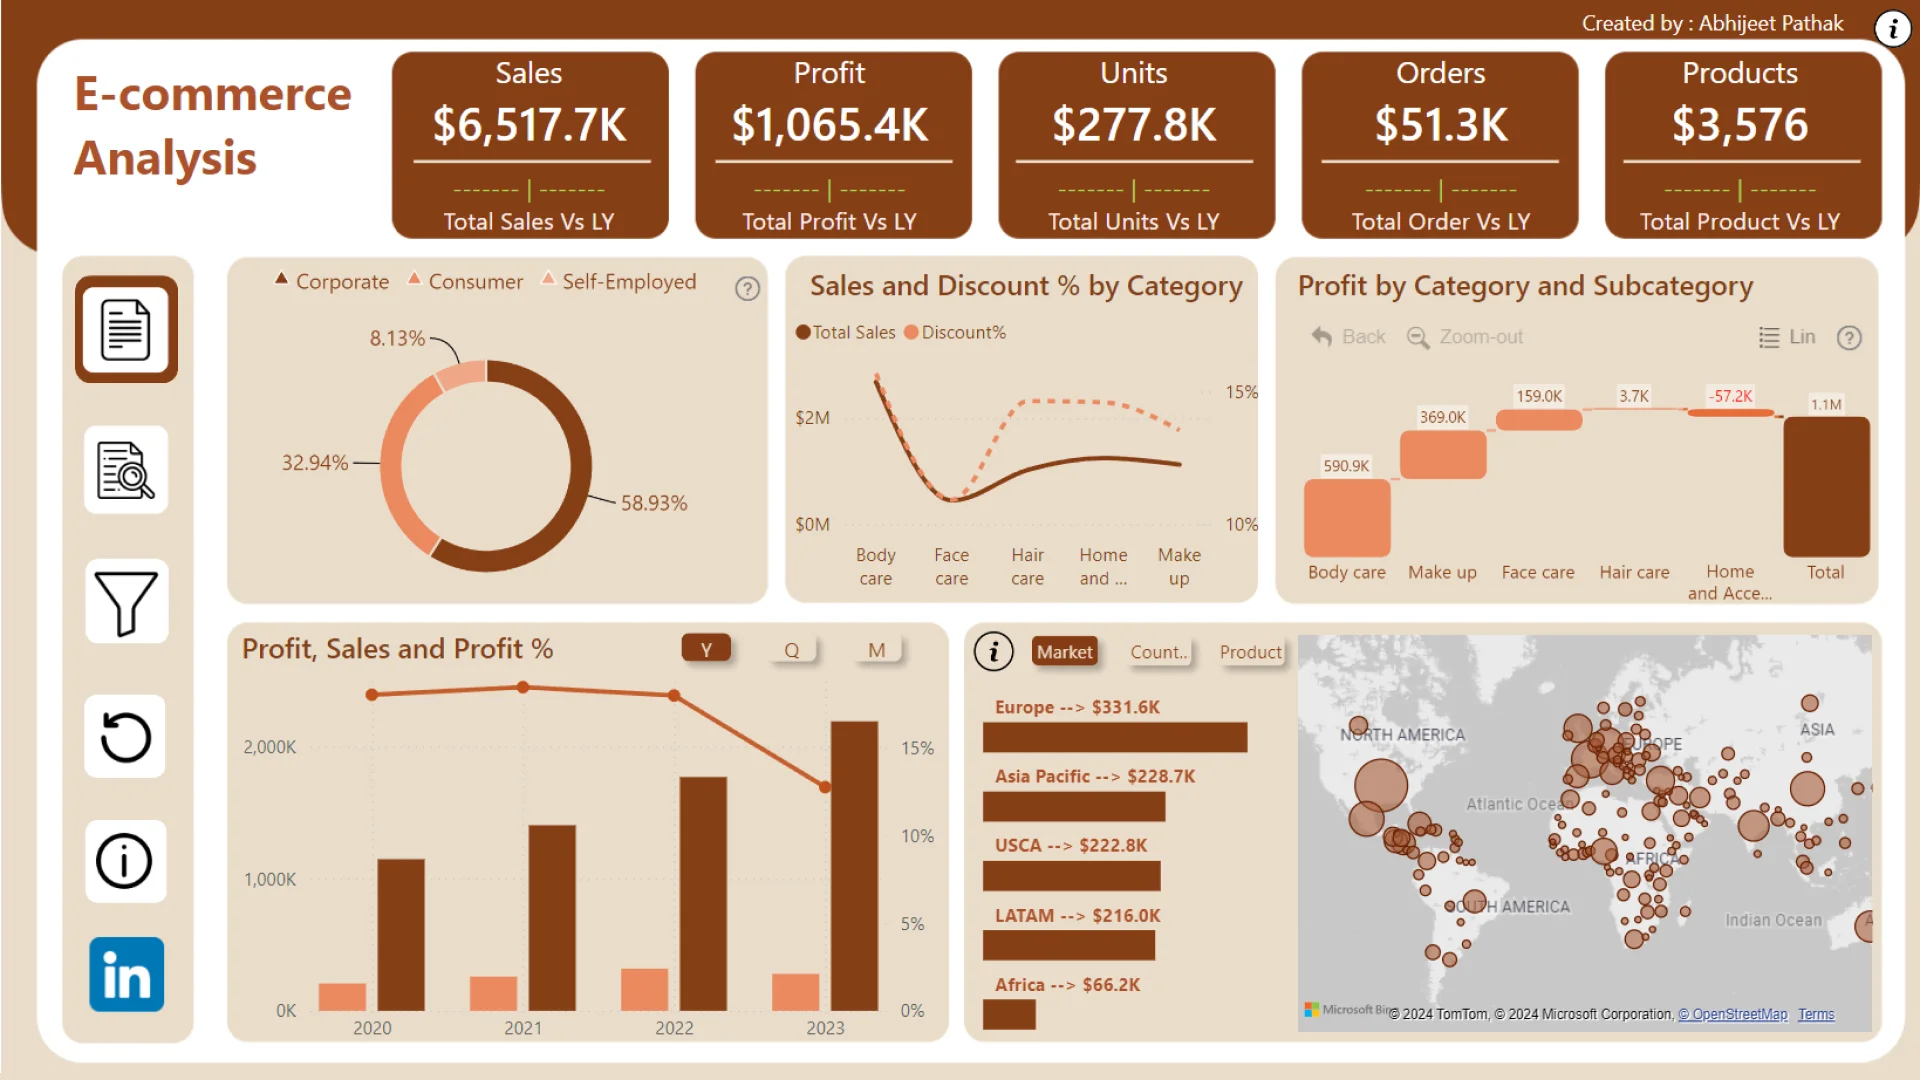
Report submitted for FP20 Analytics ZoomCharts Challenge 19 (September 2024). The report was built with the E-commerce KPI Analysis dataset and includes ZoomCharts custom Drill Down PRO visuals for Power BI.
Author's description:
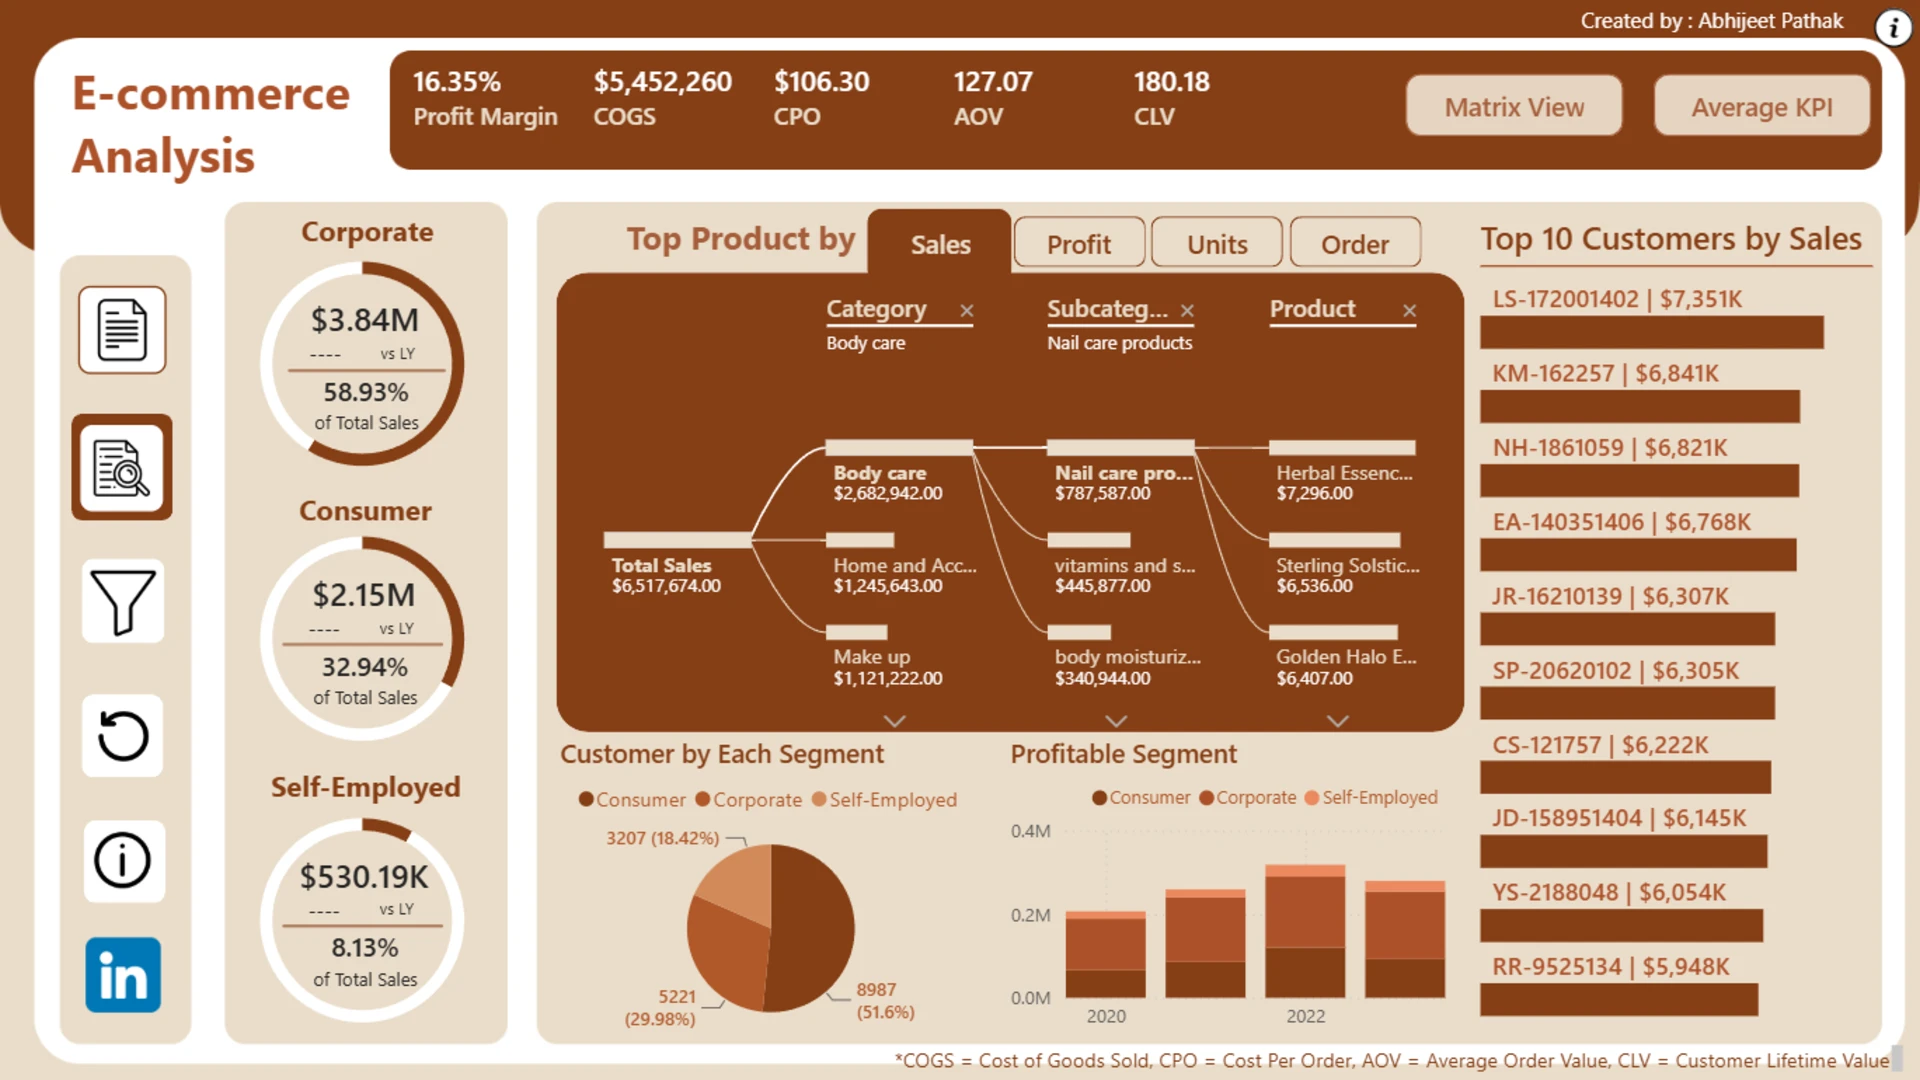
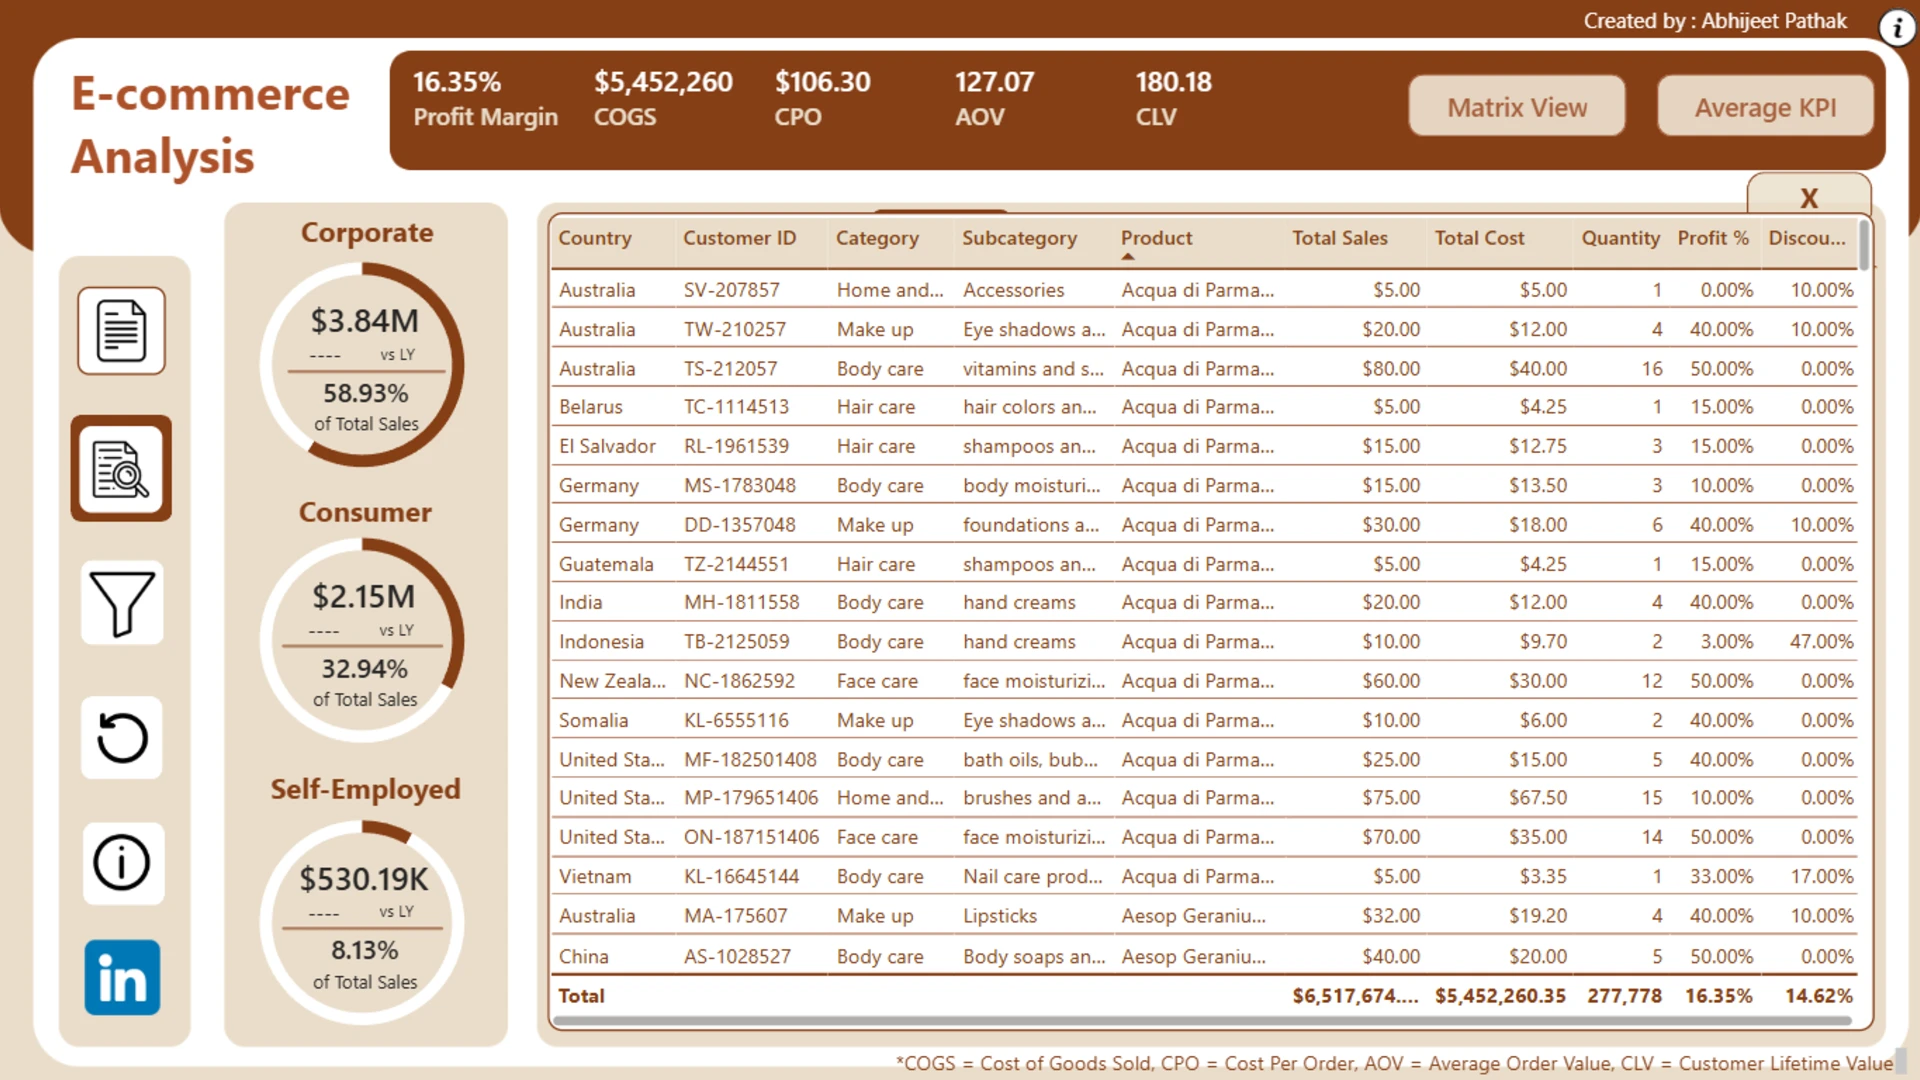
The report analyzes global sales data for a skincare and beauty store, covering various countries, customer segments, and product categories. It highlights key performance indicators (KPIs) and includes detailed visualizations such as segmental and category sales charts, discount metrics, and profitable region analysis. Additionally, the report provides insights through tools like a global profit visual with customized tooltips, a decomposition tree for top products, and an in-depth customer segment analysis. It also features a matrix/table view and average analysis, offering a comprehensive breakdown of sales and profit contributions across regions and segments.


4U Report Challenges
Participate in data challenges, build and submit reports to get free template downloads.
Join CommunityMobile view allows you to interact with the report. To Download the template please switch to desktop view.
How to use a PBIX template
Preview the interactive report, download the PBIX file, open it in Power BI Desktop, and replace the same data connection with your own dataset.
Preview and download
Explore the report online and download the PBIX template file.
Open in Power BI Desktop
Open the downloaded PBIX file in Power BI Desktop.
Connect your data
Replace the sample data source with your own dataset.
Refresh and adjust
Refresh the model and update fields or visual were needed.
Save and share
Save your report and publish it for your audience.


