logo
For Power BI
  • Products
    • Custom Visuals for Power BI
    • Report Templates
  • Resources

      Resources

    • Documentation
    • Report Examples
    • Blog
    • Webinars
    • Video Tutorials
    • Visuals Gallery

    Support

    • ZoomCharts Assistance
    • Contact Sales
    • Contact Support
    • FAQ

    Challenges

    Challenges

    Improve your report creation skills by participating in free challenges for report creators.

    Learn more
    Get Developer License
  • Services
    • Power BI Report Development
    • Custom Visual Development
  • Challenges
  • Pricing
    • Custom Visuals for Power BI
    • Report Templates
Subscribe
Subscribe
Get it now
Go back

Contents

Contest logo
Contest logo
Contest logo
Contest logo
Try Free Now
Go back

FP20 Analytics September 2024 Challenge

Report Author: Pratik Yallapragada

20

Report by Pratik Yallapragada

Report
Report Interact

Combo Timeline Map Donut Ecommerce Sales

Share template with others

Report submitted for FP20 Analytics ZoomCharts Challenge 19 (September 2024). The report was built with the E-commerce KPI Analysis dataset and includes ZoomCharts custom Drill Down PRO visuals for Power BI.  

Author's description: 
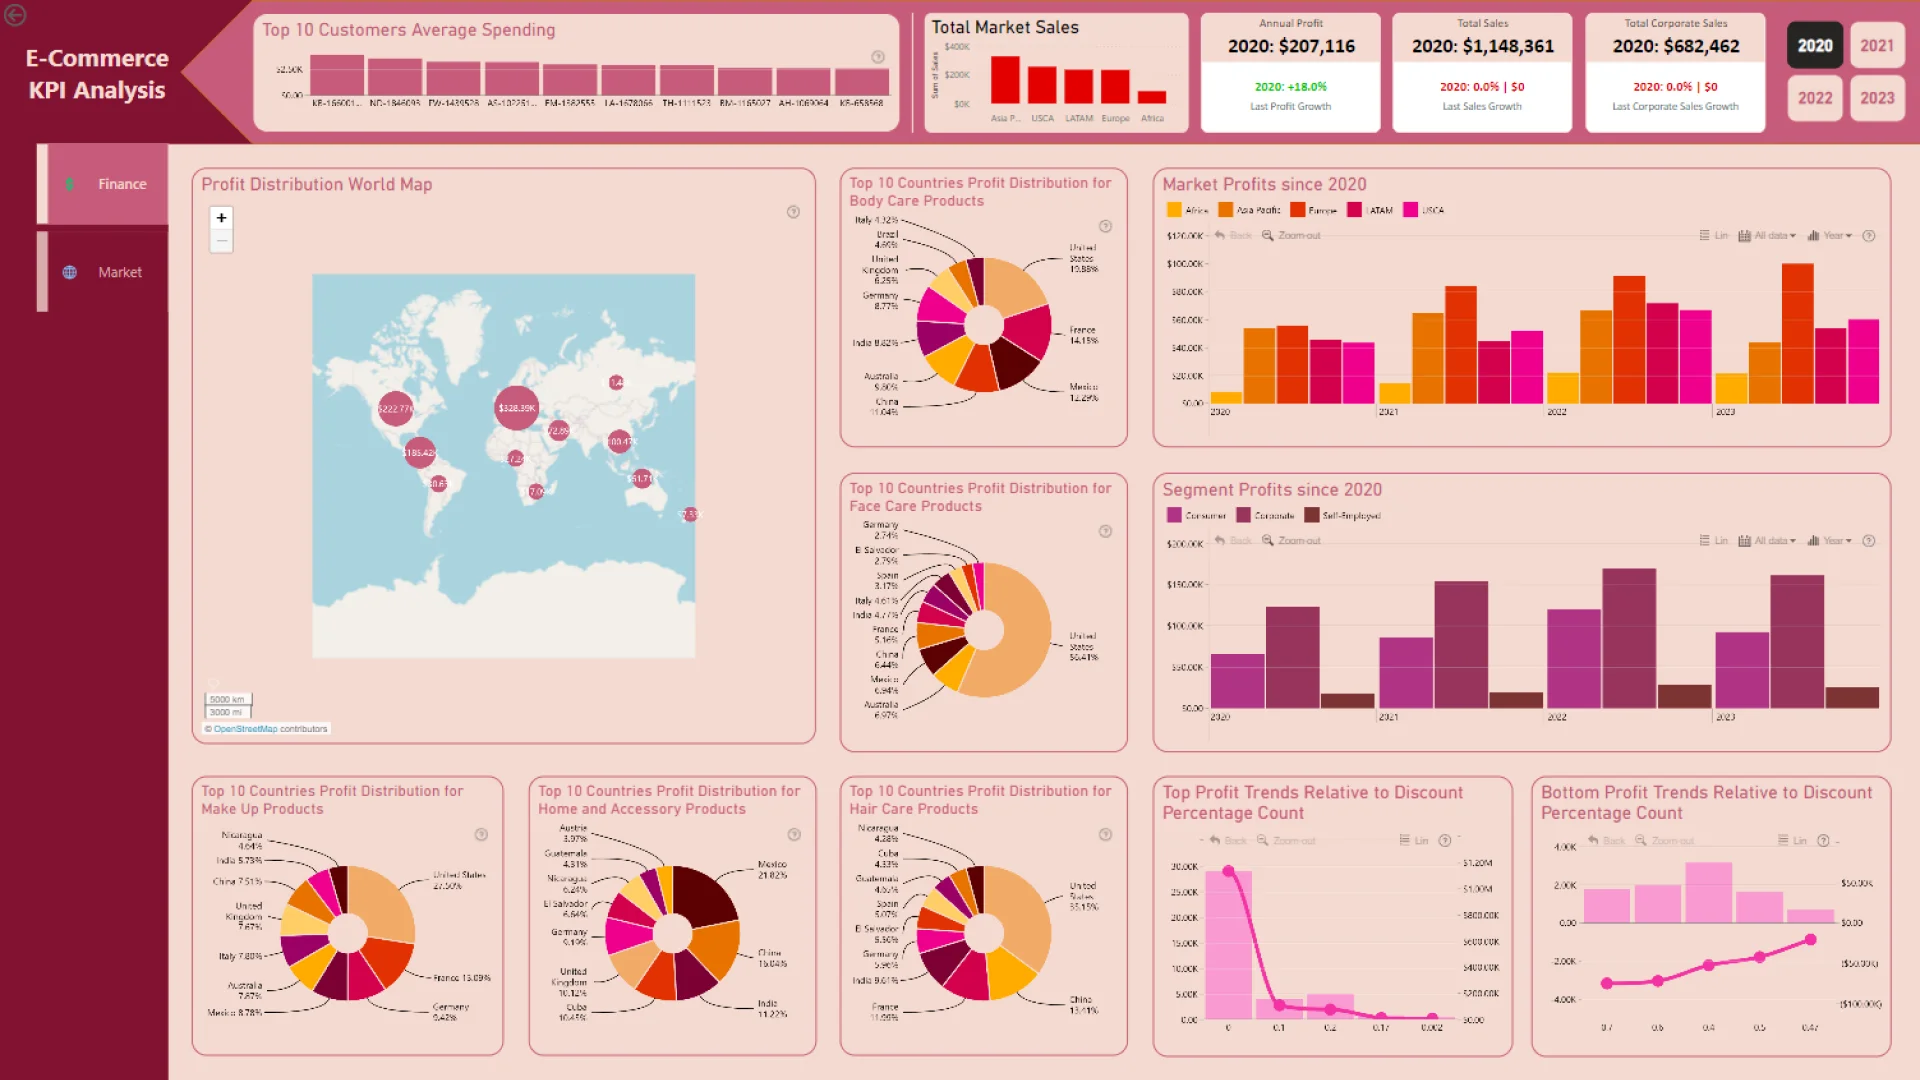
Both dashboards show: Annual Profit Growth Total Sales Growth Total Corporate Sales Growth Total Sales per Market. 

Key Findings: 2020, 2021, and 2023 had a profit margin above 15% with 2021 having the greatest profit margin at 18.5%. 

All years showed a total sales growth from the previous year above or equal to 20% with 2023 having the highest dollar growth amount at $421,897 and 2022 having the highest percentage growth at 26.0%
No years showed a total sales growth from the previous year above or equal to 30% with 2023 having the highest dollar growth amount at $253,042 and 2022 having the highest percentage growth at 26.6% 
4/5 of the global markets reach an amount above or equal to $400k by 2023, with the highest market being Asia Pacific at $606,179 and the lowest being LATAM at $434,586. The Africa market remains at $163,624. 

On my finance dashboard, I focused on: Top 10 Customers Average Spending Profit Distribution in World Map Country Profit Distribution by Category Market Profits since 2020 Segments Profits since 2020 Discount Percentage Count Relative to Profit Trends 

Key Findings:
- The top 10 customers spent between $3.82K and $2.55K, with 2 from the US.

- Central US, Western Europe, and Central America dominate in profit.
- US leads profit in all categories except Home and Accessories, where Mexico dominates.
- A correlation exists between low discounts (0%-20%) and higher profits. 

On my market dashboard, I focused on: Segment Quantity Trends Best Seller of Categories/Subcategories/Products since 2020 Top 10 Highest Spending Customers in each Country Market Profit/Sales Distribution Market Categories/Subcategories/Products Profit/Sales since 2020 

Key Findings:
- Body Care is the best-selling category (2K products), while Face Care is the lowest (231 products).

- The Herbal Essence Bio product leads with 2K units sold.
- US customers consistently spend the most.
- Profit trends slowed or decreased in 2022, despite sales growth. 

A big thank you to @FP20Analytics, Federico Pastor, and @ZoomCharts for the fantastic opportunity, insightful webinar, and powerful visualization tools that helped make this report more interactive and engaging! 

#DataAnalytics #FP20Challenge #PowerBI #ZoomCharts 

ZoomCharts visuals used

Drill Down Donut PRO (Pin) Drill Down Donut PRO (Pin)
Drill Down Combo PRO Drill Down Combo PRO
Drill Down Map PRO Drill Down Map PRO
Drill Down Timeline PRO Drill Down Timeline PRO

Need help?

Send your question to ZoomCharts assistant, and we will respond to you as soon as possible.

Contact Us

Mobile view allows you to interact with the report. To Download the template please switch to desktop view.

Report Overhaul

ZoomCharts Academy

Learn ZoomCharts with experts and become certified!

Go to Academy!
Report Overhaul

Was this helpful? Thank you for your feedback!

Sorry about that.

How can we improve it?

Report by Pratik Yallapragada

Share

ZoomCharts

Welcome to ZoomCharts

You’re almost there! Create an account to keep your saved reports.

or
Sign up with Microsoft

Verify your email address

We have sent a code to your email address. Please input the code below.

Didn't receive code? Request again (after 30 seconds)

Already have an account? Log in

ZoomCharts

Log in to your ZoomCharts account

Log in with Microsoft
or
Forgot password?

Reset your password

We'll email you instructions on how to reset your password

Don't have an account? Sign up

Please add credits

You have 0 available downloads.
Get more credits or upgrade your plan to continue.

View pricing
logo
[email protected]
+44 204 577 3993
logo

Products

Drill Down Network PRO Drill Down Waterfall PRO Drill Down Graph PRO Drill Down Combo PRO Drill Down Combo Bar PRO Drill Down Donut PRO Drill Down Pie PRO Drill Down TimeSeries PRO Drill Down Timeline PRO Drill Down Map PRO Drill Down Scatter PRO All Visuals

Resources

Report Examples Webinars Blog ZoomCharts Academy Visuals Gallery Documentation Custom Visual Development Subscribe to News

Solutions

Custom Visual Development

Company

Pricing About Us Partners Leave feedback Join PowerGroup EU Funding

Help

ZoomCharts Assistance Contact Sales Contact Support FAQ

Drill Down Network PRO Drill Down Waterfall PRO Drill Down Graph PRO Drill Down Combo PRO Drill Down Combo Bar PRO Drill Down Donut PRO Drill Down Pie PRO Drill Down TimeSeries PRO Drill Down Timeline PRO Drill Down Map PRO Drill Down Scatter PRO All Visuals

Report Examples Webinars Blog ZoomCharts Academy Visuals Gallery Documentation Custom Visual Development Subscribe to News

Custom Visual Development

Pricing About Us Partners Leave feedback Join PowerGroup EU Funding

ZoomCharts Assistance Contact Sales Contact Support FAQ
+44 204 577 3993
[email protected]

Ready to get in touch?

Contact our experts with any question about Power BI and ZoomCharts for Free!

Contact us

© 2025, Data Visualization Software Lab

U.S. Patents No. 11,645,343; 11,921,804; 12,346,389

Cookies
Privacy Policy
Global
Legal
Patent
warning

Error message

success

Success info: Done!

ZoomCharts AI Assistant

We noticed you're using an old OS version.

For the best experience, we recommend upgrading to ensure that all website features display correctly.

Cookie settings

We use necessary cookies for site functionality, as well as statistic, marketing, and preference cookies to enhance your experience. For more information and to manage your preferences, please visit our Cookie policy