977
Ecommerce KPI Analysis
Ecommerce KPI Analysis
More Report pages
Report Author: Muthu Krishnan
977
Share template with others
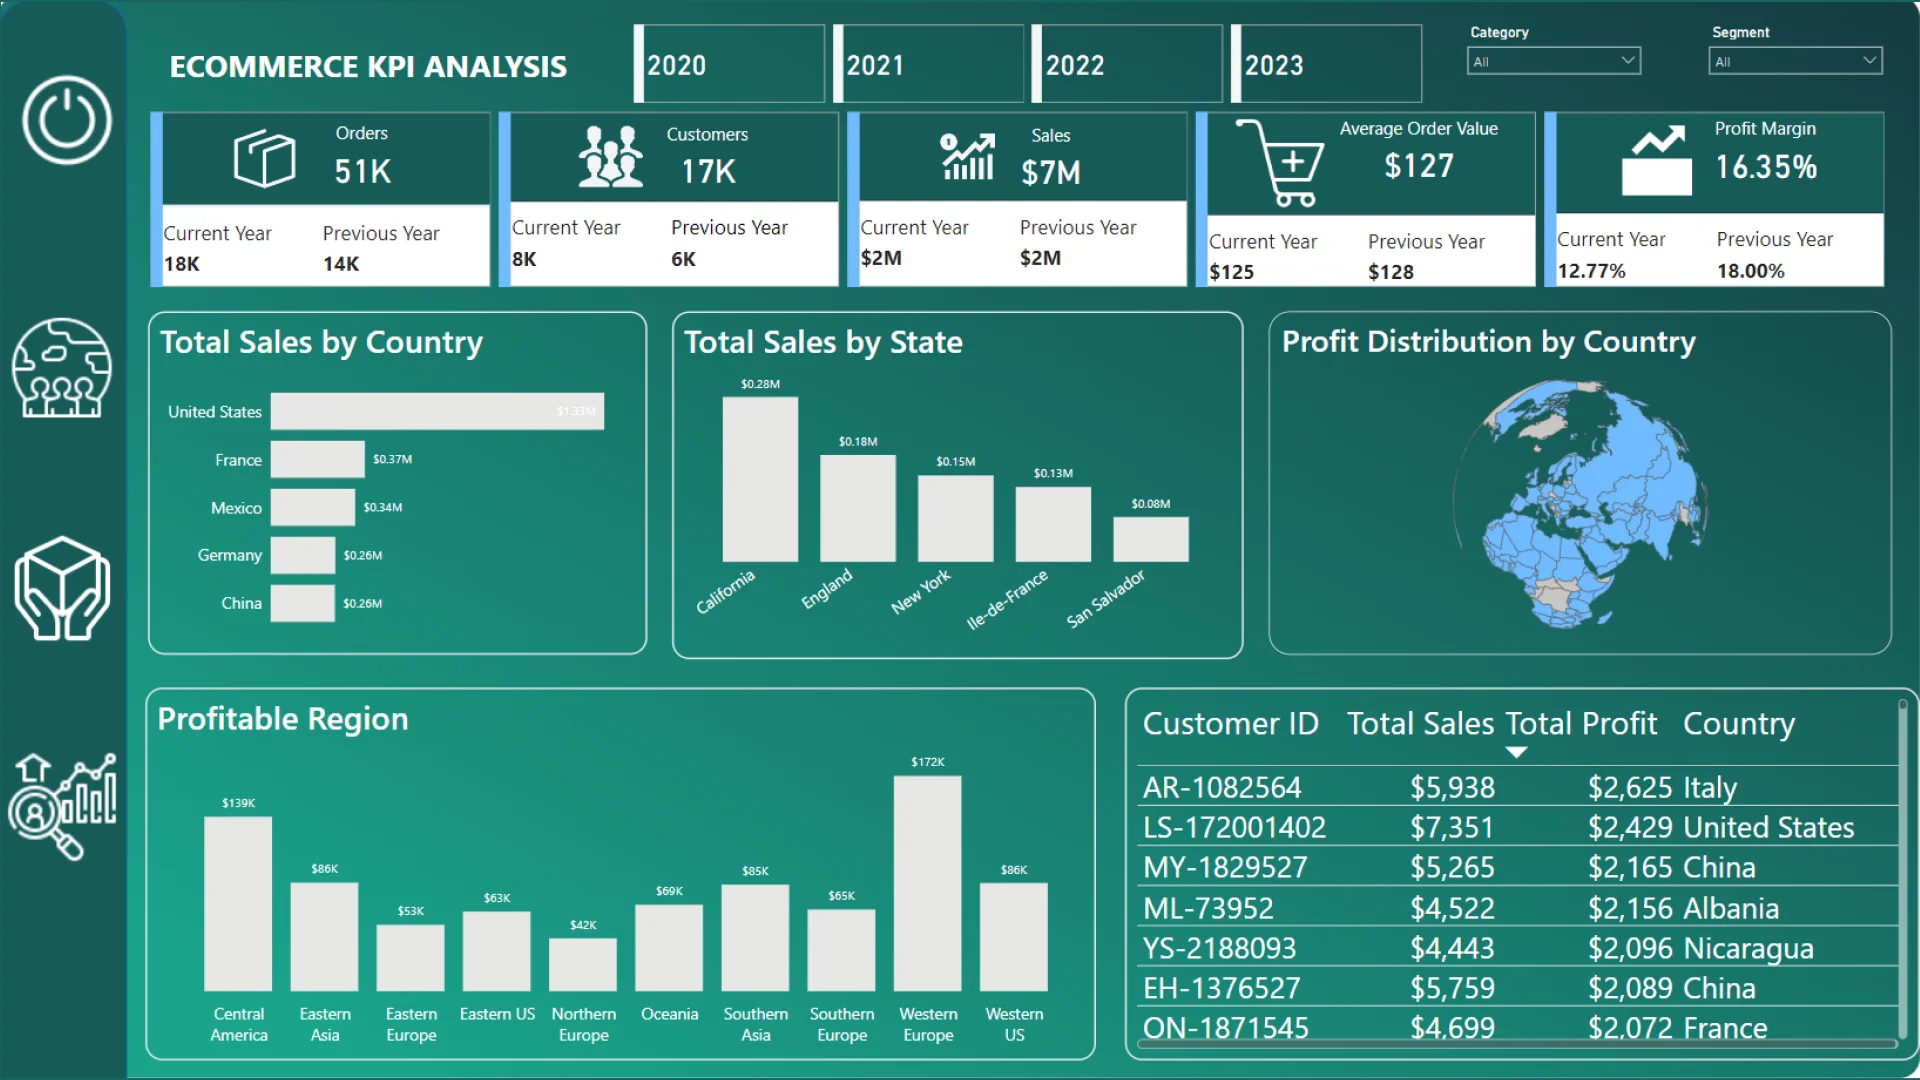
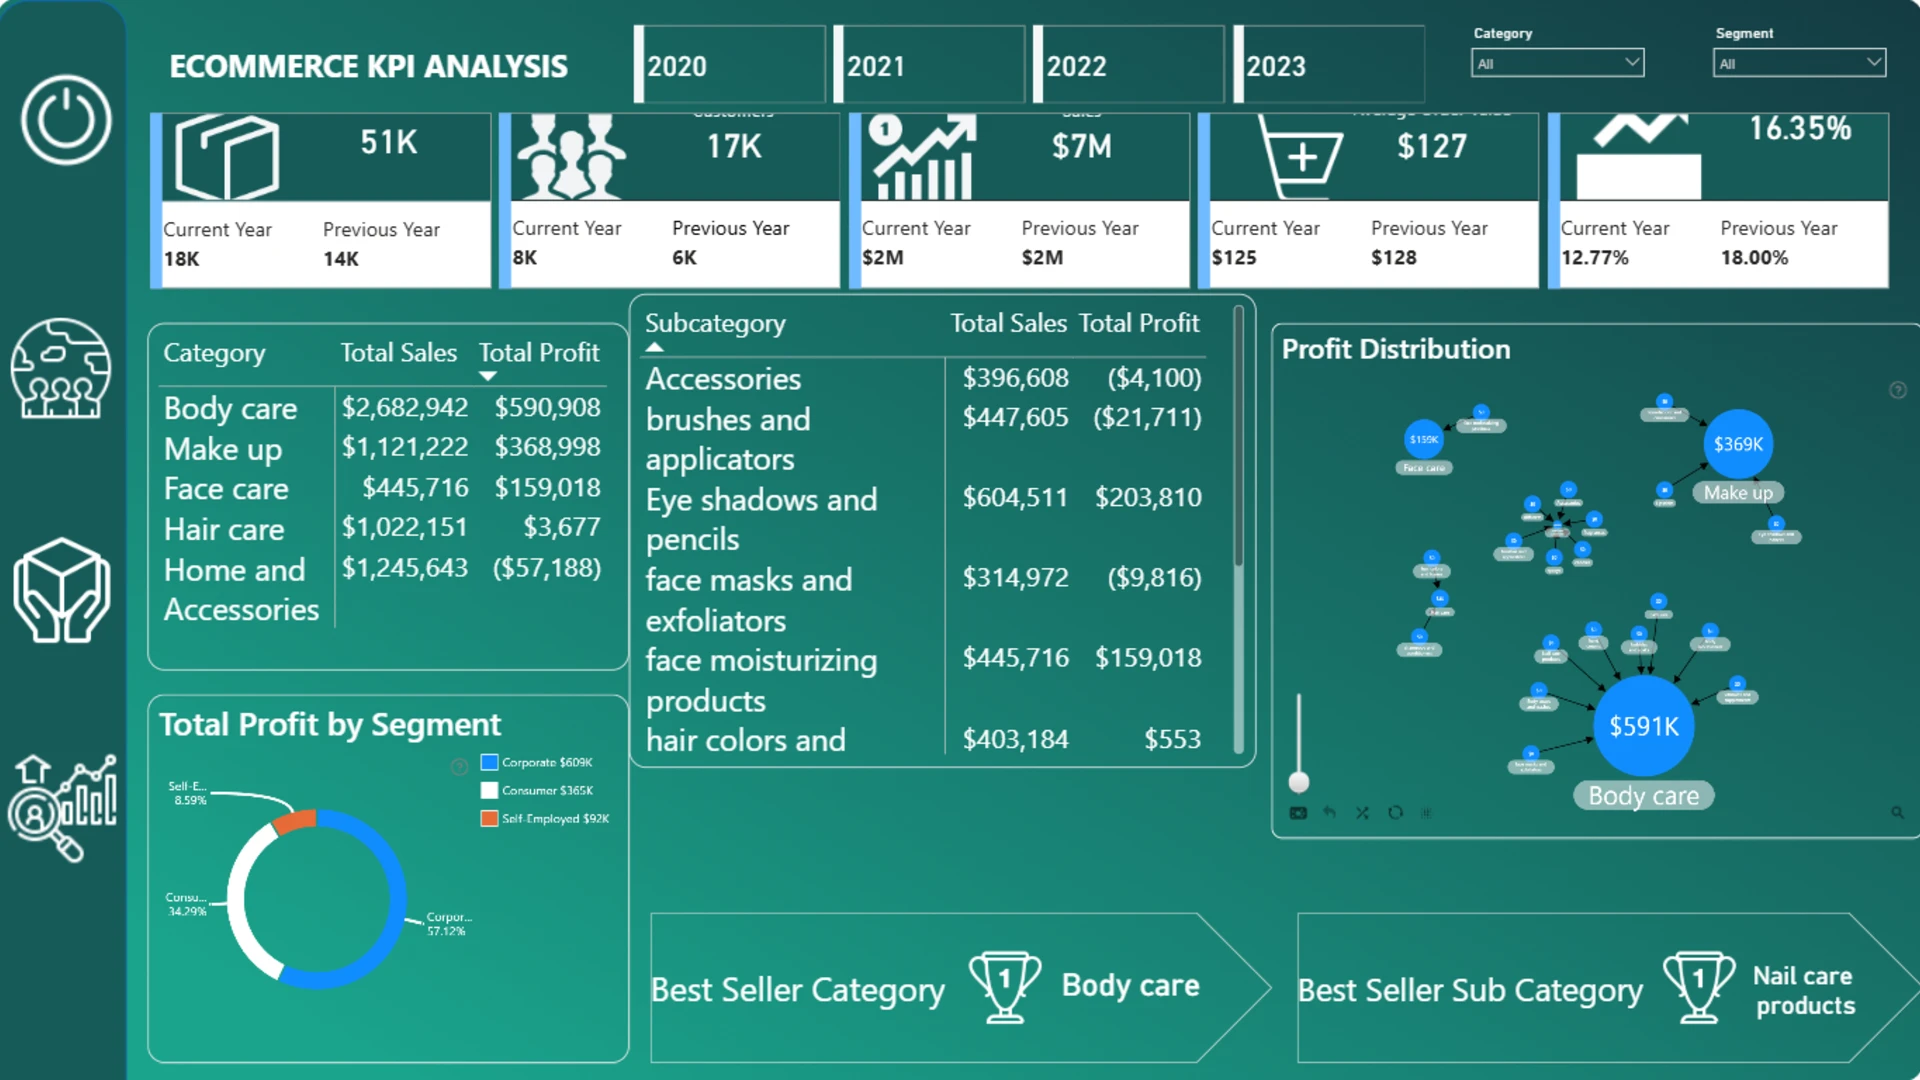
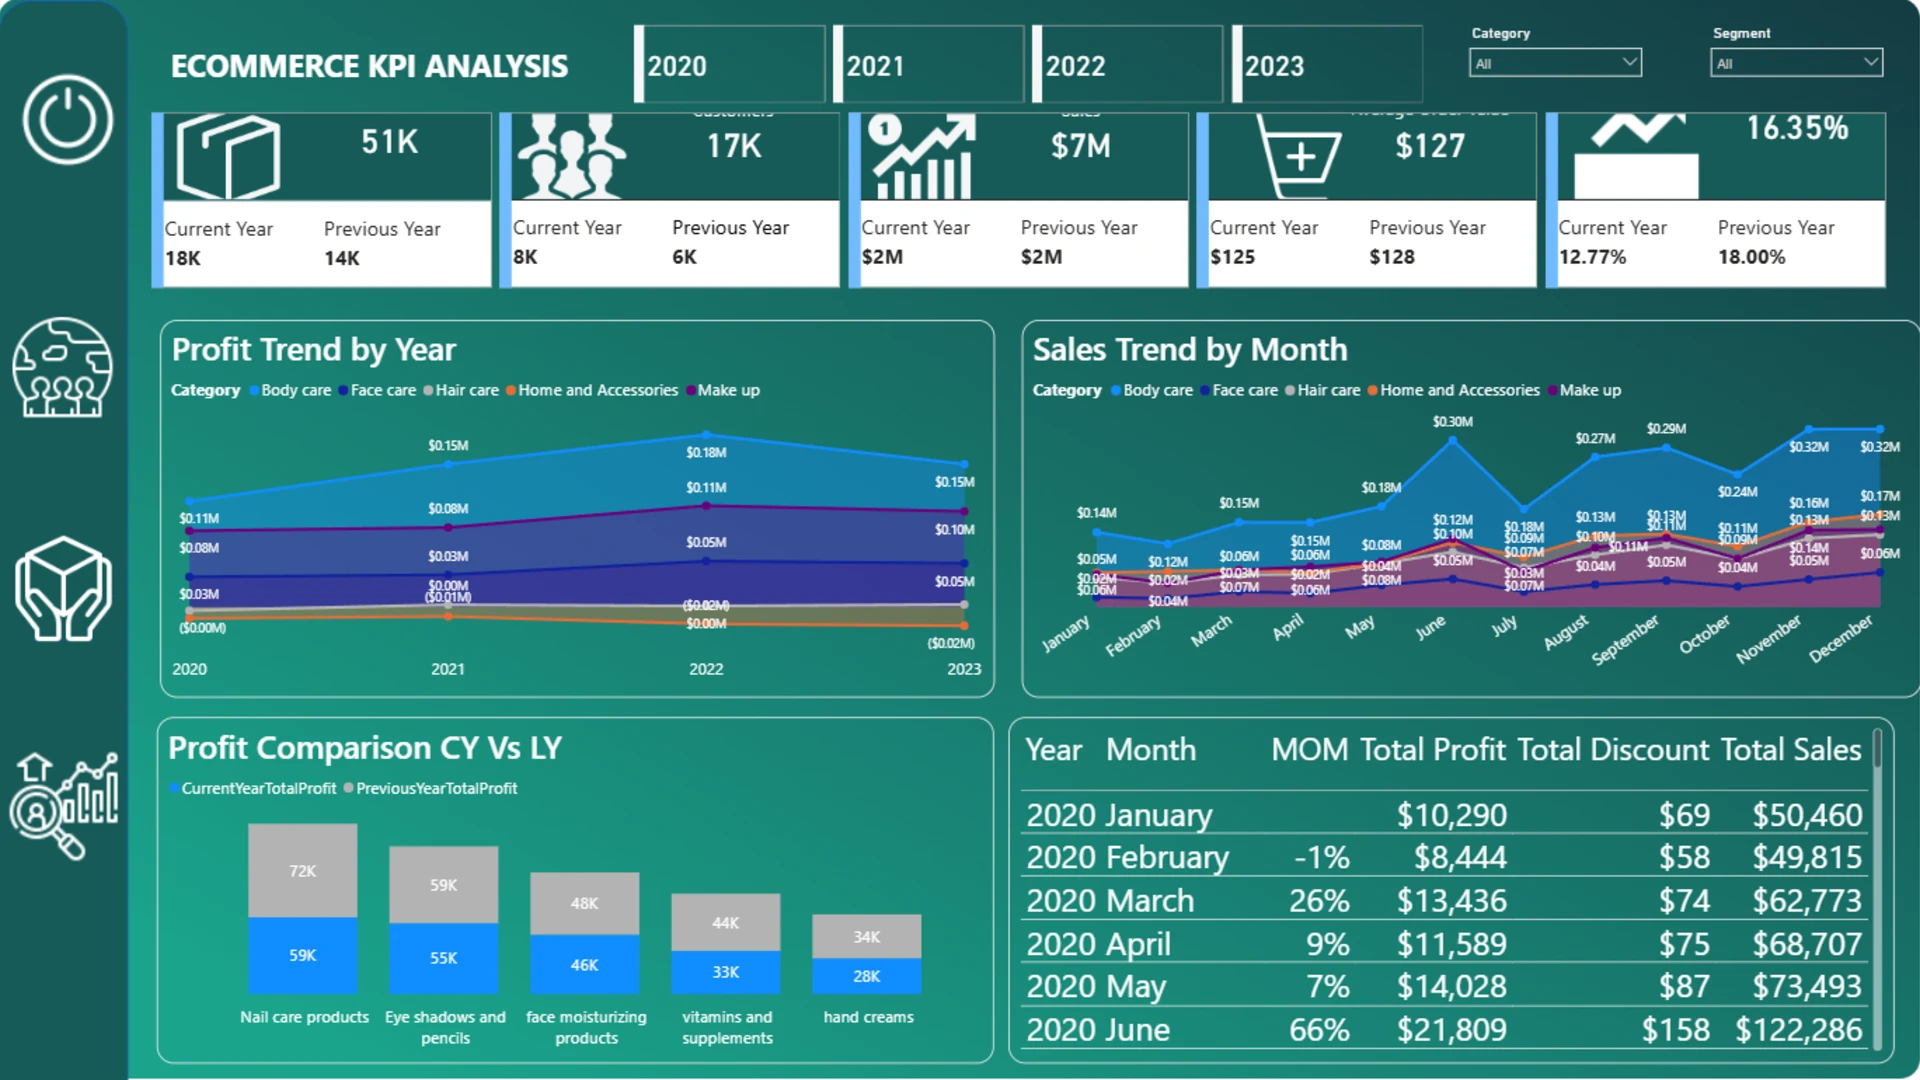
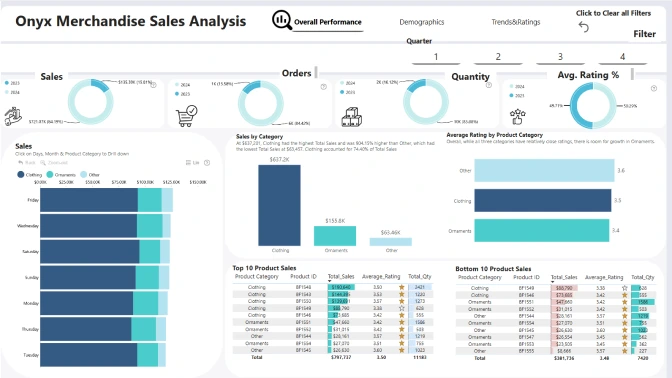
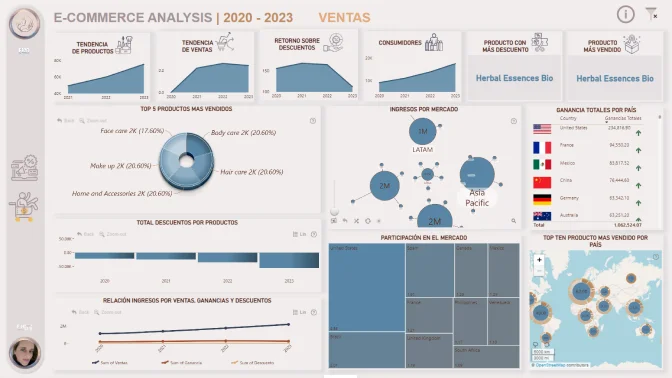
Report submitted for FP20 Analytics ZoomCharts Challenge 19 (September 2024). The report was built with the E-commerce KPI Analysis dataset and includes ZoomCharts custom Drill Down PRO visuals for Power BI.
Author's description:
Created a Power BI report for a global skincare and beauty e-store, analyzing an ordered dataset to assess sales volumes and profitability across various product groups and markets
4U Report Challenges
Participate in data challenges, build and submit reports to get free template downloads.
Join CommunityMobile view allows you to interact with the report. To Download the template please switch to desktop view.
Was this helpful? Thank you for your feedback!
Sorry about that.
How can we improve it?