800
E-commerce KPI 2
E-commerce KPI 2
Report Author: Muhammad Naveed Ziai
800
Share template with others
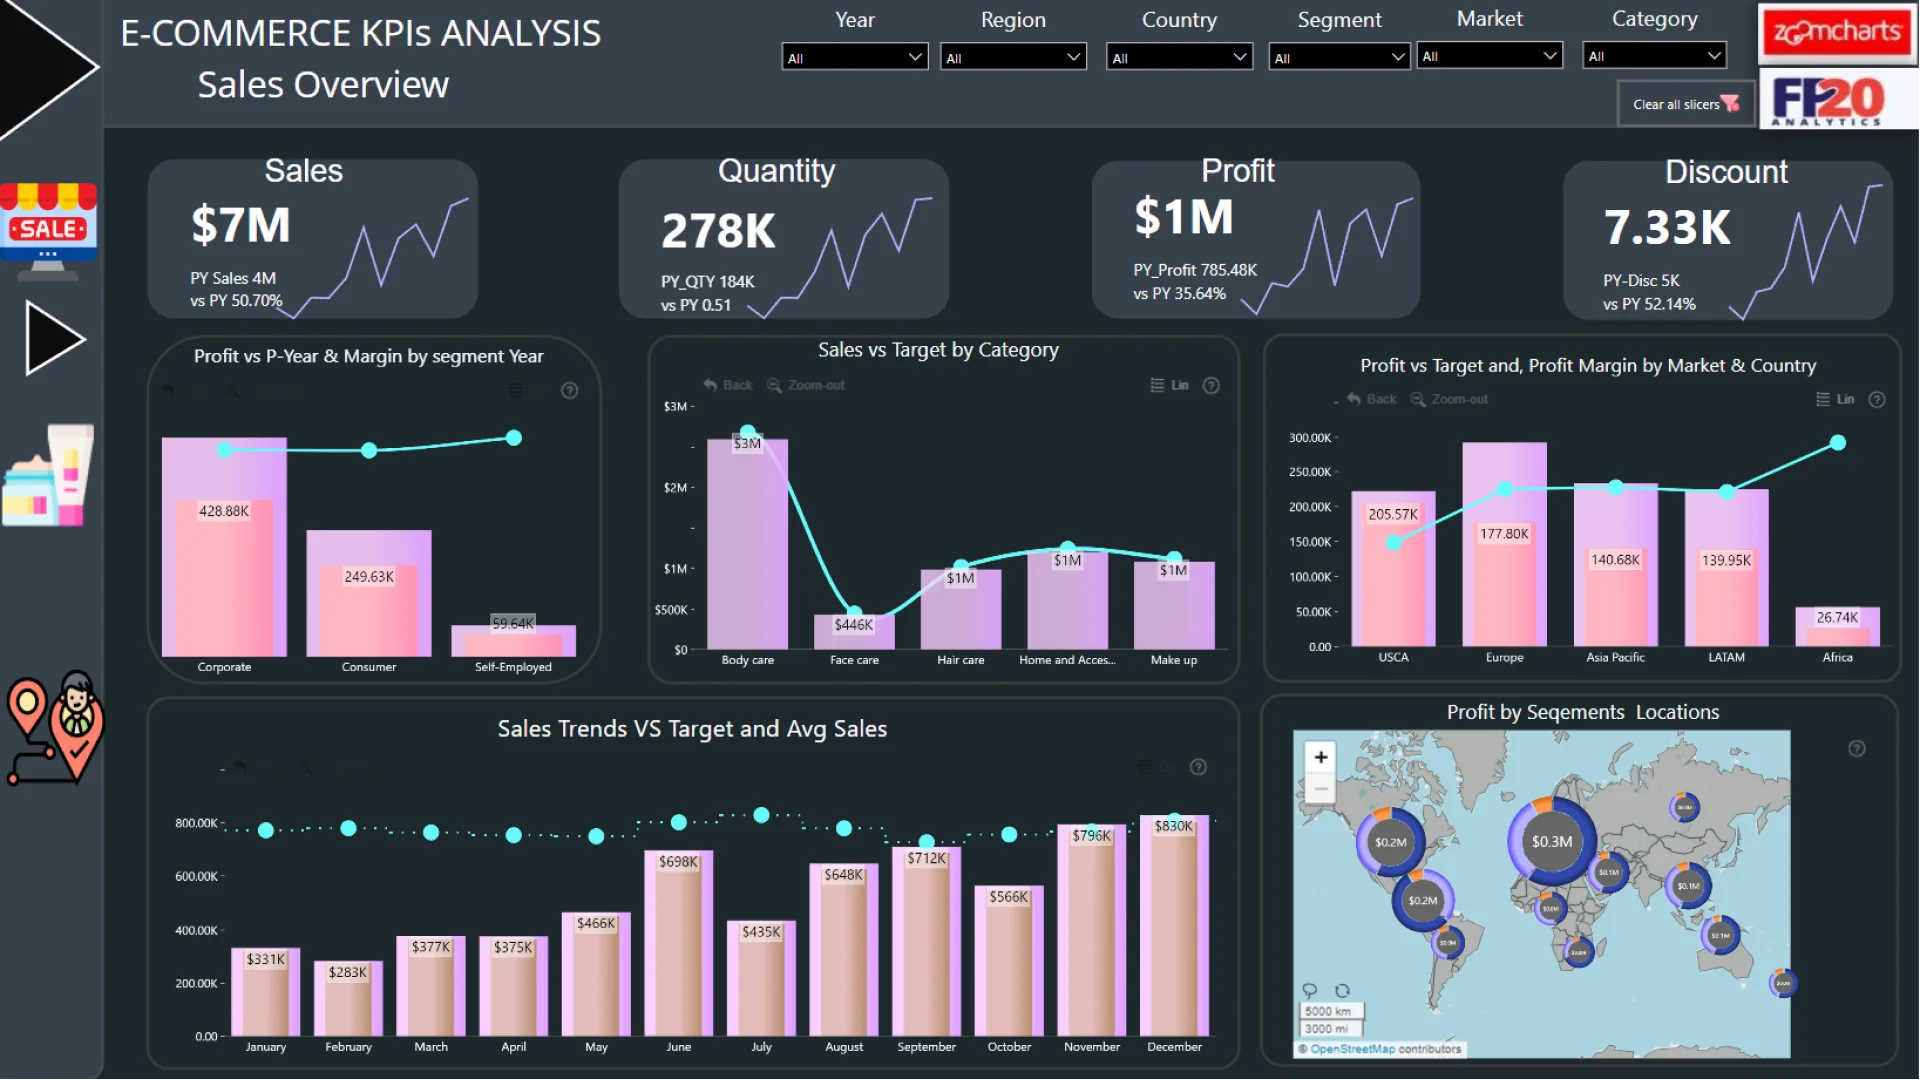
Report submitted for FP20 Analytics ZoomCharts Challenge 19 (September 2024). The report was built with the E-commerce KPI Analysis dataset and includes ZoomCharts custom Drill Down PRO visuals for Power BI.
Author's description:
I am participating in FP20 Analytics Challenge 19! I created a comprehensive Power BI dashboard for Aura, a prominent cosmetics brand, aimed at enhancing key performance metrics. The dashboard focuses on achieving:
• 15% annual profit margin across all product categories
• 20% overall annual sales growth, targeting 30% growth specifically in the corporate segment
• A minimum of $400K in annual sales for each market
ZoomCharts visuals used
4U Report Challenges
Participate in data challenges, build and submit reports to get free template downloads.
Join CommunityMobile view allows you to interact with the report. To Download the template please switch to desktop view.

Was this helpful? Thank you for your feedback!
Sorry about that.
How can we improve it?