Drill Down Bubble PRO for Microsoft Power BI
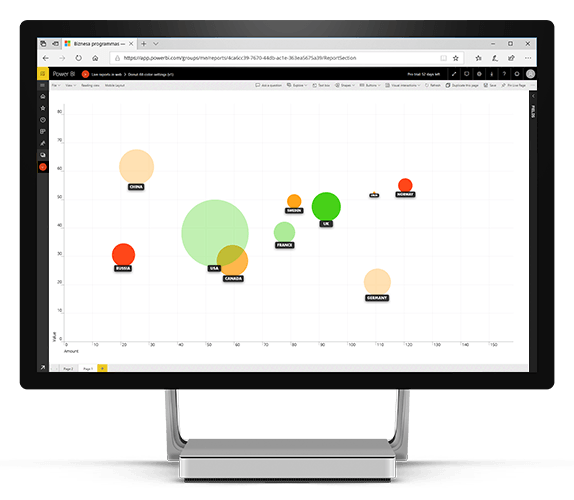
Coming in 2021
  • Dynamic, customizable agreggation
  • Customizable data point size
  • Rectangular selection
  • Zoom in / out
    And many more advanced features

Got an idea how to make the visual better?

We are always listening to users and paying serious attention to feature requests when planning our next release.

Suggest a feature

See other ZoomCharts custom visuals for Power BI

All ZoomCharts custom visuals for Microsoft Power BI are equipped with extensive drill-down features, customization options and cool-looking animations.

Blog

ZoomCharts Blog

Read practical guides and expert tips on how to get the most out of your Power BI visuals!

Everything You Need To Know About Power BI Bar Charts

Power BI bar charts are a simple and efficient way to show category-based data. Almost everyone has used a bar chart, which is why they've remained incredibly popular through the years. In this article, we will explore the many ways you can make Power BI bar charts even more powerful and use them to the max.

Read More

Feb 14, 2022

Power BI Donut Chart

The donut and pie charts are some of the most ubiquitous charts around. Instantly recognizable by people who have very little to do with charts, every report creator is bound to have to include a Power BI donut chart into a report at some point. This is not a commentary on whether you should love or hate donut charts, but rather a guide on getting the most out of donut and pie charts. Strap in tight, we're going to go over the whys, hows, do's and don'ts of Power BI donut charts.

Read More

Sep 04, 2022

Business Intelligence Implementation: A Complete Guide

It's no secret that the leading organizations of the world don't take any chances when it comes to business strategy - they use business intelligence to make data-driven decisions. Just like a sports team needs a coach or an army needs a strategist to achieve victory, your can reach your business goals more efficiently with the help of a robust BI system and expert BI analysts.

Read More

Aug 30, 2021

Top 5 Best Power BI Report Design Practices

First impressions matter, even when you're creating Power BI reports. When your users open your report for the first time, they need to be presented with good-looking visuals that present data in an easy-to-read way, otherwise they'll leave confused and with more questions than before.


Read More

Sep 07, 2022