Nov 17, 2026
11 Key Power BI Supply Chain Dashboard Examples and Templates for 2027
Explore 11 key Power BI supply chain dashboards for inventory, suppliers, logistics, quality and risk. Compare report designs, discover useful KPIs and find a PBIX template to adapt.
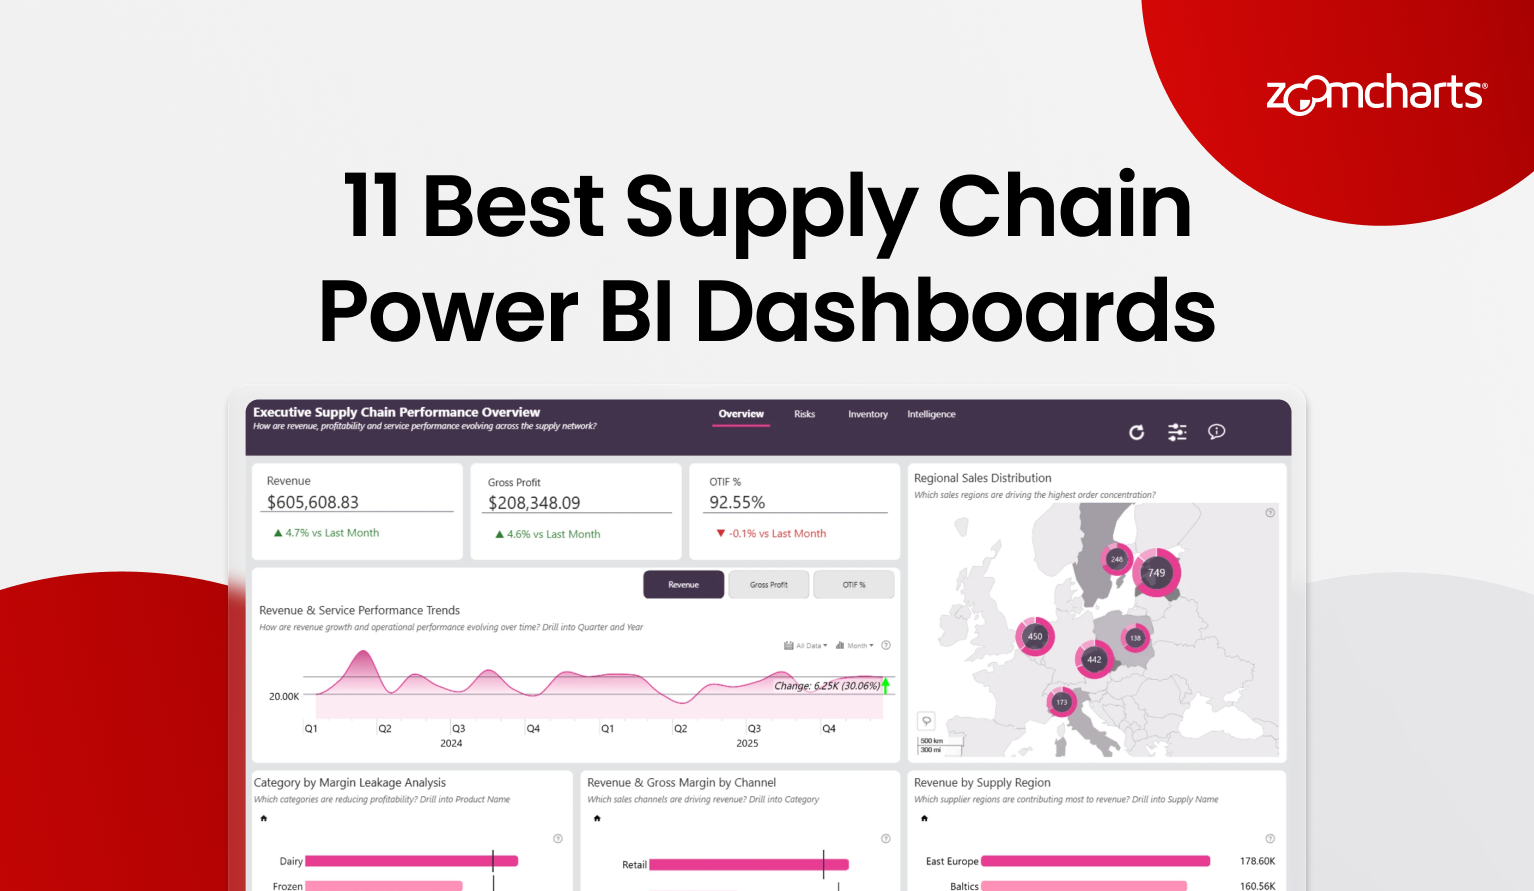
Explore 11 key Power BI supply chain dashboards for inventory, suppliers, logistics, quality and risk. Compare report designs, discover useful KPIs and find a PBIX template to adapt.
A supply chain dashboard has to do more than collect operational KPIs. It should help a reader move from a late delivery, stockout, cost increase, or quality issue to the supplier, warehouse, product, route, or period behind it.
The eleven Power BI examples below take different approaches to that job. Some provide an end-to-end command view. Others concentrate on retail, supplier reliability, product quality, inventory, or operational risk. Every example is a real report in the ZoomCharts Power BI Template Gallery, where you can preview the report and download its PBIX template.
1. End-to-End Supply Chain Power BI Dashboard
Best for: A broad executive and operations view across suppliers, inventory, service, waste, and financial performance
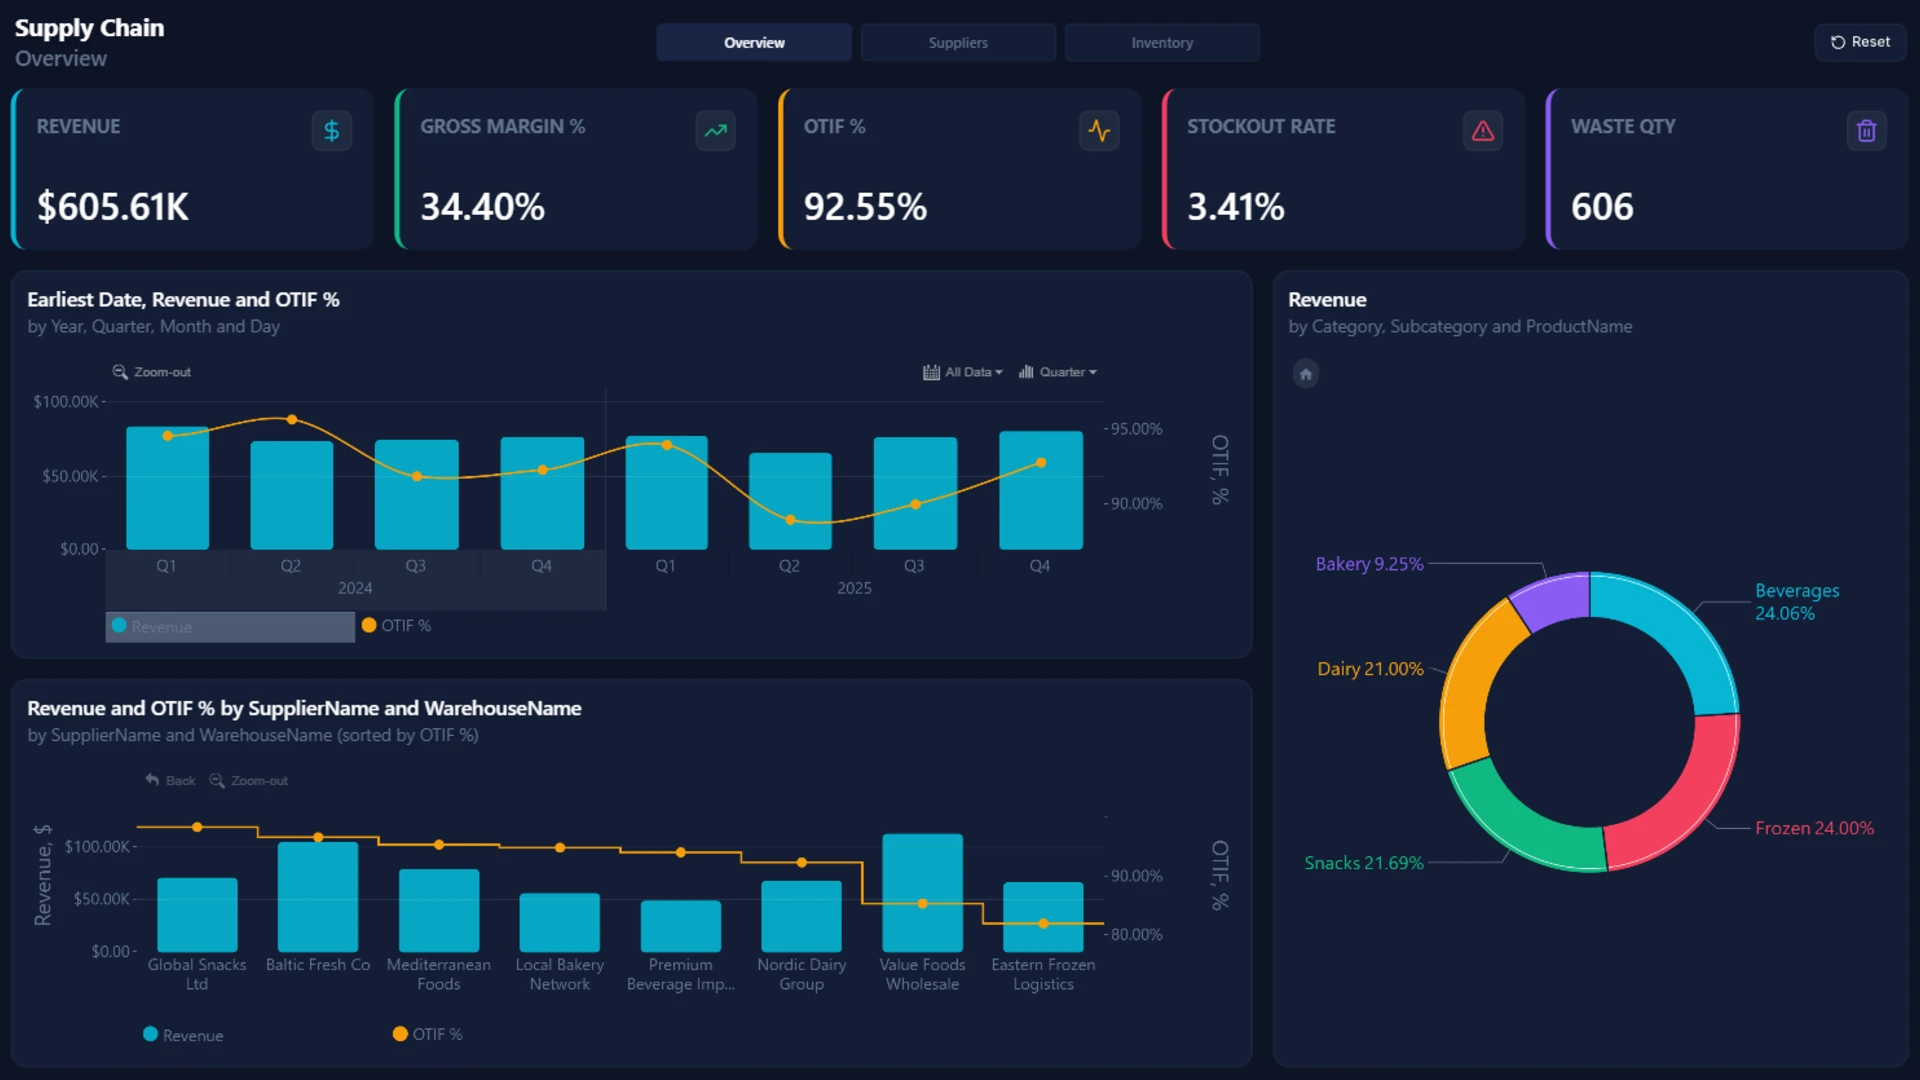
This nine-page ZoomCharts report is the most comprehensive template in the selection. Its views cover supply chain overview, supplier performance, inventory and stockouts, revenue and gross margin, waste and expired products, OTIF, and risk analysis by channel.
The KPI set connects operational health with commercial results. Revenue and gross margin sit alongside OTIF, stockout rate, waste quantity, expired inventory, supplier risk, late orders, reorder monitoring, and warehouse performance. Drill-down and cross-filtering let users move from yearly trends into monthly or daily detail and compare suppliers and warehouses.
Explore this dashboard template
Design idea to borrow: Use separate pages for distinct decisions, but keep KPI definitions, navigation, and visual language consistent across the report.
2. Power BI Retail Supply Chain Dashboard Example
Best for: Retail teams that need to examine sales results together with the operations supporting them
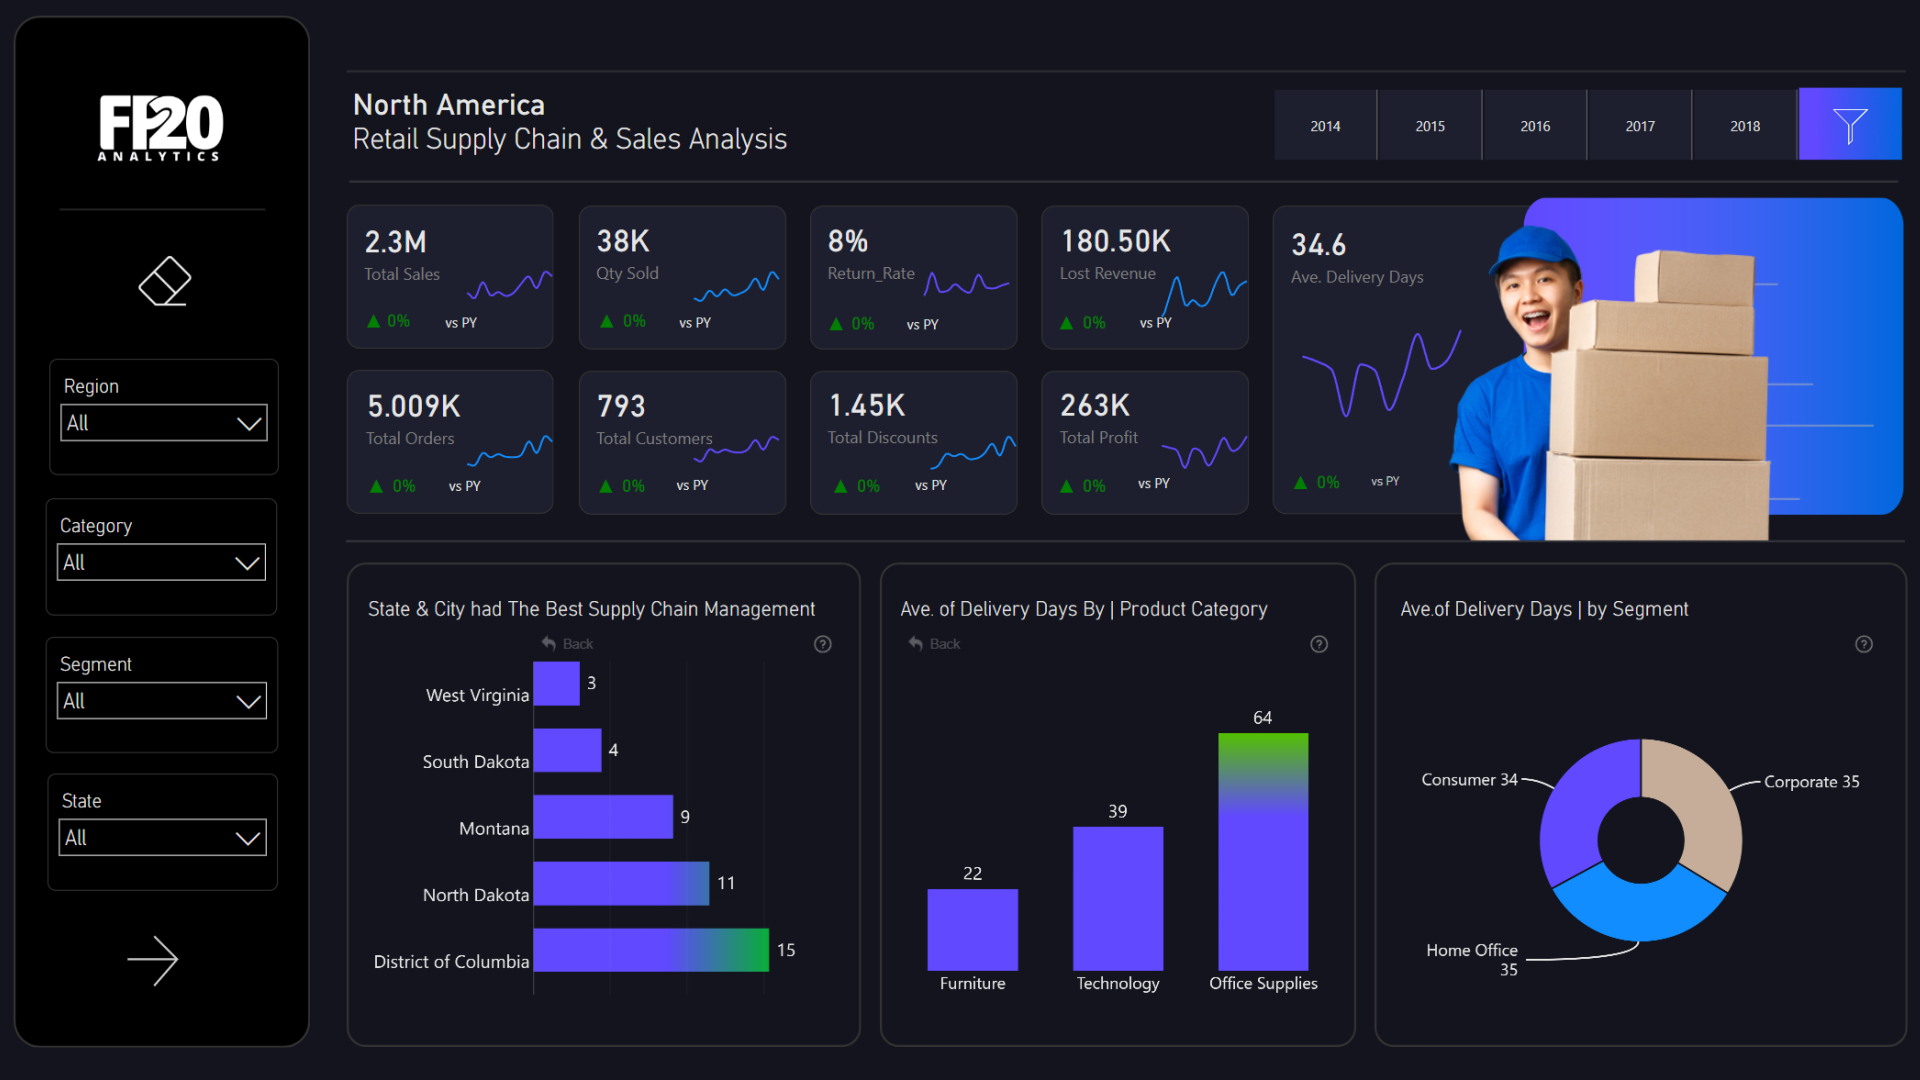
Created by Wejdan Alalawi, this two-page dashboard brings retail sales analysis and supply chain operations into one report. It supports comparisons across the available time periods and business dimensions, with active chart elements and filters for focused analysis.
The template uses Drill Down Combo, Combo Bar, and Donut PRO visuals. That mix is well suited to a report that has to show trends, category comparisons, and composition without separating the commercial and operational stories.
Explore this dashboard template
Design idea to borrow: Put demand and execution in the same analytical flow. A sales change becomes more useful when the reader can immediately inspect the operational context behind it.
3. Power BI Supply Chain Performance and Quality Dashboard
Best for: Manufacturing and supply chain teams that need a strong quality and production layer
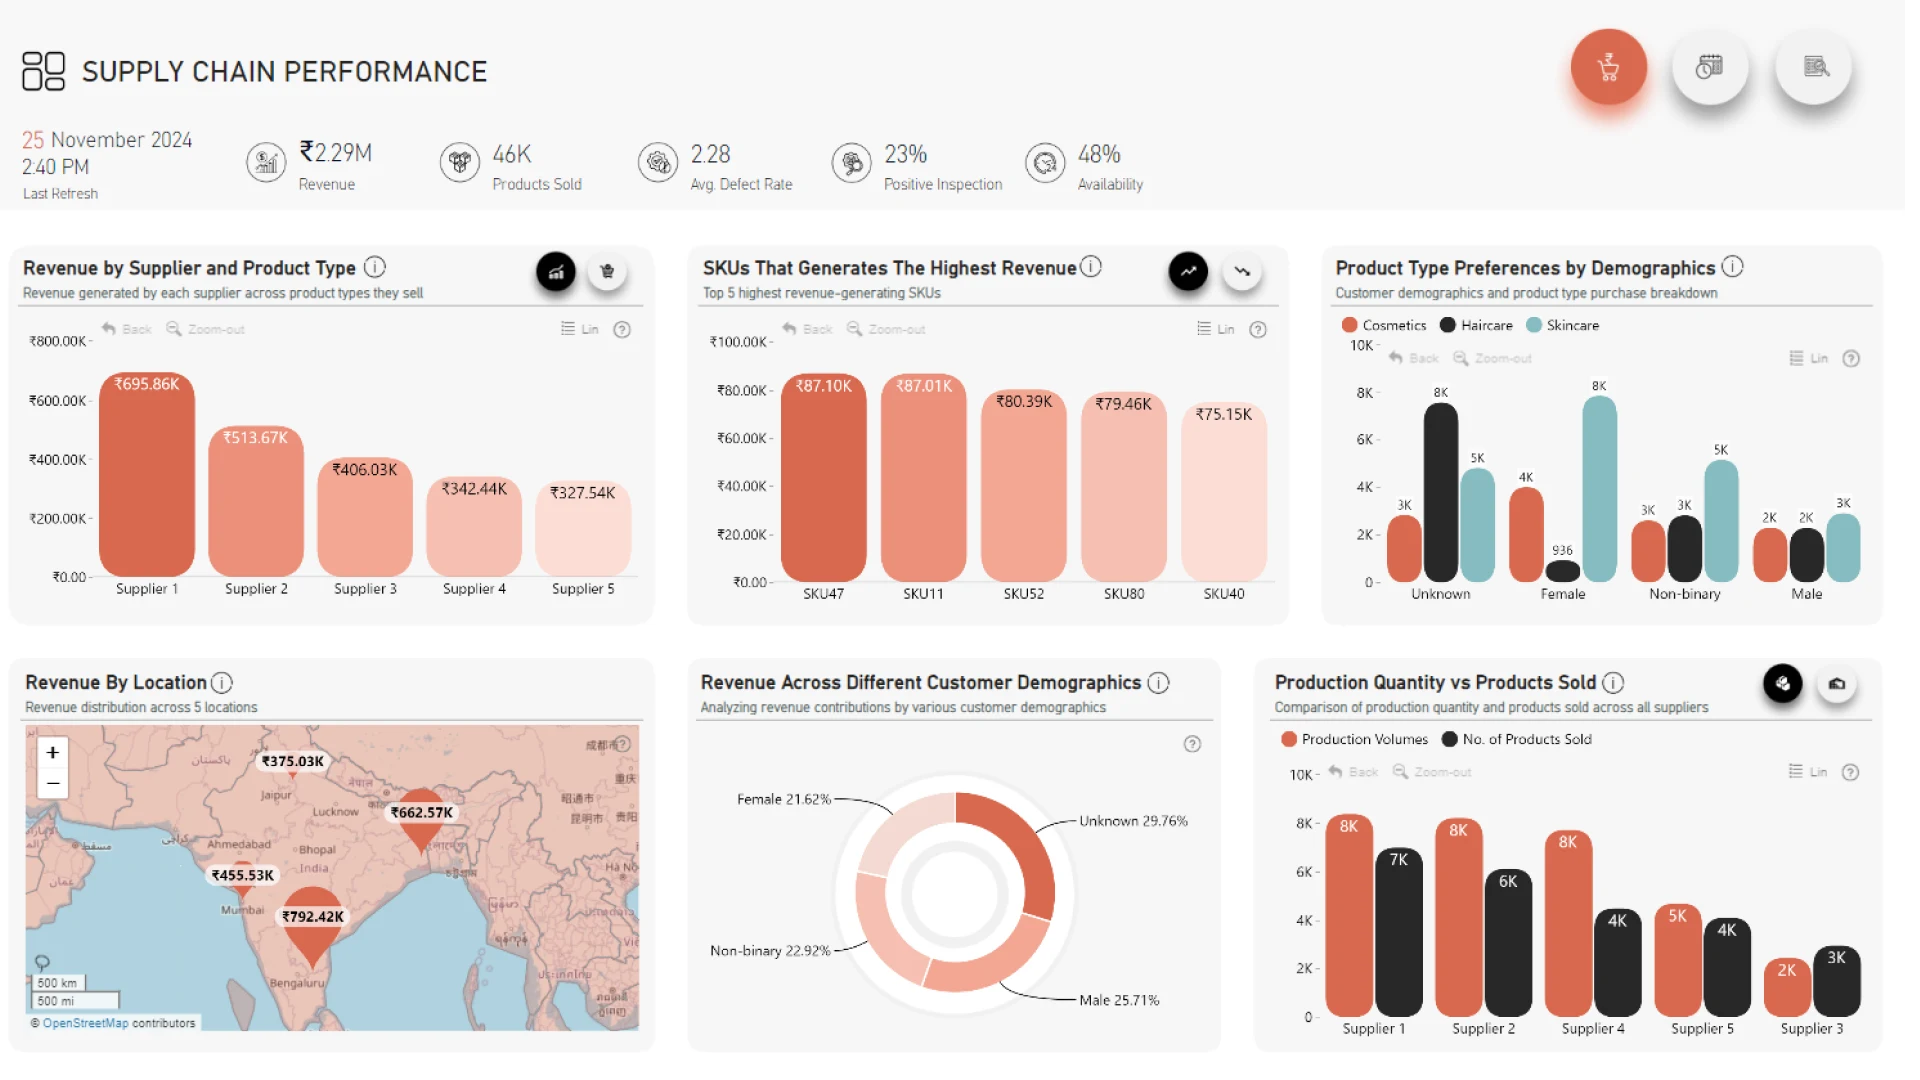
Misha Riaz’s three-page report combines revenue and production metrics with supplier efficiency, product quality, manufacturing lead times, shipping duration, transportation cost, and customer preference analysis.
Its Drill Down Scatter, Combo, Combo Bar, Map, and Donut PRO visuals support several useful analytical moves: comparing suppliers, studying relationships between measures, locating geographic patterns, and filtering from a high-level KPI to a product, location, transportation category, or other operational dimension.
Explore this dashboard template
Design idea to borrow: Give quality its own analytical space. Defect rates and inspection outcomes should be easy to compare with production, supplier, and shipping performance, not buried in a detail table.
4. Power BI Supply Chain Management Dashboard Example
Best for: Teams that want one report spanning procurement, inventory, manufacturing, quality, and logistics
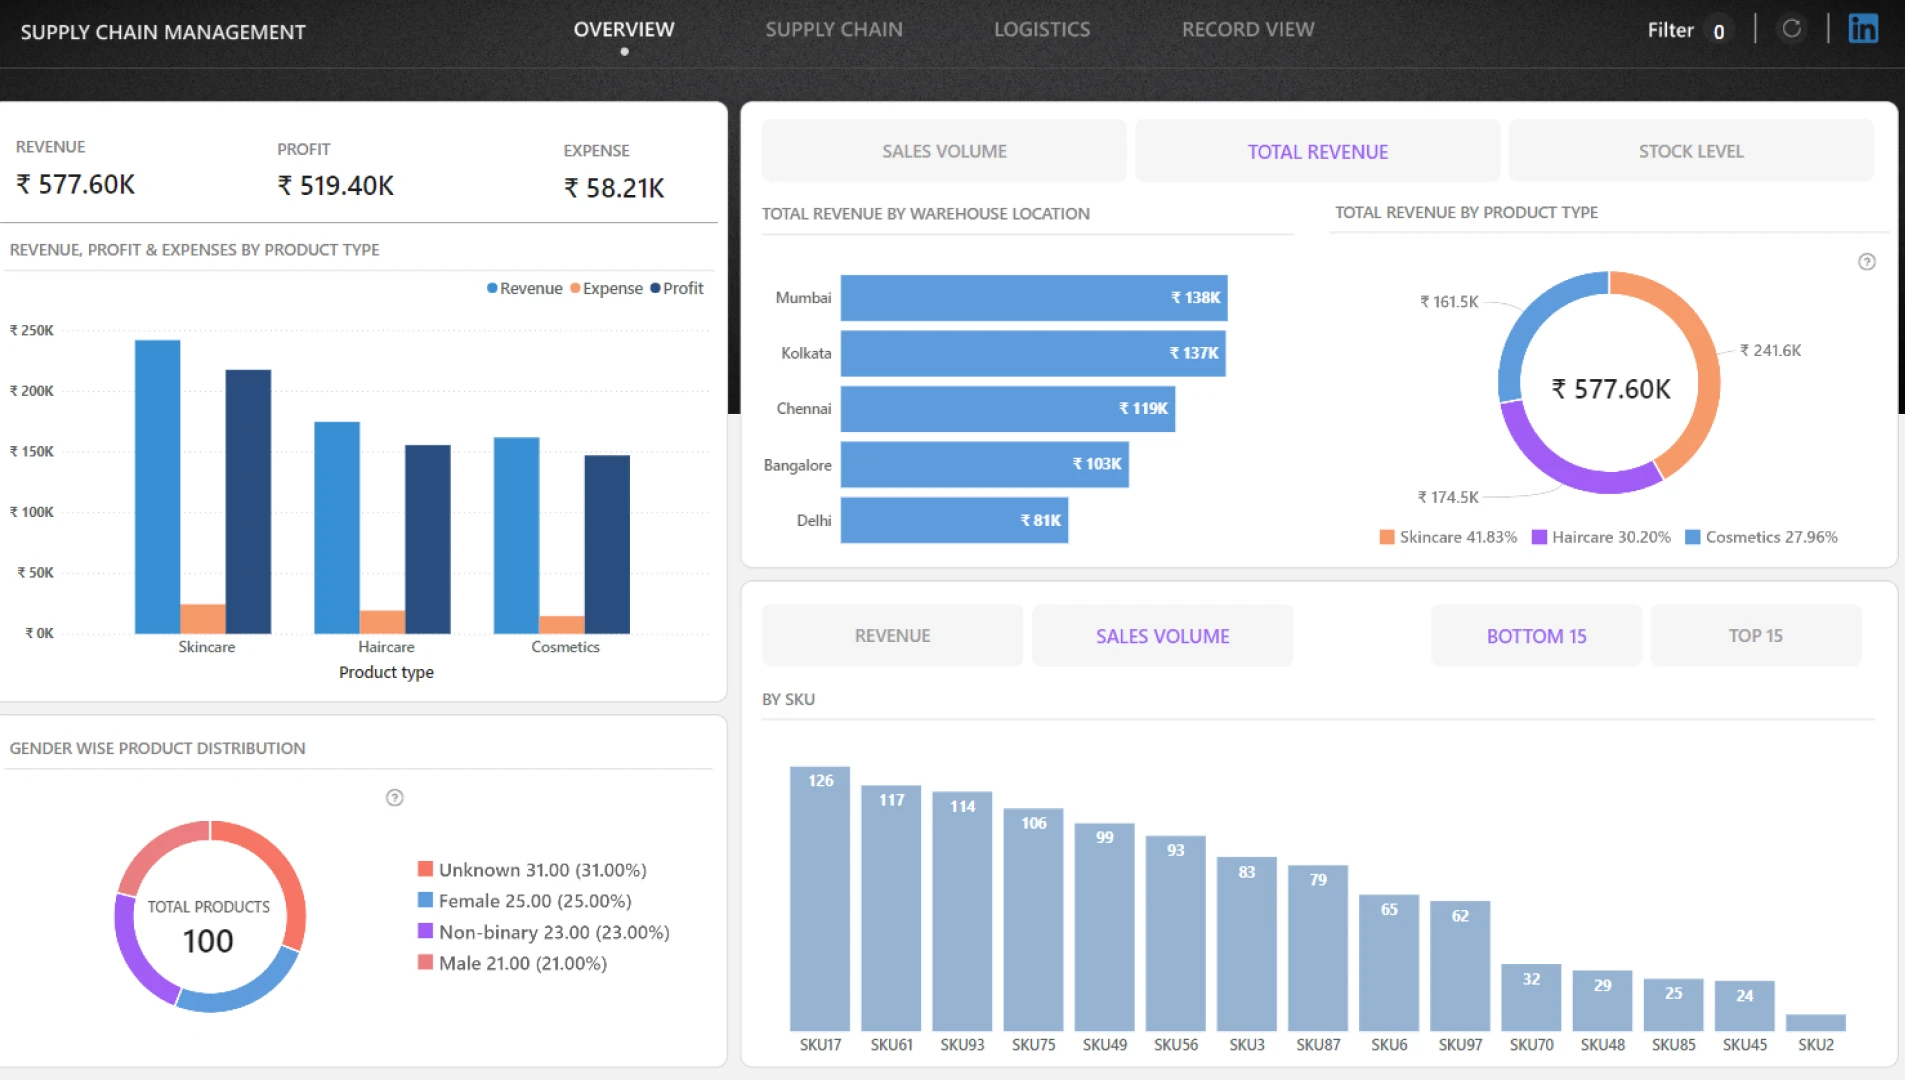
Onkar Bhise’s four-page dashboard brings together revenue, expenses, sales volume, stock quantity, defect rate, manufacturing cost, shipping cost, delivery time, and total products delivered.
The report is structured for comparison across suppliers, warehouses, carriers, routes, transport modes, product categories, SKUs, and stock status. Procurement days and supplier inspection results sit alongside inventory health, manufacturing quality, shipping cost, and delivery performance.
Explore this dashboard template
Design idea to borrow: Organize the report around operational domains, then let shared dimensions such as supplier, product, warehouse, and route connect those pages through filtering.
5. Power BI Supply Chain Risk and Performance Dashboard
Best for: Food and beverage operations that need to connect fulfillment risks with revenue and gross profit
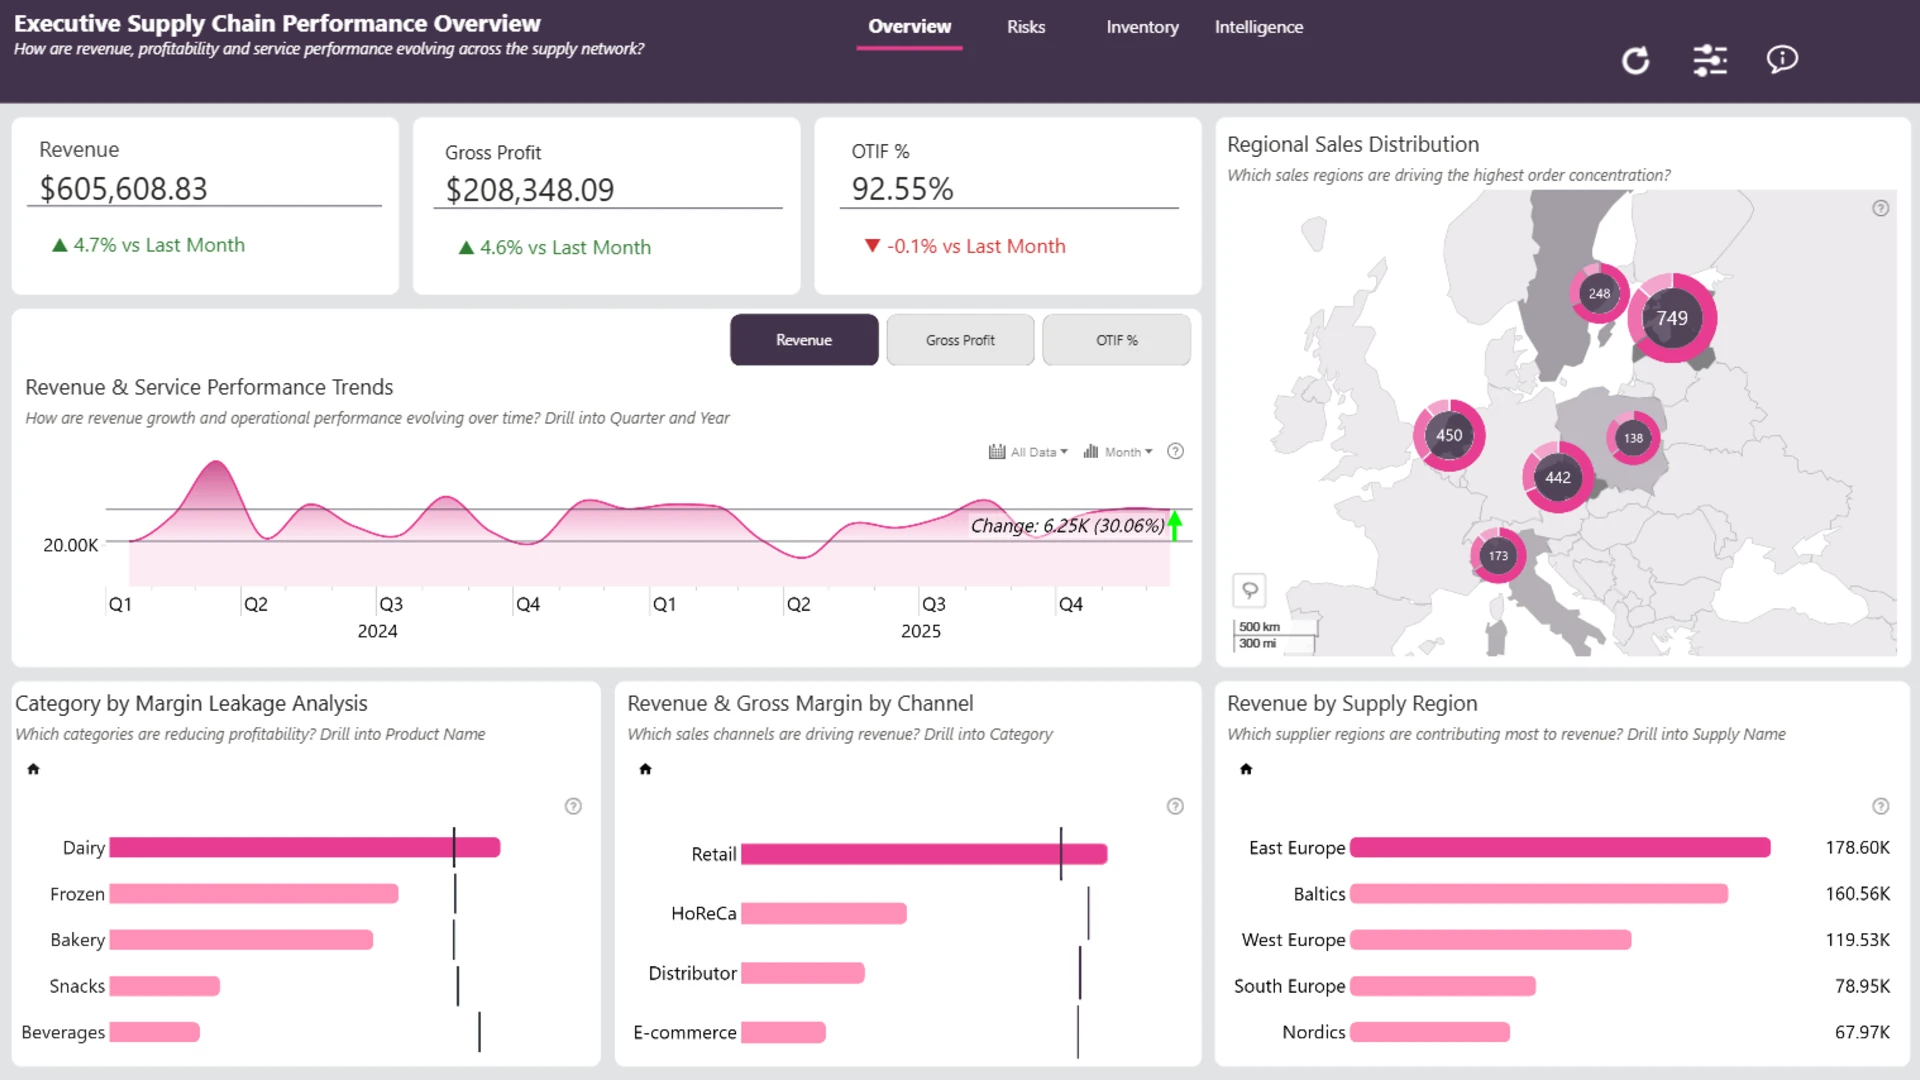
Created by Akindele Omolayo, this four-page report tracks revenue, gross profit, OTIF, late deliveries, stockouts, returns, waste, and customer fulfillment. It also compares suppliers, warehouses, products, channels, and time periods.
The visual set includes Scatter, Waterfall, Combo Bar, Map, Timeline, and Donut PRO. That gives the report several ways to expose risk, including relationships between measures, geographic patterns, changes over time, and the contribution of individual categories to a total.
Explore this dashboard template
Design idea to borrow: Do not isolate risk as a red status count. Show the operational issue together with its fulfillment and profitability context so the reader can judge priority.
6. Supply Chain Visualization Power BI
Best for: Analysts designing an executive report around supplier reliability, fulfillment efficiency, inventory availability, and demand volatility

Agbata Dickson Ukolojo’s four-page report uses the same food and beverage supply chain dataset but frames the analysis around business performance and supply chain health. The author’s stated focus is supplier reliability, warehouse fulfillment efficiency, operational risk, inventory availability, and demand volatility.
The report uses Drill Down Scatter, Combo, Combo Bar, Timeline, and Donut PRO visuals. This creates a varied but coherent toolkit for moving between trends, comparisons, composition, and relationships between KPIs.
Explore this dashboard template
Design idea to borrow: Start with the decisions an executive needs to make, then choose a small visual vocabulary that supports those questions across every page.
7. Retail Supply Chain Management and Sales Analysis
Best for: Retail analysts comparing sales, profit, orders, returns and delivery performance across products and customer segments
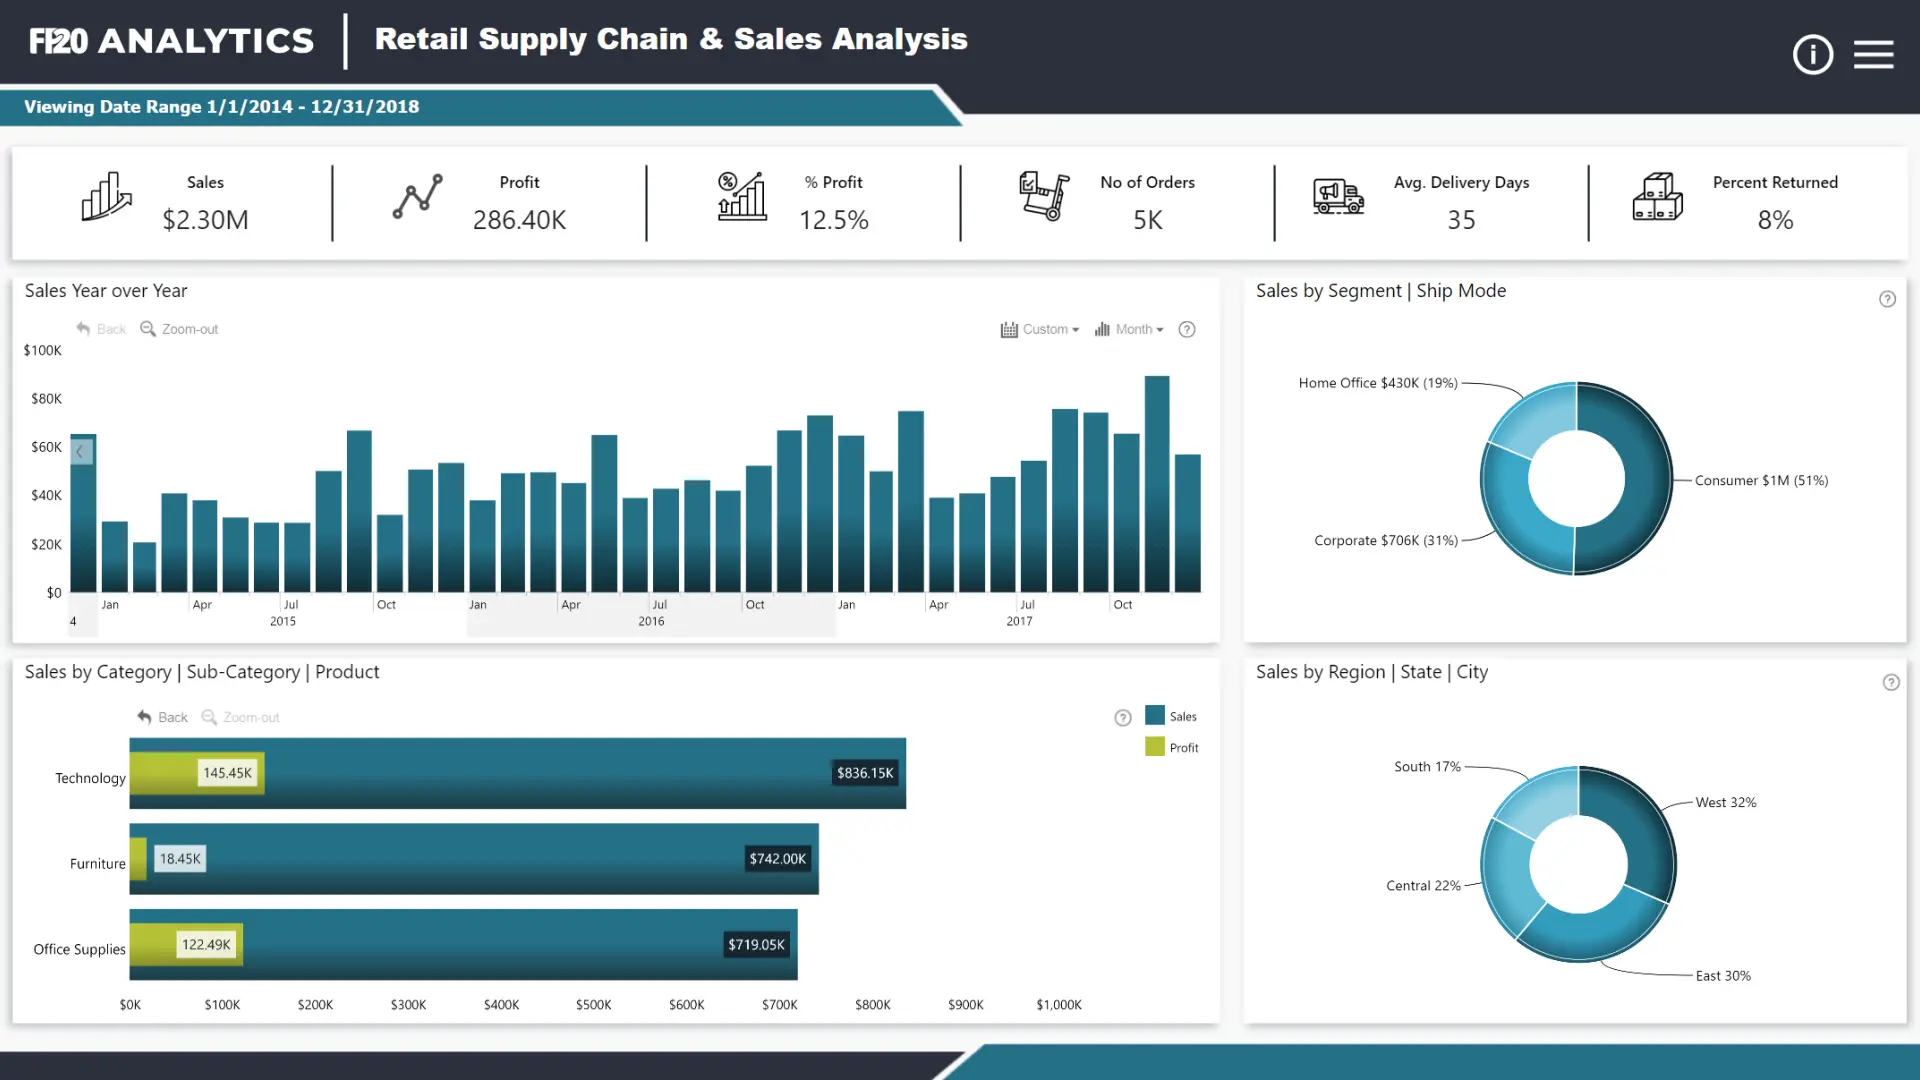
This updated ZoomCharts report is based on a top submission to the FP20 Analytics October 2023 Challenge. It examines sales data from a North American retail network using a concise KPI ribbon and interactive charts for trends, sales composition, product categories and location.
ZoomCharts visuals used: Drill Down Combo PRO, Combo Bar PRO, Map PRO, Timeline PRO and Donut PRO.
Explore this dashboard template
Design idea to borrow: Keep order, delivery and sales measures close together so users can test whether commercial outcomes and operational performance move in the same direction.
8. Comprehensive Power BI Supply Chain Performance Dashboard
Best for: Operations teams exploring revenue, inventory, supplier performance and logistics trends in one report
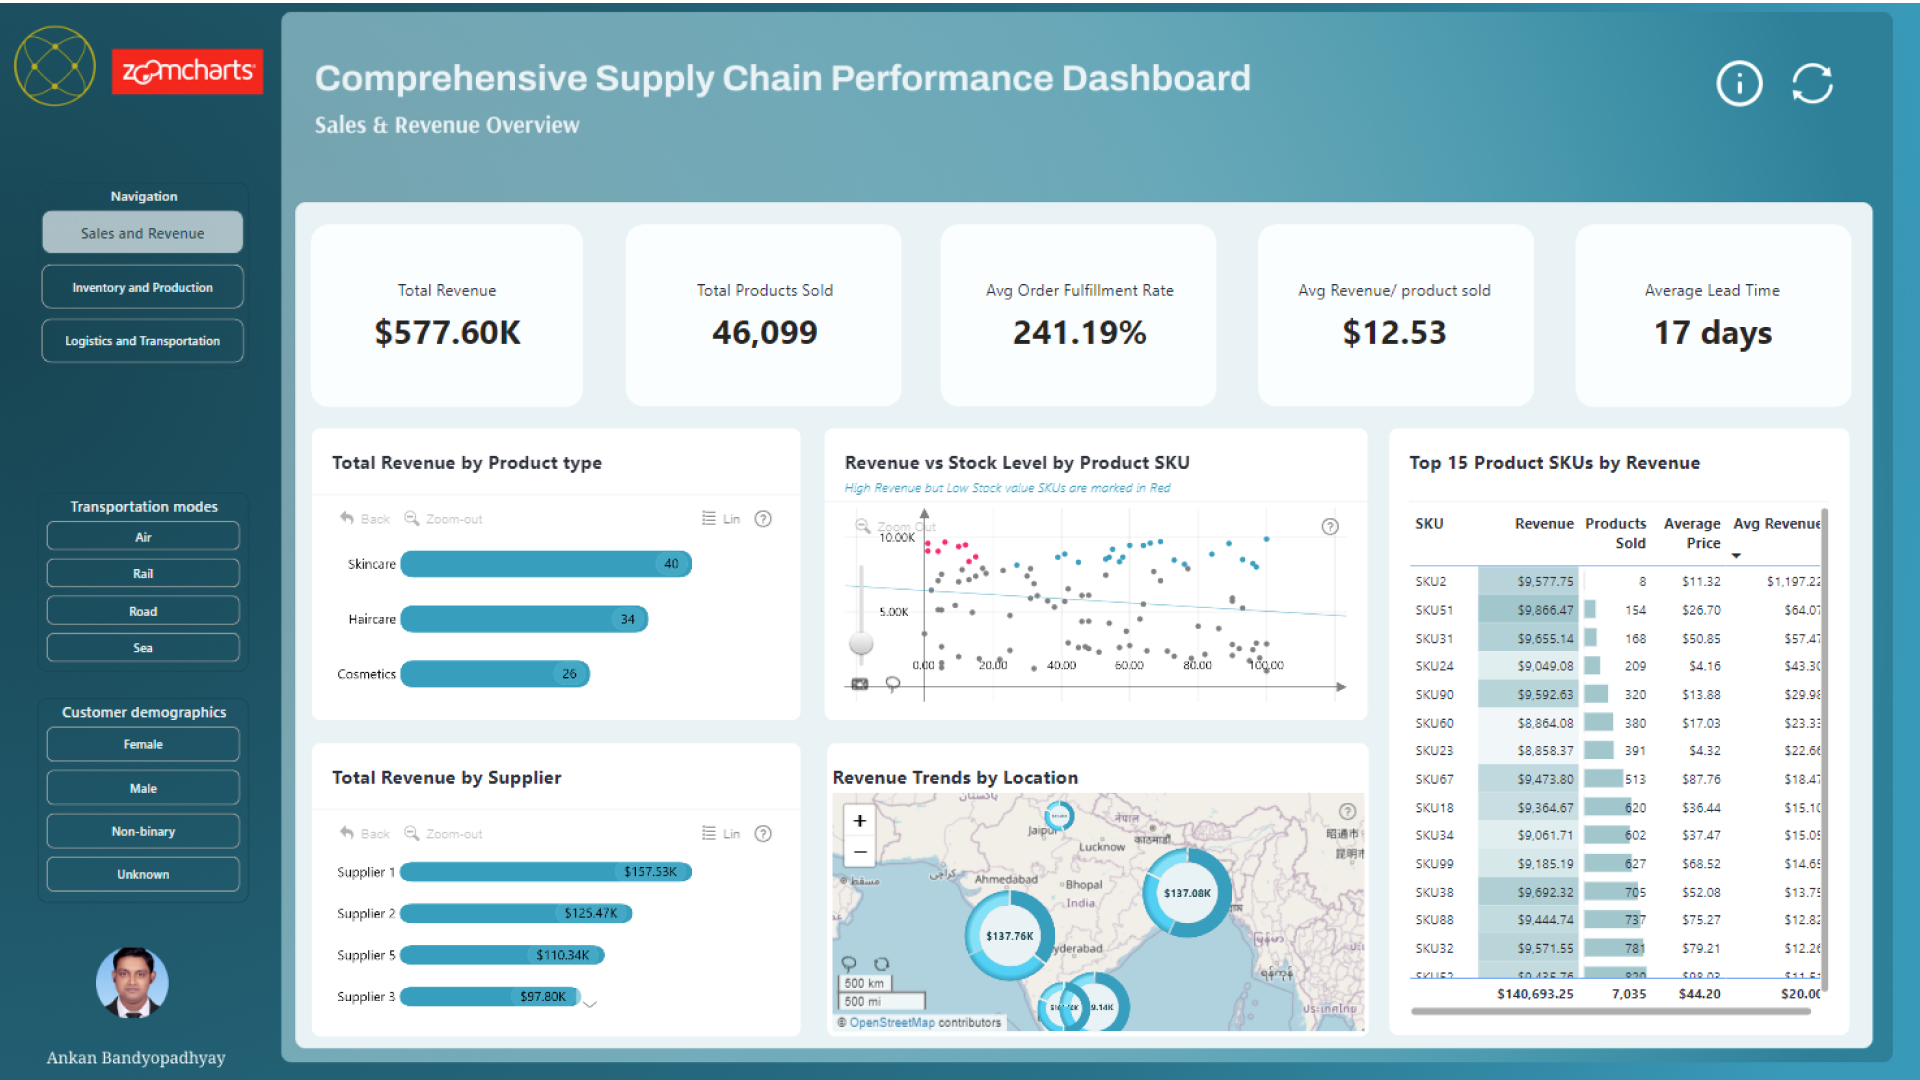
Ankan Bandyopadhyay’s supply chain performance report combines an overview with interactive comparisons across operational dimensions. Users can examine performance measures, trends and individual segments through filters and chart selections.
ZoomCharts visuals used: Drill Down Scatter PRO, Combo PRO, Combo Bar PRO, Map PRO and Donut PRO.
Explore this dashboard template
Design idea to borrow: Provide clear paths from performance KPIs into category, supplier and geographic views instead of crowding every comparison onto the overview.
9. Executive Supply Chain Dashboard
Best for: Executives connecting revenue, gross profit, OTIF, stockouts and supplier performance

Jude Onuh’s Food and Beverage supply chain report was submitted to the May 2026 ZoomCharts 4U Reports Challenge. It combines commercial and operational KPIs, with drill-down analysis across warehouses, customer channels and periods.
ZoomCharts visuals used: Drill Down Scatter PRO, Combo PRO, Map PRO, Timeline PRO and Donut PRO.
Explore this dashboard template
Design idea to borrow: Give leaders a small group of business-critical KPIs, then provide fast drill-down paths to the regions and channels behind unusual results.
10. Food and Beverage Supply Chain Dashboard
Best for: Food and beverage operations evaluating profitability, suppliers, orders, waste and fulfillment

Created by Okeh Dono Efasa for the May 2026 4U Reports Challenge, this report combines revenue, gross profit, OTIF, late deliveries, stockouts, returns, waste and supplier performance. Its interactive pages support comparisons across warehouses, channels and time.
ZoomCharts visuals used: Drill Down Combo PRO, Waterfall PRO, Combo Bar PRO, Timeline PRO and Donut PRO.
Explore this dashboard template
Design idea to borrow: Show operational losses and changes alongside financial results, using a waterfall view when a breakdown of contributions is useful.
11. Supply Chain Onyx Data Challenge Power BI Dashboard
Best for: Analysts exploring product profitability, inventory and stock, manufacturing and shipping

Daniel van Dongen created this Power BI report for the November 2024 Onyx Data DataDNA ZoomCharts Mini Challenge using a supply chain analysis dataset. The design demonstrates interactive relationships between revenue, products, pricing and inventory.
ZoomCharts visuals used: Drill Down Scatter PRO, Combo Bar PRO, Map PRO and Donut PRO.
Explore this dashboard template
Design idea to borrow: When multiple operational questions share the same data, organize the views around a few clear themes such as profitability, stock, distribution and quality.
What the Best Supply Chain Dashboards Have in Common
The strongest examples do not attempt to place every metric on one crowded page. They separate overview, supplier, inventory, quality, logistics, and risk questions, while preserving consistent navigation and filtering.
- They connect service KPIs such as OTIF and late deliveries with financial measures such as revenue, gross profit, shipping cost, or manufacturing cost.
- They let users move from a top-level alert to a supplier, product, warehouse, route, channel, location, or period.
- They treat stockouts, waste, defects, returns, and delays as analytical paths, not just warning colors.
- They use a limited set of interactive visuals consistently, so readers can explore without relearning the interface on every page.
How to Choose a Power BI Supply Chain Template
Start with the decision your report needs to support. Choose the end-to-end ZoomCharts template when leadership needs a broad command view, or the executive example for a more focused overview. Pick the retail example when sales and operations must be read together. Use the performance and quality report when manufacturing and inspection are central. Choose the risk dashboard when fulfillment issues need a direct financial context, or the supplier-focused report when procurement is the main audience.
Before adapting any PBIX file, check that its grain, dimensions, and KPI definitions fit your data. Supplier, product, warehouse, route, channel, and date fields need consistent keys. OTIF, stockout rate, defect rate, gross margin, and lead-time measures also require definitions that match the organization’s operating rules. A polished layout cannot compensate for an ambiguous measure.
Explore the ZoomCharts Power BI Logistics Dashboard Examples and Templates to preview reports, interact with visuals, and find a PBIX template that fits your supply chain reporting needs.
Try ZoomCharts Drill Down Visuals
Want to build your own interactive report? Explore ZoomCharts Drill Down visuals and the free trial.

Want more info like this?
Subscribe to our newsletter and be the first to read our latest articles and expert data visualization tips!