2217
Power BI Supply Chain Management Dashboard Example
Power BI Supply Chain Management Dashboard Example
More Report pages
Report Author: Onkar Bhise
2217
Share template with others
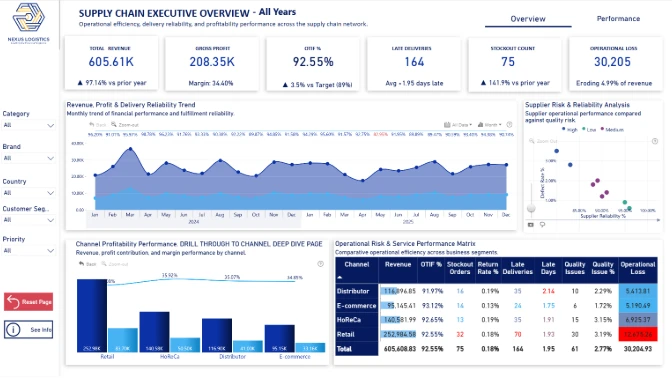
Power BI Supply Chain Management Dashboard
An interactive Power BI dashboard example for monitoring logistics, inventory, procurement, supplier performance, manufacturing, and product quality in one report.
This Power BI supply chain management dashboard helps operations, logistics, procurement, and supply chain teams track performance across the full supply chain. It brings together key metrics such as revenue, expenses, sales volume, stock quantity, defect rate, manufacturing cost, shipping cost, delivery time, and total products delivered.
The report makes it easier to analyze costs, compare suppliers, review delivery performance, monitor product quality, and identify issues across warehouses, carriers, routes, SKUs, and stock status.
Key Insights of This Power BI Supply Chain Dashboard
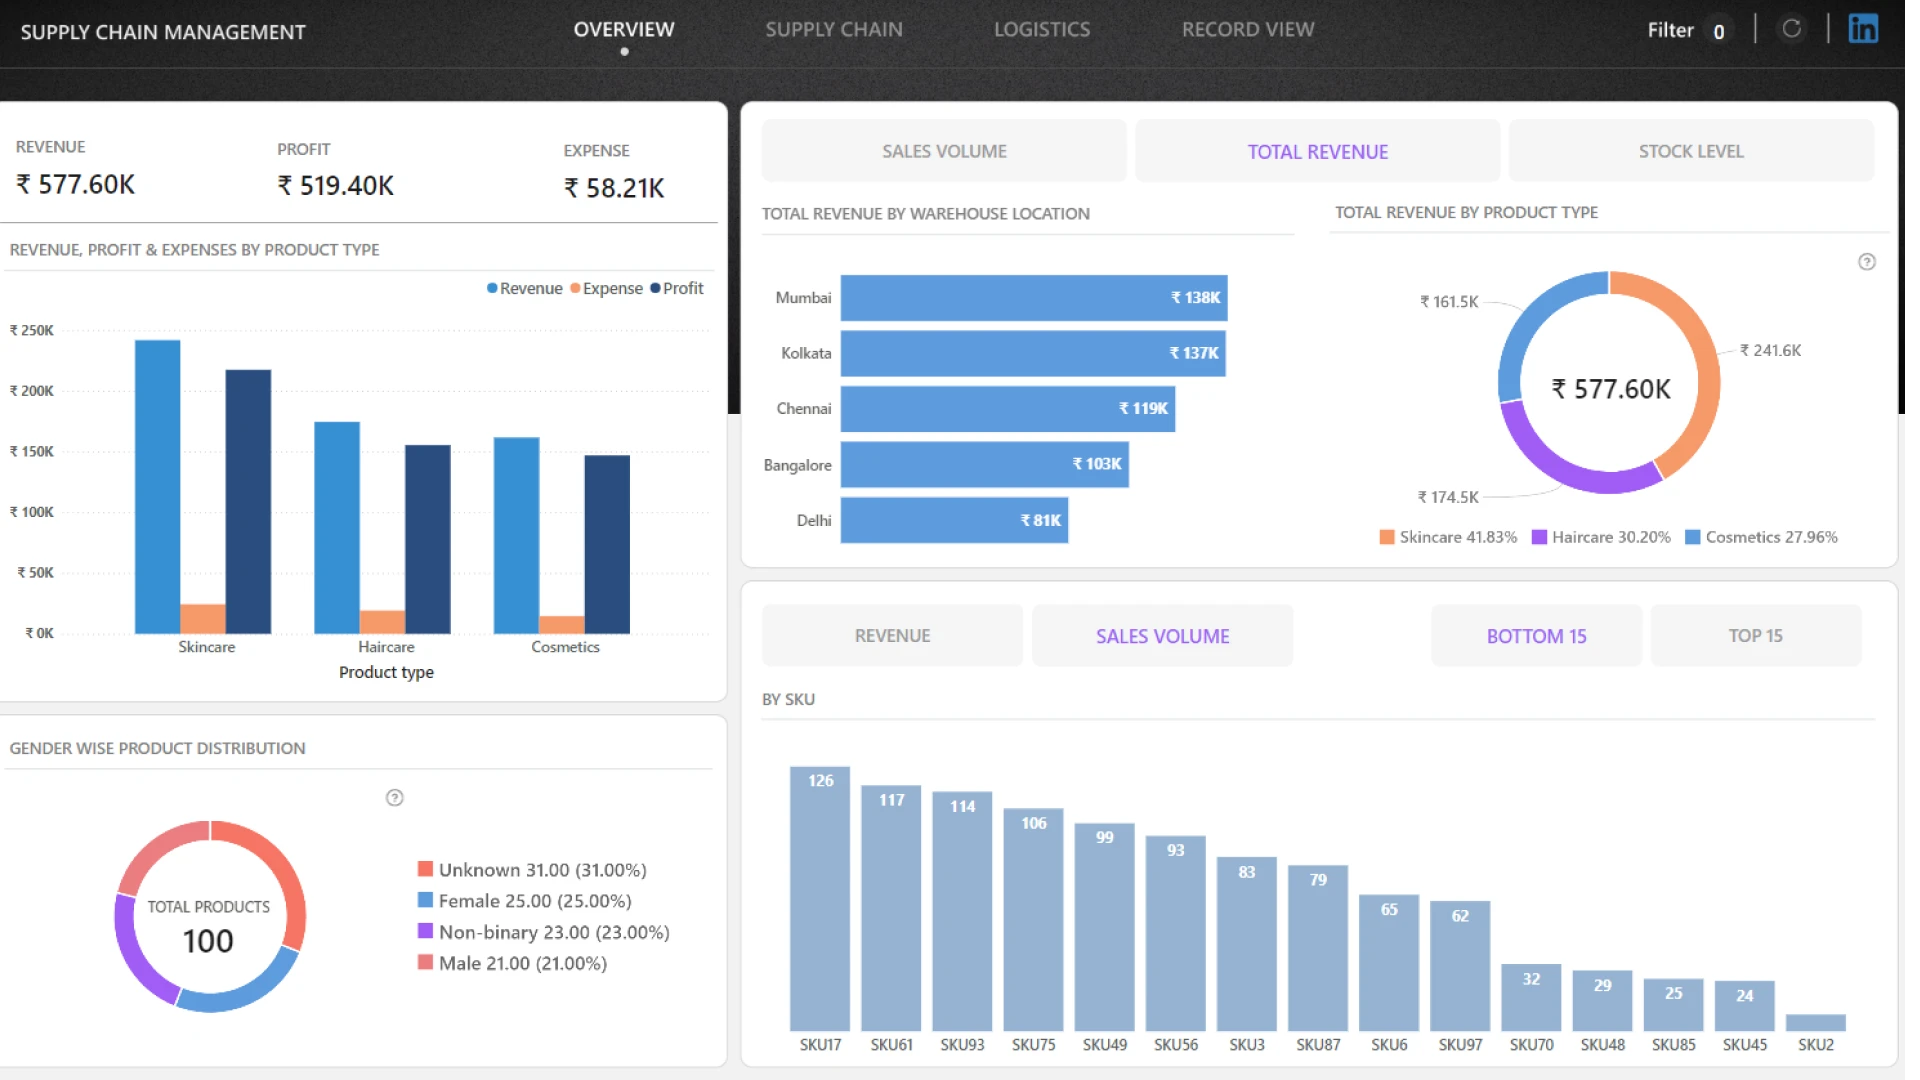
Supply Chain KPI Overview
Monitor revenue, expenses, sales volume, stock quantity, delivered products, and delivery performance.
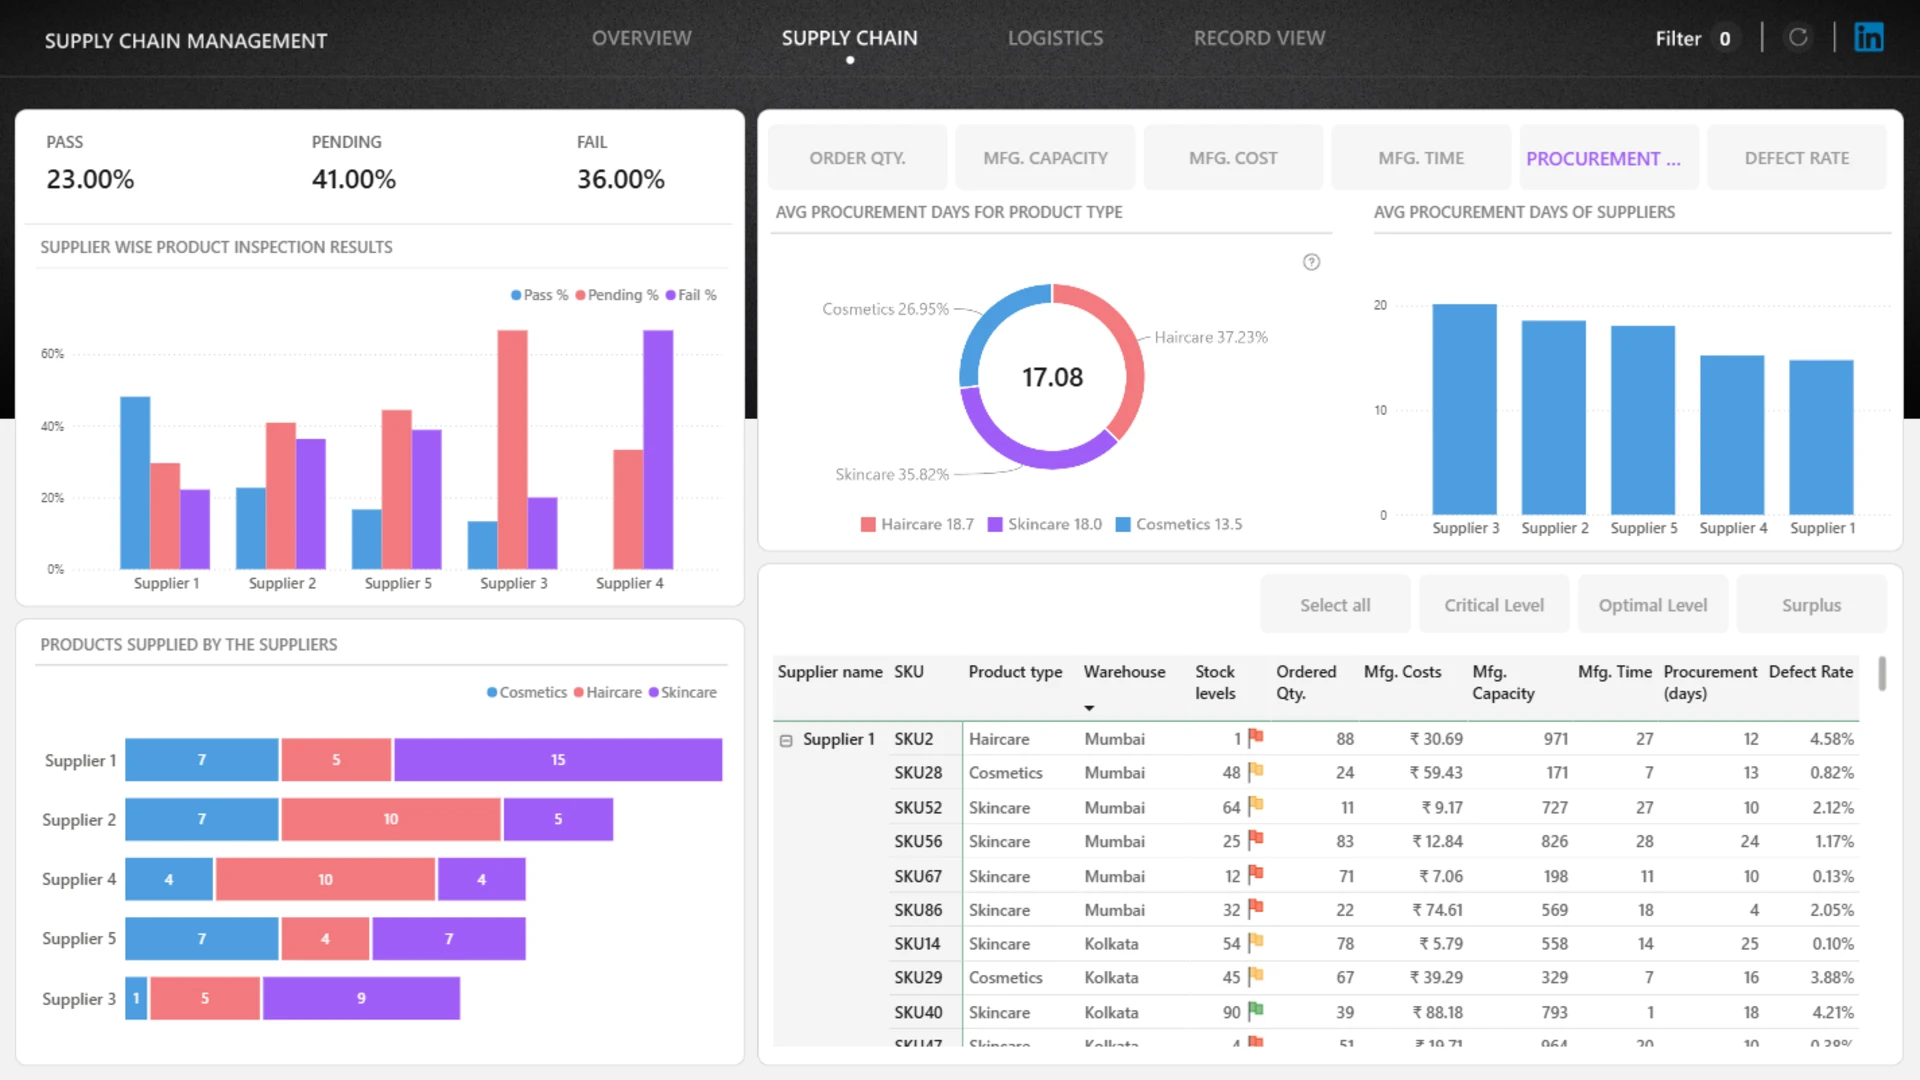
Supplier & Procurement Analysis
Compare supplier inspection results and procurement days by product type and supplier.
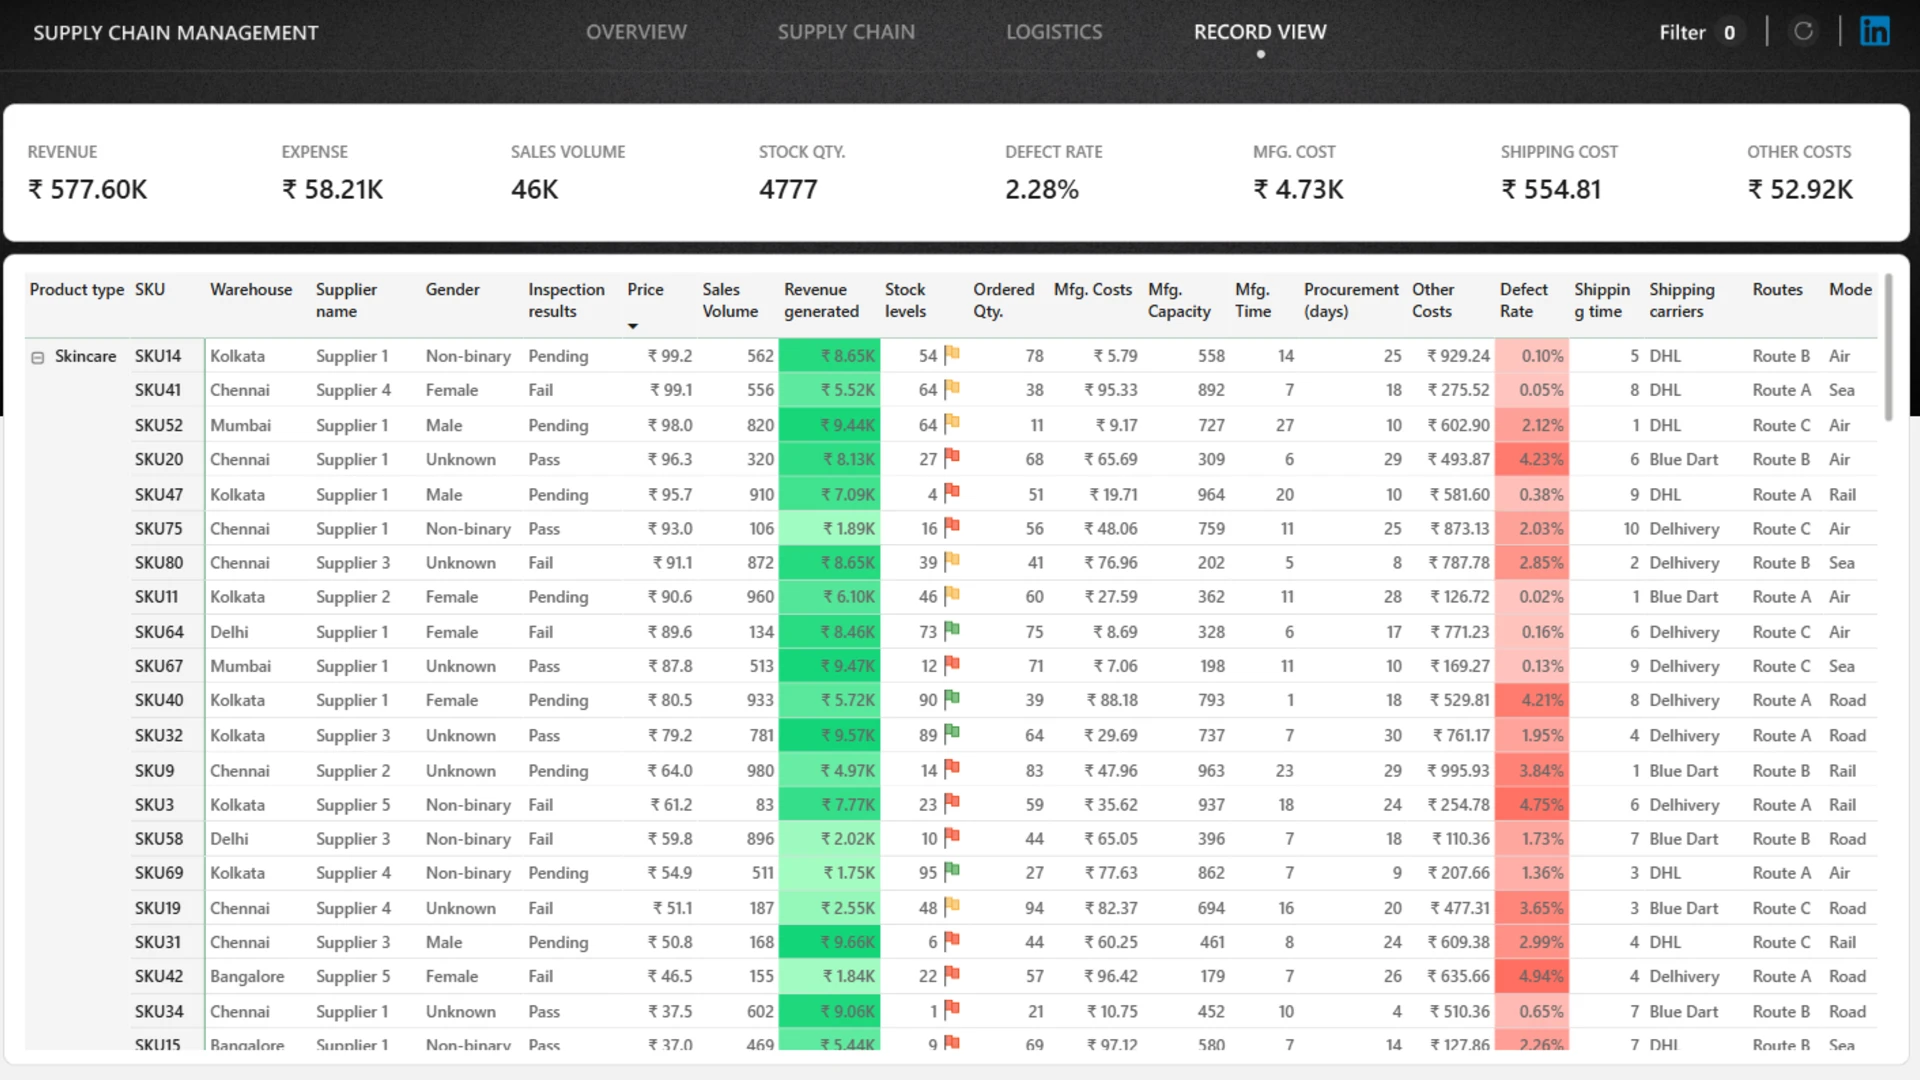
Inventory & Stock Status
Review stock levels, SKU-level records, product availability, and inventory health.
Manufacturing & Quality
Analyze manufacturing cost, defect rate, inspection outcomes, and product quality issues.
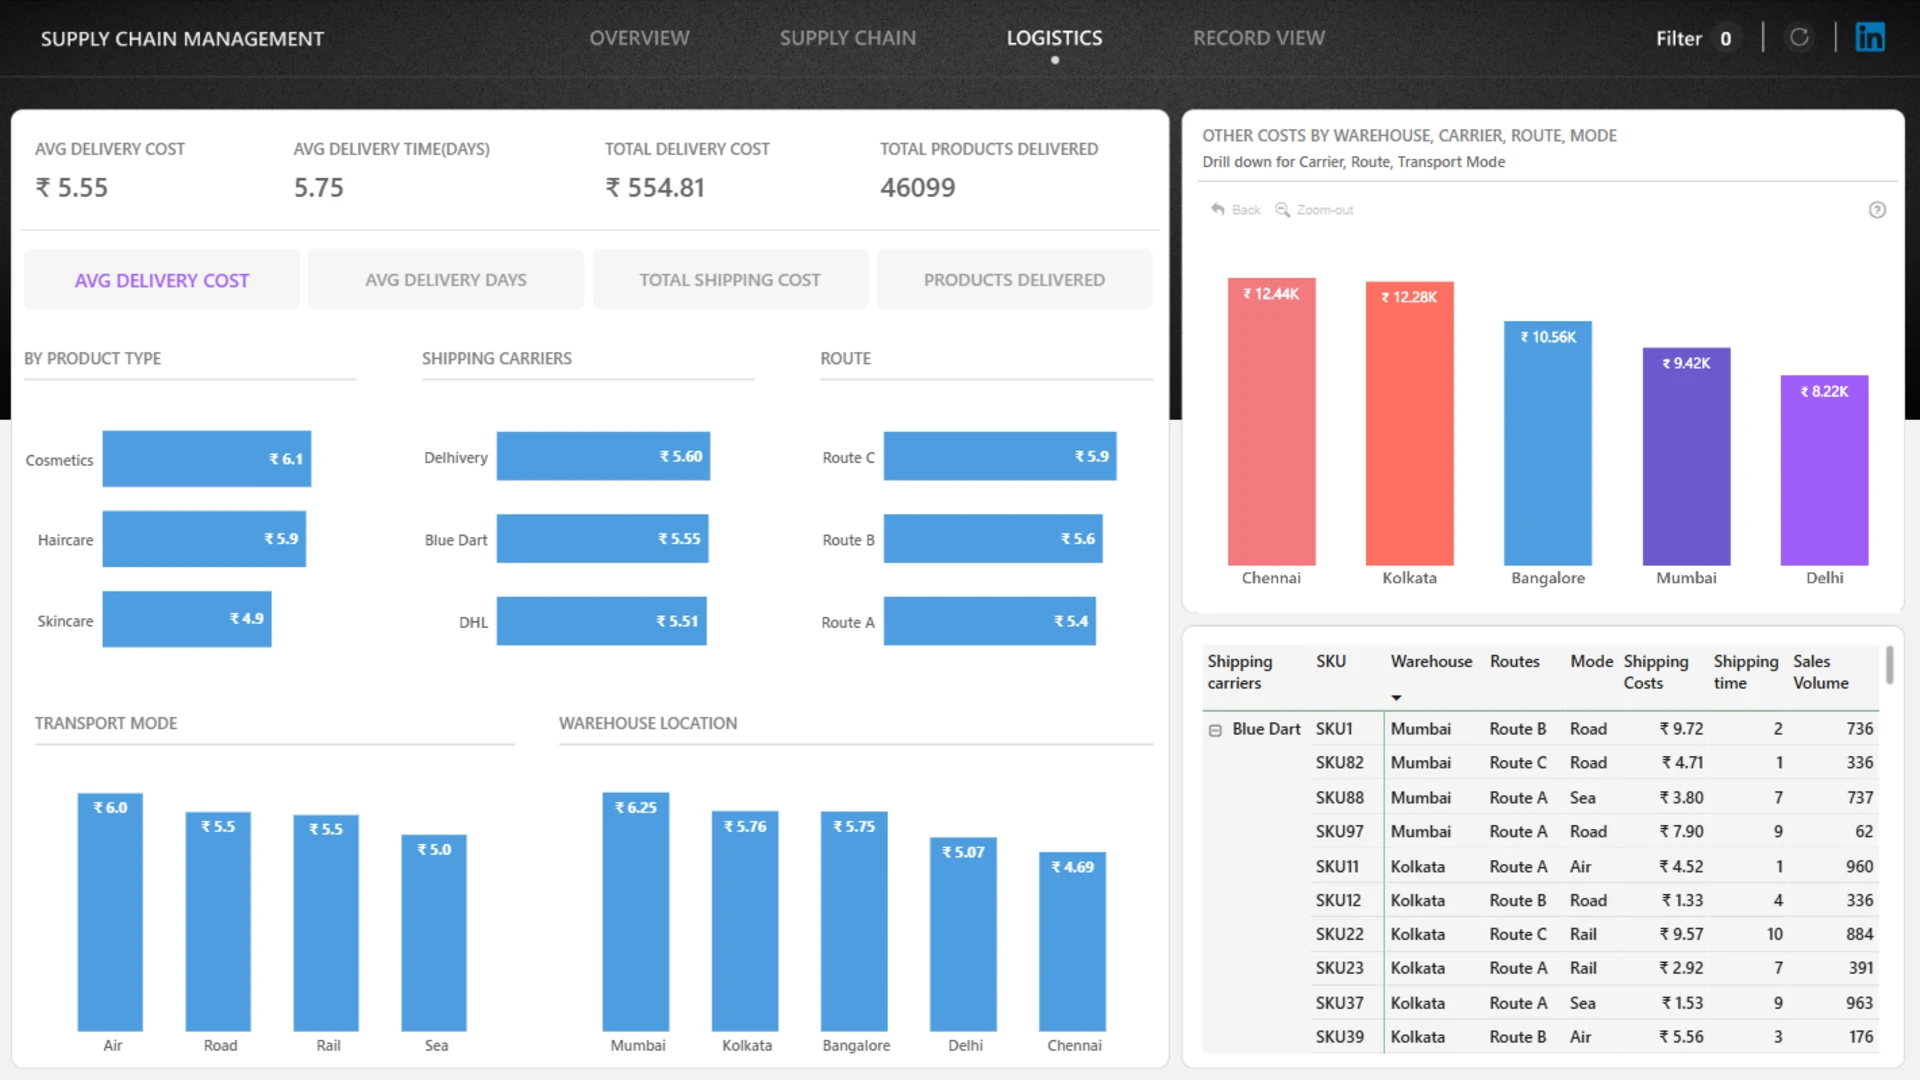
Logistics Performance
Evaluate shipping cost, delivery time, warehouse performance, carrier activity, routes, and transport modes.
Cost & Issue Detection
Identify cost drivers, supplier risks, delivery bottlenecks, stock issues, and quality problems.
Why This Report Is Useful
This dashboard gives users a single place to explore supply chain performance from multiple angles. Interactive filtering and cross-analysis make it easier to move from high-level KPIs to specific suppliers, products, routes, warehouses, or operational issues that need attention.
How to Use This Power BI Supply Chain Dashboard
Click to filter
Select any active visual element to filter related supply chain data.
Compare performance
Compare suppliers, warehouses, carriers, transport modes, routes, and product categories.
Find problem areas
Use the report to spot delivery delays, high costs, stock risks, and quality issues.
Download and Customize
Download the .pbix file to review the report structure, calculations, and KPI logic. You can customize the dashboard with your own data to create a supply chain performance monitoring solution tailored to your organization.
Submitted for the Onyx Data DataDNA ZoomCharts Mini Challenge, this Power BI report example shows how interactive visuals can support supply chain analysis, logistics monitoring, supplier comparison, and operational decision-making.
4U Report Challenges
Participate in data challenges, build and submit reports to get free template downloads.
Join CommunityMobile view allows you to interact with the report. To Download the template please switch to desktop view.
Was this helpful? Thank you for your feedback!
Sorry about that.
How can we improve it?