1931
Supply Chain KPI Dashboard Power BI
Supply Chain KPI Dashboard Power BI
More Report pages
Report Author: Akindele Omolayo
1931
Share template with others
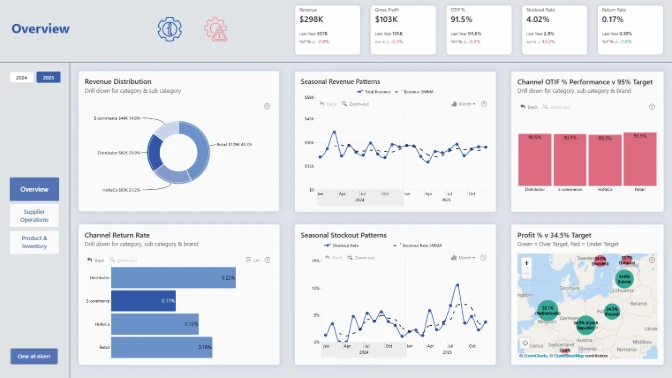
Power BI Supply Chain Dashboard
A Power BI dashboard example for analyzing food and beverage distribution performance, inventory health, supplier activity, and operational risk.
This Power BI supply chain dashboard helps teams monitor food and beverage distribution performance across revenue, gross profit, OTIF, late deliveries, stockouts, returns, waste, and supplier performance. Built with ZoomCharts Drill Down visuals and native Power BI visuals, the report gives operations, logistics, and business leaders an interactive way to analyze supply chain KPIs across warehouses, customer channels, suppliers, products, and time periods.
The dashboard is organized into focused views for performance overview, risk monitoring, inventory health, and business intelligence. Users can drill into service issues, compare supplier and warehouse performance, identify inventory disruptions, and understand how operational challenges affect profitability and customer fulfillment.
Key Insights of This Power BI Supply Chain Dashboard
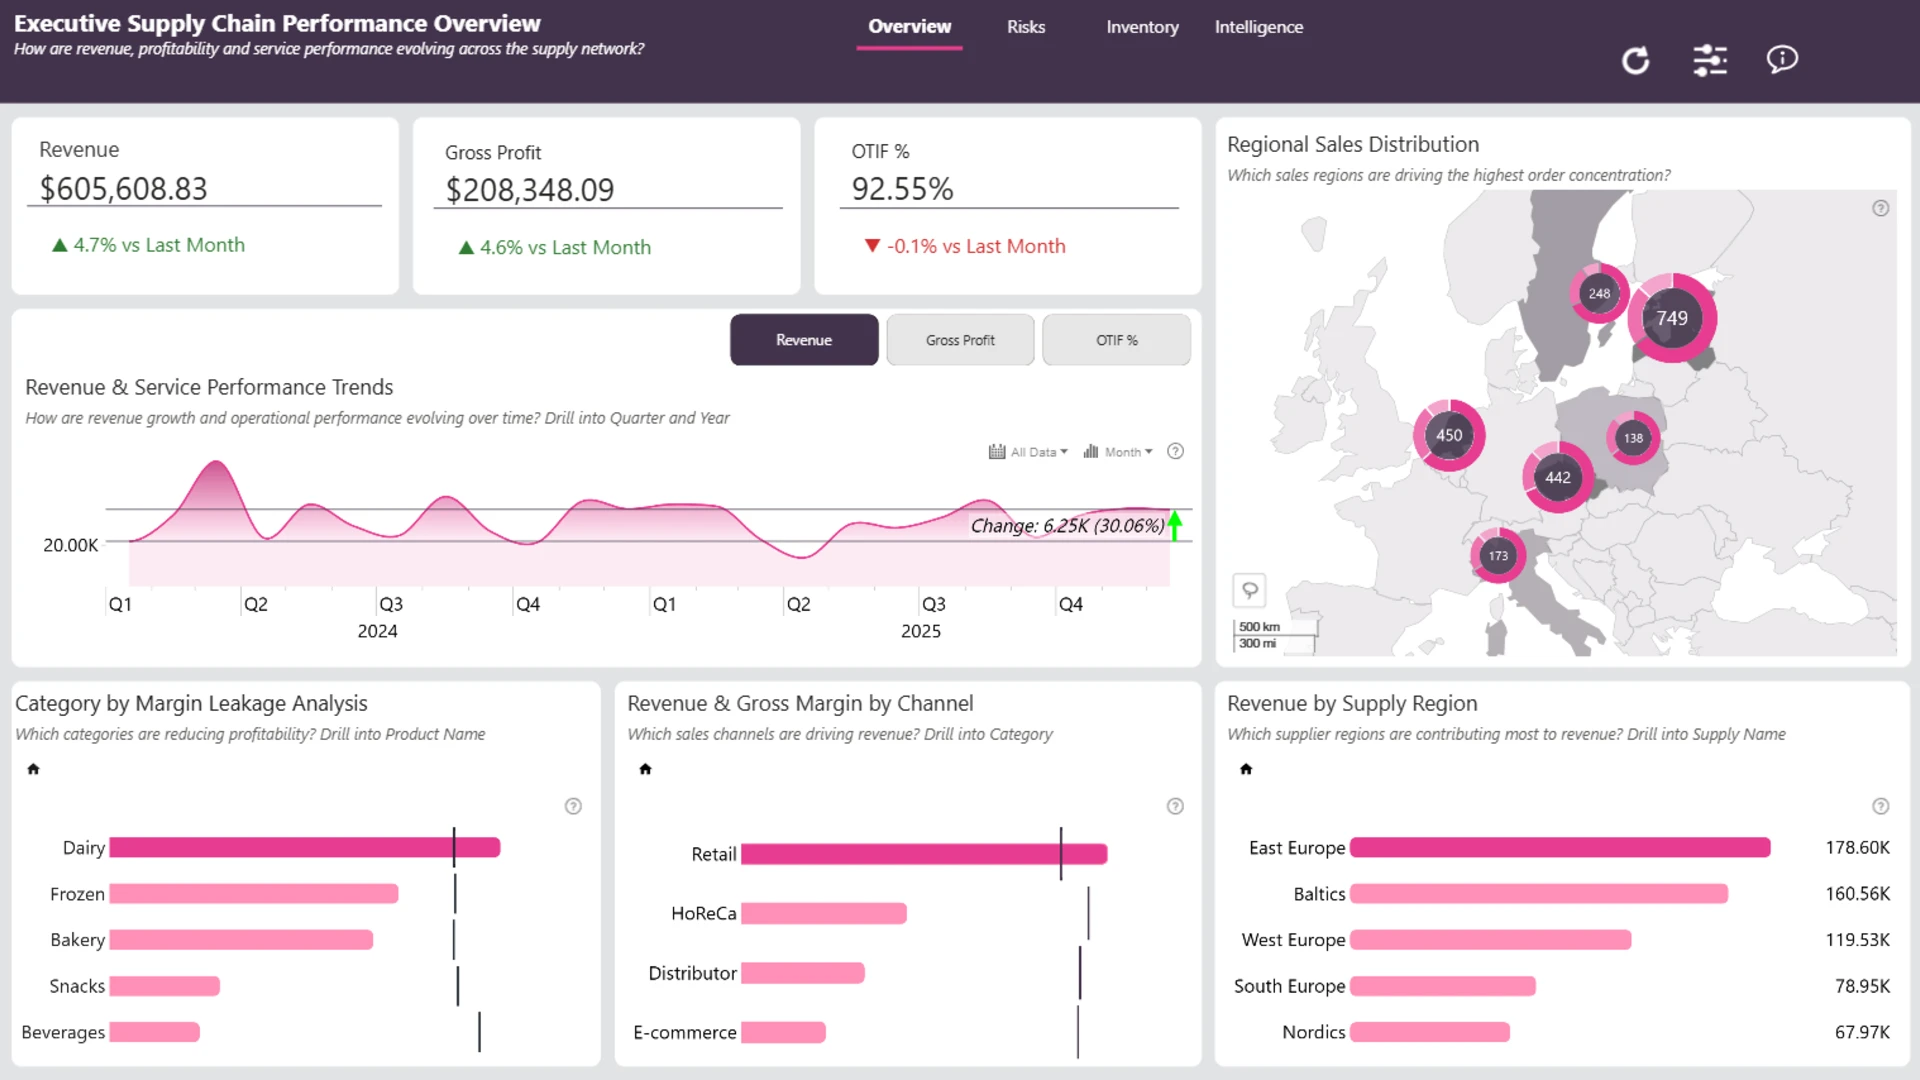
Distribution Performance
Monitor revenue, gross profit, OTIF, late deliveries, and customer fulfillment performance.
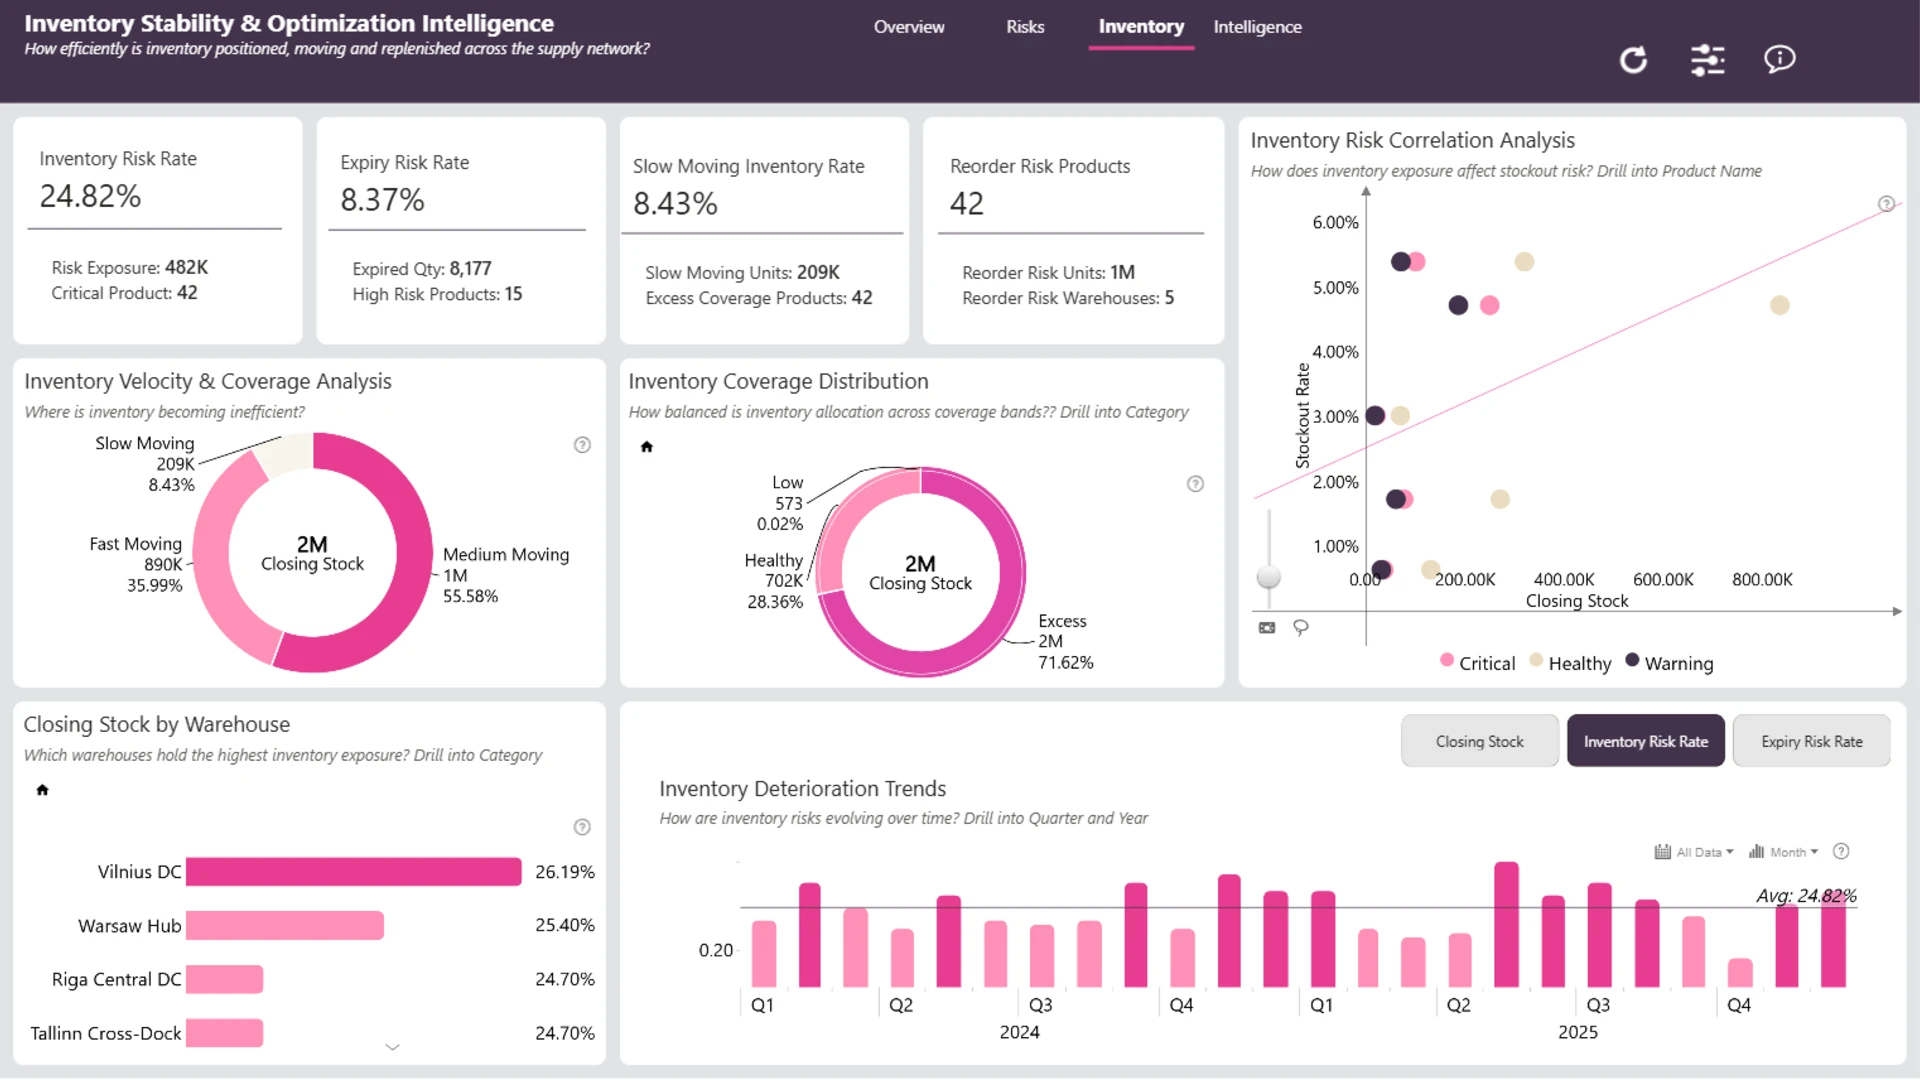
Inventory Health
Analyze stockouts, inventory disruptions, product availability, and supply chain reliability.
Supplier & Warehouse Performance
Compare suppliers, warehouses, customer channels, products, and time periods.
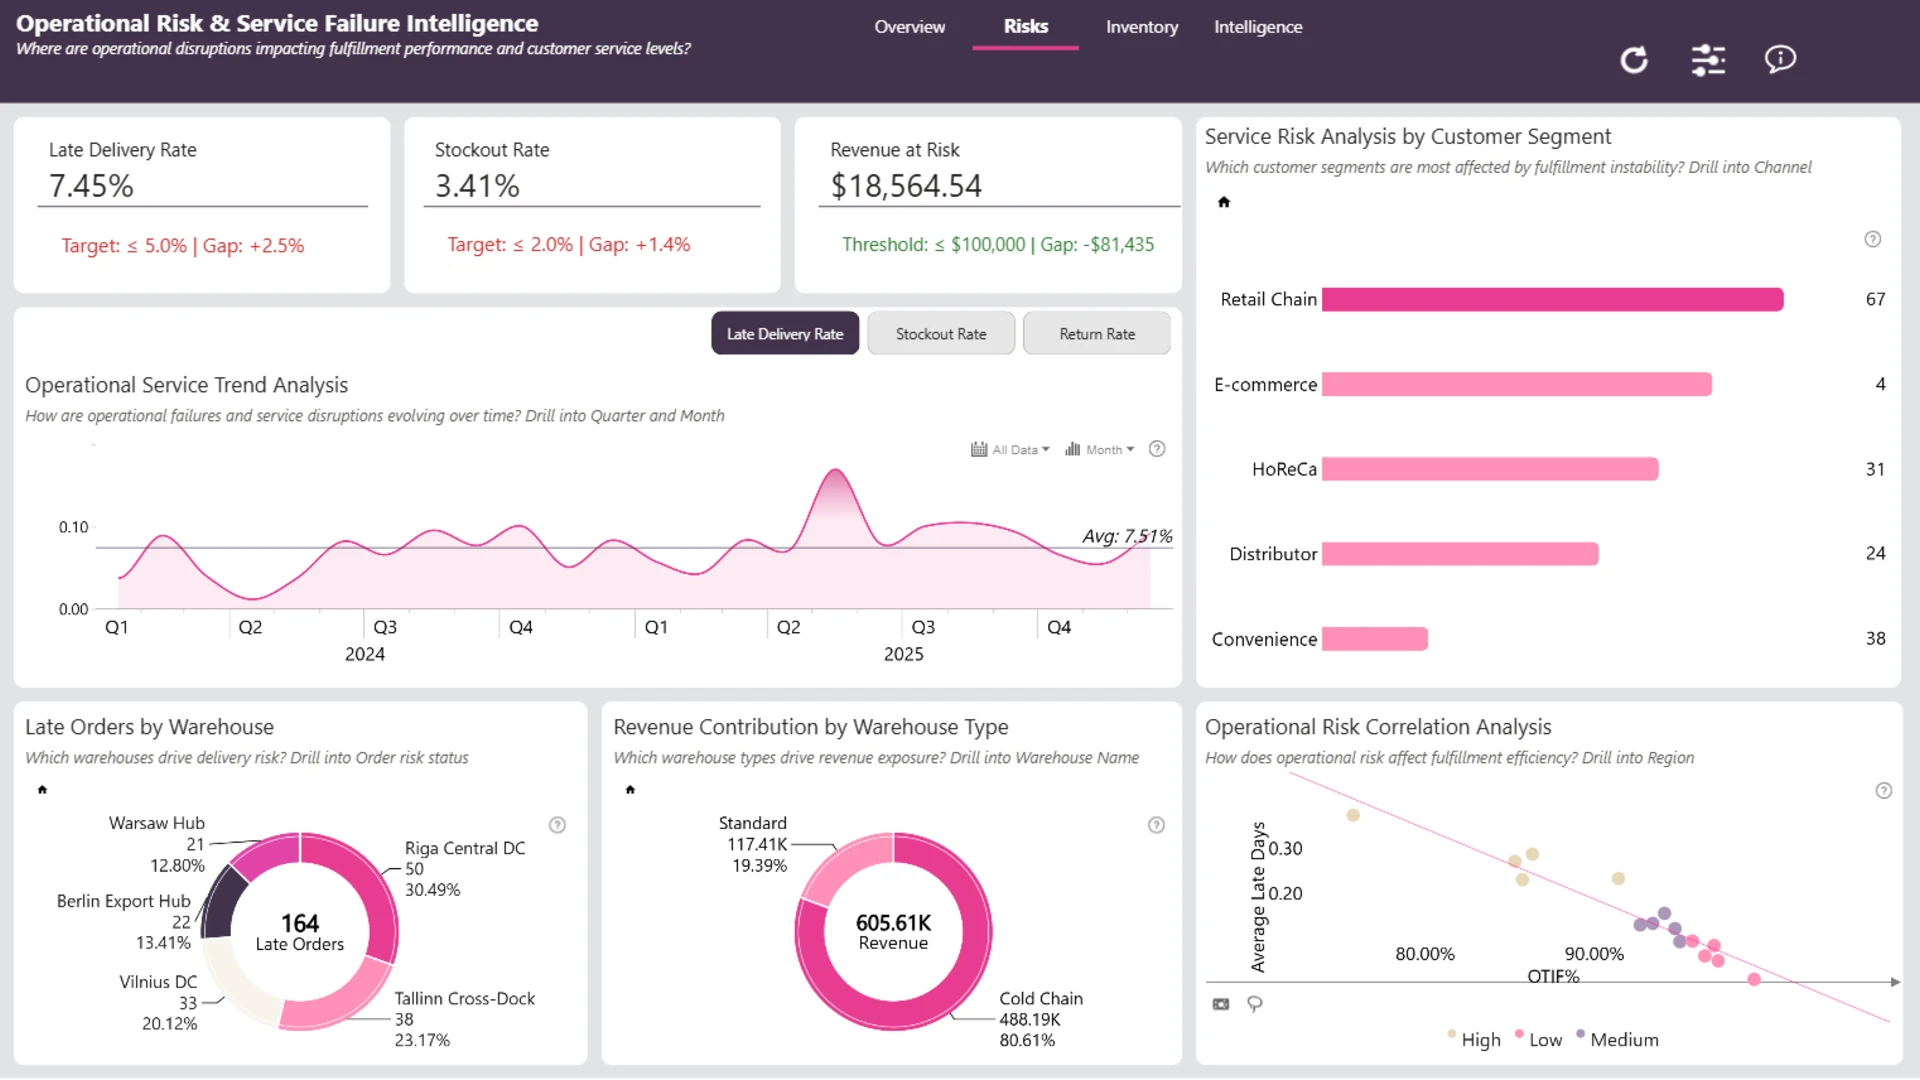
Operational Risk Monitoring
Identify service issues, returns, waste, late deliveries, and risk patterns across the supply chain.
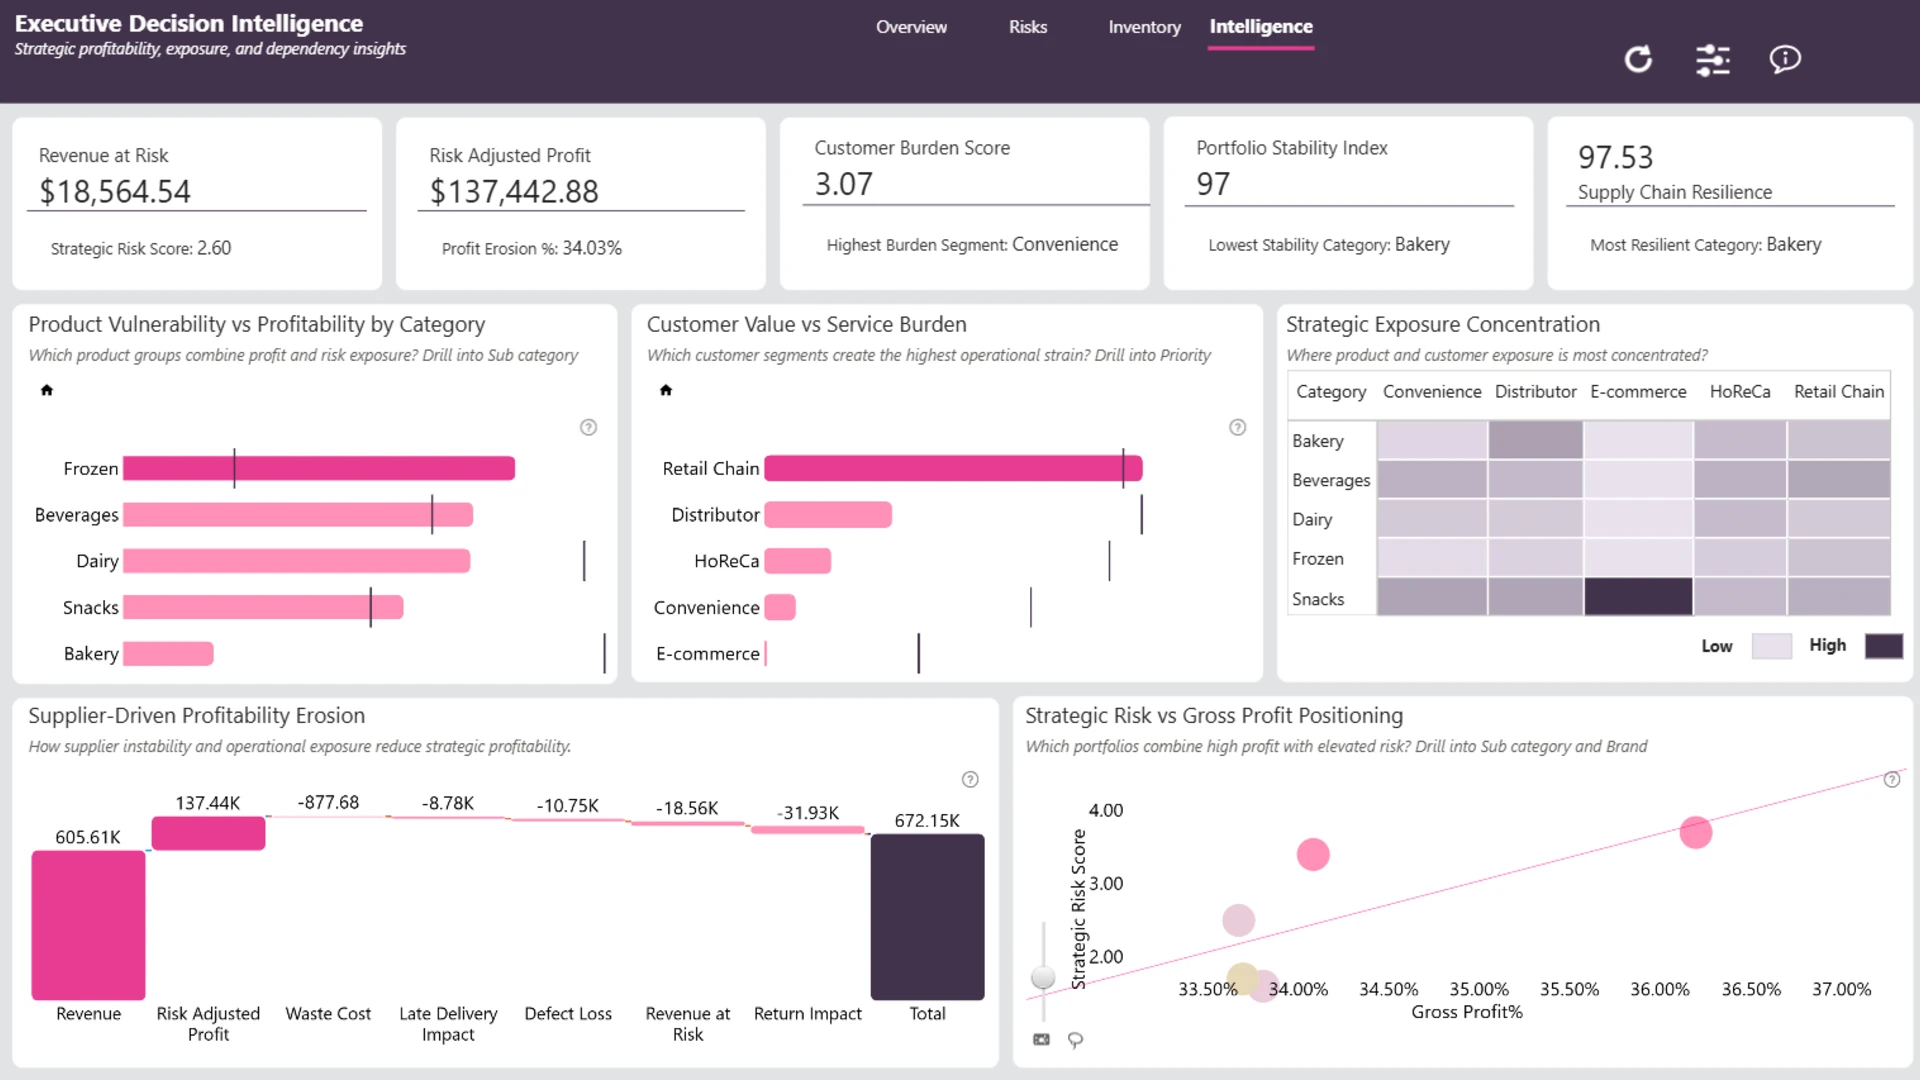
Profitability Impact
Understand how operational challenges affect revenue, gross profit, and customer fulfillment.
Interactive Drill-Down Analysis
Use ZoomCharts Drill Down visuals to move from high-level KPIs into detailed operational views.
Why This Report Is Useful
This report gives operations, logistics, and business leaders a practical way to explore supply chain performance from multiple angles. It is especially useful for supply chain analysis, inventory management, supplier comparison, warehouse monitoring, and food and beverage logistics reporting.
How to Use This Power BI Supply Chain Dashboard
Click to explore
Select any active visual element to filter related supply chain data.
Compare performance
Compare suppliers, warehouses, products, customer channels, and time periods.
Find problem areas
Drill into service issues, stockouts, returns, waste, and late delivery patterns.
Download and Customize
Download the .pbix file to review the report structure, calculations, visuals, and KPI logic. You can customize the dashboard with your own supply chain data to create a logistics, inventory, or supplier performance monitoring solution tailored to your organization.
ZoomCharts visuals used
4U Report Challenges
Participate in data challenges, build and submit reports to get free template downloads.
Join CommunityMobile view allows you to interact with the report. To Download the template please switch to desktop view.
Was this helpful? Thank you for your feedback!
Sorry about that.
How can we improve it?