3114
Comprehensive Supply Chain Performance Dashboard
Comprehensive Supply Chain Performance Dashboard
Report Author: Ankan Bandyopadhyay
3114
Share template with others
Report submitted for Onyx Data DataDNA ZoomCharts Mini Challenge, November 2024. The report is based on the Supply Chain Analysis dataset and includes ZoomCharts custom Drill Down PRO visuals for Power BI.
Author's description:
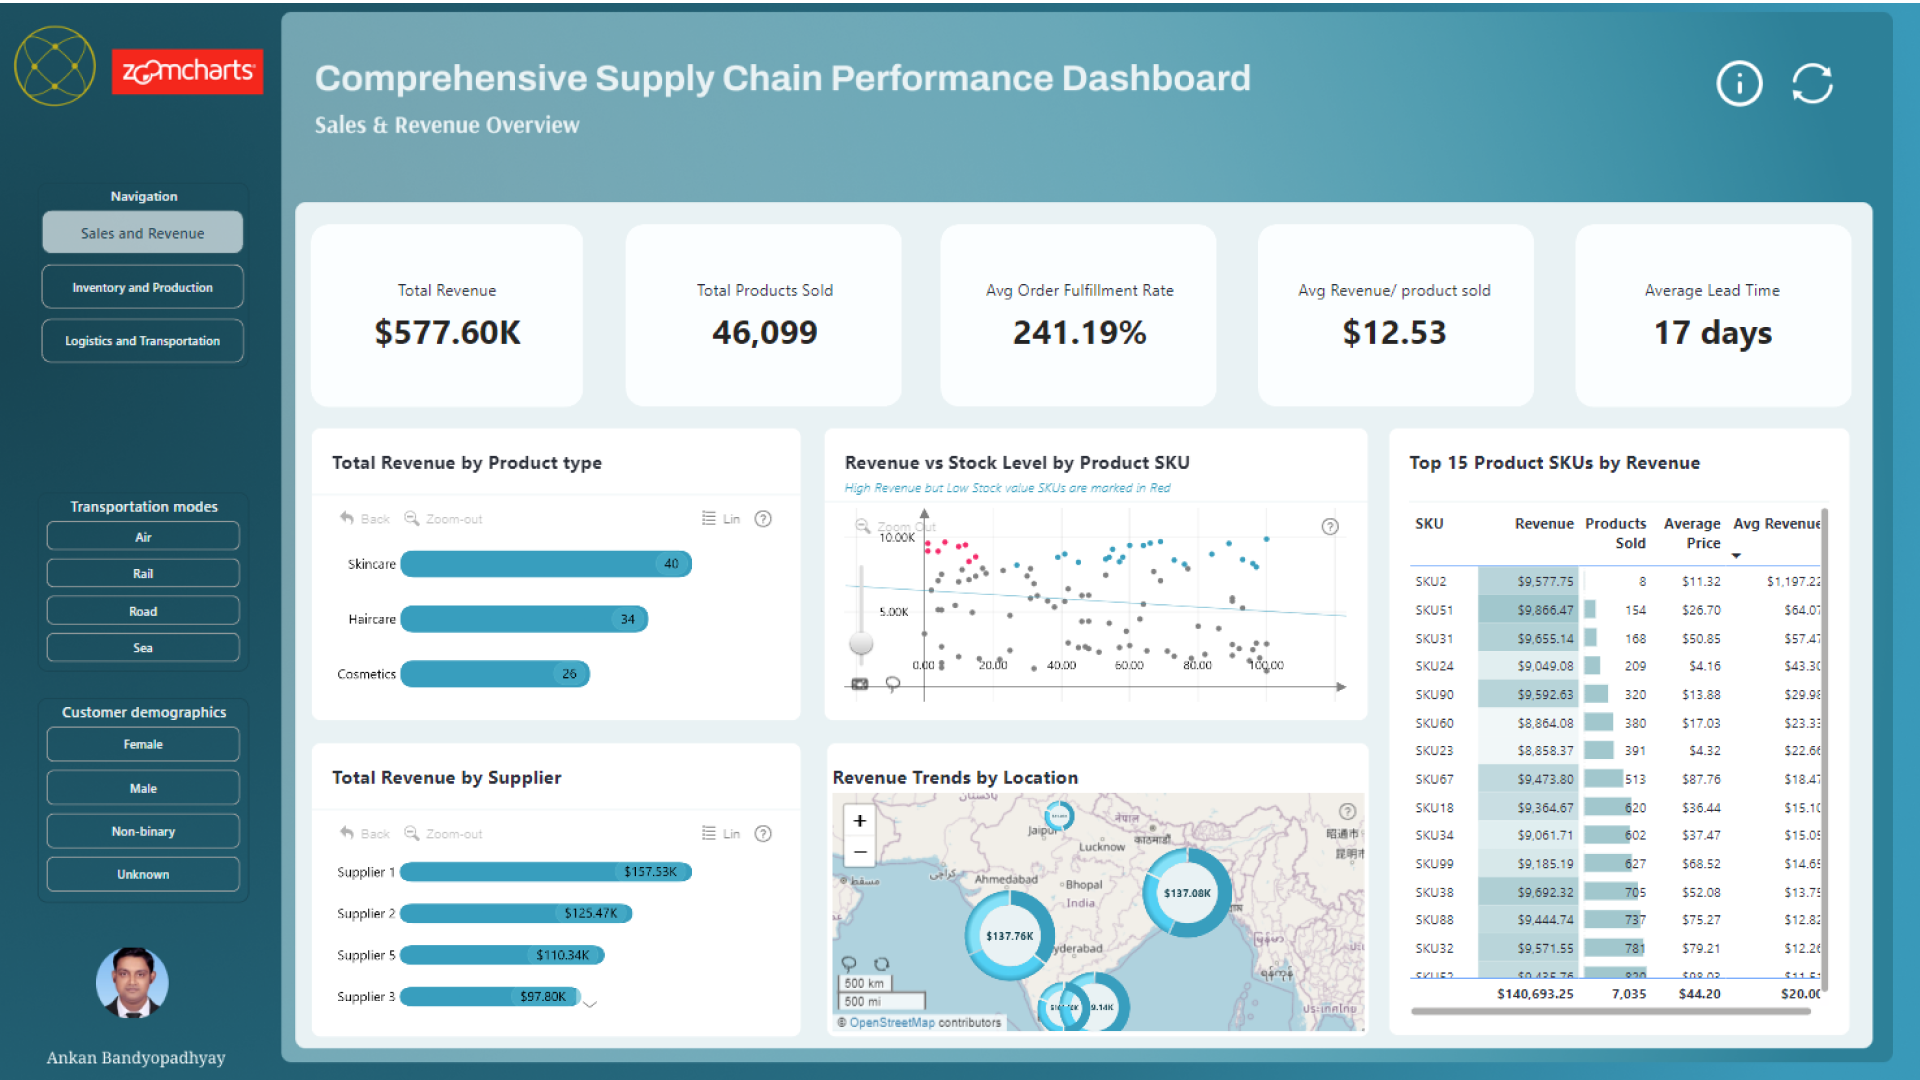
This report provides a comprehensive analysis of the supply chain's key performance areas, including sales, inventory, production, and logistics. The dashboard is designed to help stakeholders make data-driven decisions by offering detailed insights into:
Sales and Revenue: Understand revenue contributions by product type, SKU performance, and overall sales metrics.
Inventory and Production: Evaluate stock levels, manufacturing costs, defect rates, and lead times to optimize operations.
Logistics and Transportation: Analyze supplier locations, shipping costs, and transportation modes to identify cost-saving opportunities and enhance supply chain efficiency.
With interactive visuals and actionable KPIs, the report empowers stakeholders to streamline supply chain processes and drive operational excellence.
ZoomCharts visuals used
4U Report Challenges
Participate in data challenges, build and submit reports to get free template downloads.
Join CommunityMobile view allows you to interact with the report. To Download the template please switch to desktop view.
Was this helpful? Thank you for your feedback!
Sorry about that.
How can we improve it?