logo
For Power BI
  • Products
    • Drill Down Donut Pro Drill Down Donut PRO
    • Drill Down Pie Pro Drill Down Pie PRO
    • Drill TimeSeries Pro Drill Down TimeSeries PRO
    • Drill Combo Pro Drill Down Combo PRO
    • Drill Map Pro Drill Down Map PRO
    • Drill Scatter Pro Drill Down Scatter PRO
    • Drill Down Network Pro Drill Down Network PRO
    • Drill Down Waterfall Pro Drill Down Waterfall PRO
    • Drill Down Graph Pro Drill Down Graph PRO
    • Drill Down Timeline Pro Drill Down Timeline PRO
    • Drill Down Combo Bar PRO Drill Down Combo Bar PRO
    • Drill Down Line PRO Drill Down Line PRO

    Video tutorials

    Watch Now

    More than 90 videos on how to enhance Power BI with ZoomCharts

    Learn more
    All visuals
  • Resources

      Resources

    • Documentation
    • Report Examples
    • Blog
    • Webinars
    • Video Tutorials
    • Visuals Gallery

    Support

    • ZoomCharts Assistance
    • Contact Sales
    • Contact Support
    • FAQ

    Challenges

    Challenges

    Improve your report creation skills by participating in free challenges for report creators.

    Learn more
    Start trial
  • Services
    • Power BI Report Development
    • Custom Visual Development
  • Challenges
  • Pricing
Request a quote Start Free Book a Demo Sign in
Get it now
Go back

Contents

Go back

Aug 06, 2024

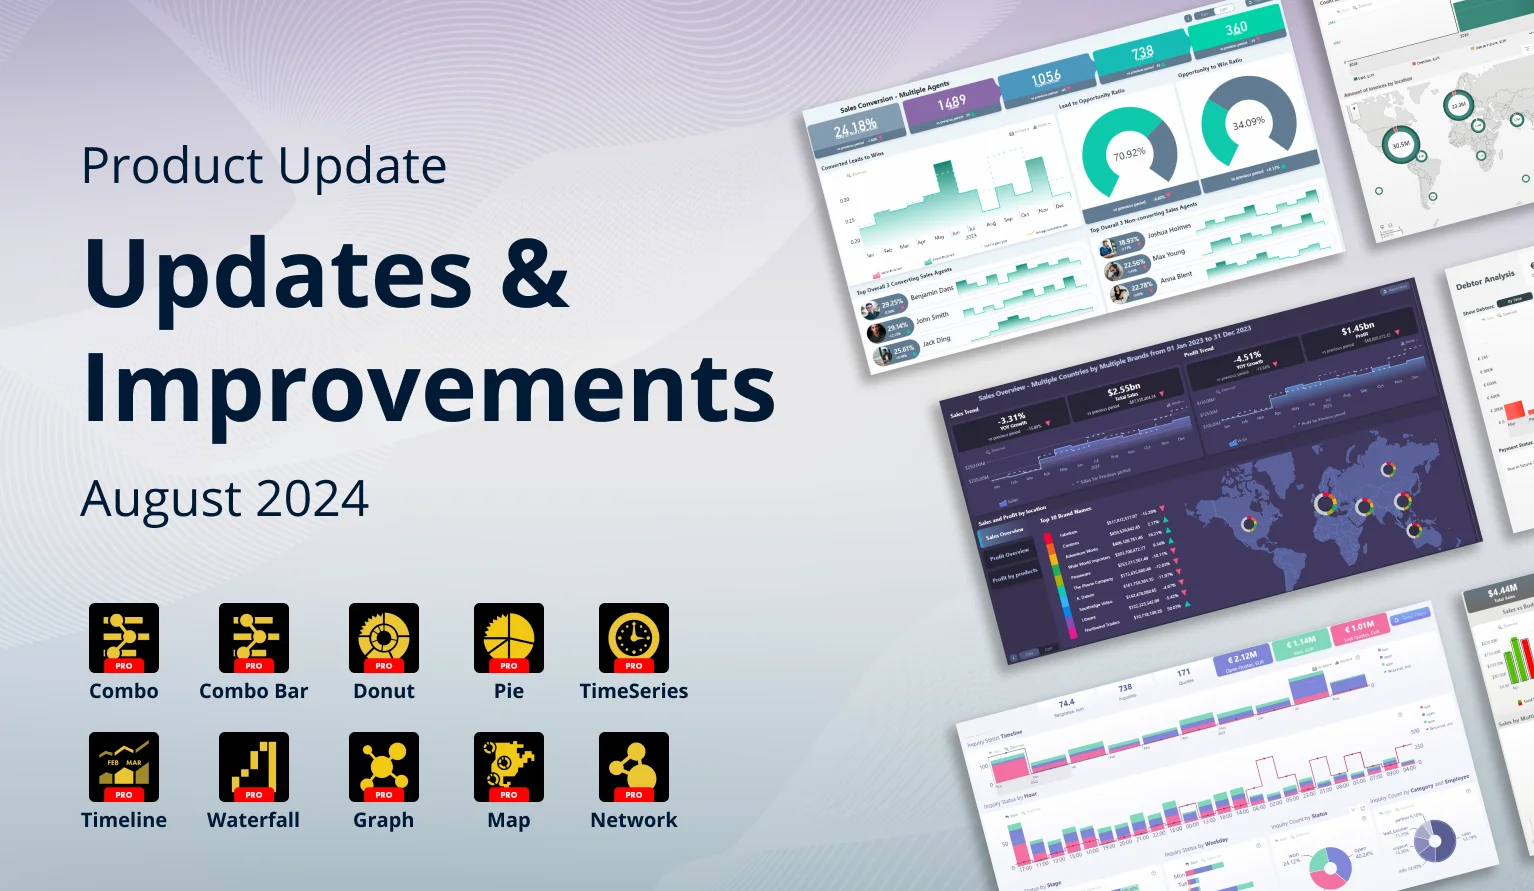
August 2024: Updates and Improvements in ZoomCharts Visuals

We have made several under-the-hood performance and stability improvements for our visuals, introduced a new feature to Pie and Donut visuals, and launched the ZoomCharts Experience Reports development service.

Title image
Title image

We have made several under-the-hood performance and stability improvements for our visuals, introduced a new feature to Pie and Donut visuals, and launched the ZoomCharts Experience Reports development service.

Contents

Share this article

Your visuals should update automatically from AppSource. If you do not see the new features, make sure your visuals are on the latest version by pressing the “?” (Info) button at the top right corner of the visual, or by right-clicking the visual’s icon in the Visualizations pane and opening the About screen.

All Visuals: Power BI Visuals API 5.9.1

ZoomCharts Drill Down Visuals Power BI API version 5.9.1

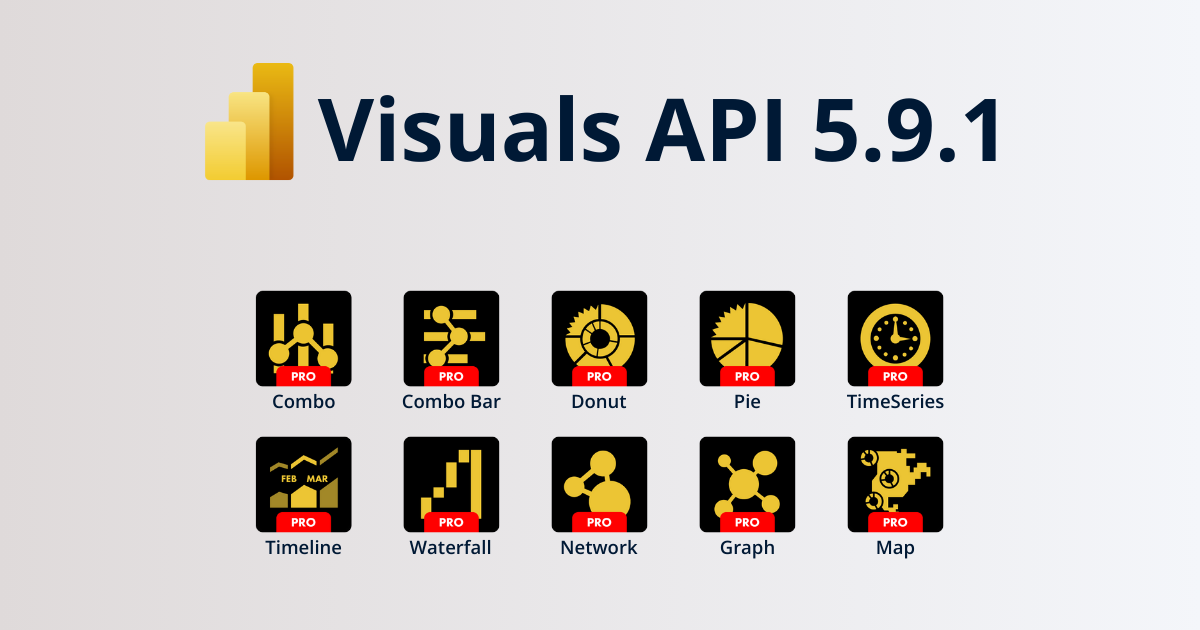
This month, we focused on various under-the-hood improvements to ensure better performance, stability and functionality for our visuals. The largest of these changes is the upgrade to Power BI visuals API version 5.9.1, which will ensure better security, stability, performance and compatibility You can read the API version history here.

Important: Power BI Desktop must be updated to March 2024 or later to ensure that ZoomCharts visuals using Visuals API 5.9.1 work properly. This change affects the following versions and newer:

  • Combo & Combo Bar: 11.34.0
  • Donut & Pie: 11.34.0
  • TimeSeries:11.29.0
  • Timeline: 11.39.0
  • Waterfall: 11.30.0
  • Network: Coming later in August
  • Graph: Coming later in August
  • Map:11.35.0

Pie and Donut: Auto-Drill into Single Slices

ZoomCharts Drill Down Pie and Donut: Auto-Drill into Single Slices

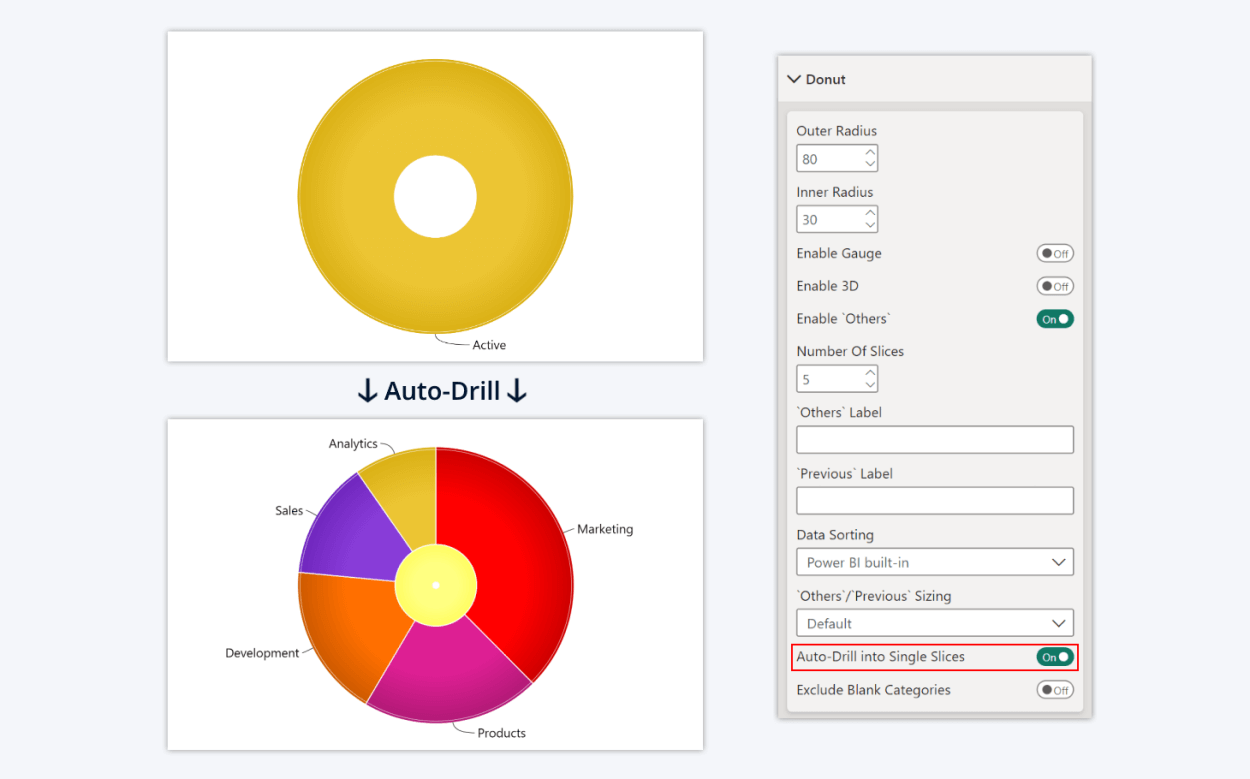
The 1.11.29.0 version of Drill Down Pie PRO and Donut PRO introduces a new toggle – "Auto-Drill into Single Slices”. This setting will only take effect on the initial load of the visual; therefore, it is better suited for drillthrough pages and/or report page tooltips, and it might not be useful for visuals in regular report pages.

If this toggle is enabled, the visual will automatically drill down if the initial view features only one slice. For example, if a drill-through page has a Pie or Donut visual in which one or more levels of drill down hierarchy only have one category, auto-drill will save the users from having to click one or more times by automatically drilling down to a level that contains multiple slices.

New Service: ZoomCharts Experience Reports

We are also excited to offer a new service for businesses – ZoomCharts Experience (ZX) Reports. As part of this package, we will develop a ZX Report tailored specifically to your requirements, provide ZX Report development training for your team, and offer a custom licensing plan for your business.

What are ZoomCharts Experience Reports? With ZX Reports, your business can maximize the ROI from your investment in business intelligence. ZX Reports provide a better and more intuitive user experience, make data exploration faster and more efficient, and produce better, more thorough insights.

In ZX Reports, users can easily drill down from a holistic overview to granular insights with just a few clicks and analyze data from multiple dimensions thanks to seamless cross-filtering between ZoomCharts visuals. Explore live demos of ZX Report examples and try the intuitive user interactions in our Report Gallery!

Maximise your BI ROI with ZoomCharts Experience Reports

envelope icon

Want more info like this?

Subscribe to our newsletter and be the first to read our latest articles and expert data visualization tips!


Find out more

Sep 22, 2020

Blog Thumbnail
Use cases

Use case for a graph visual: mapping subsidiaries of an international organization

ZoomCharts Drill Down Graph PRO offers multiple layout options and unseen level of interaction. In this article we will explore a use case of mapping parent...

Sep 22, 2020

Blog Thumbnail
Use cases

Power BI Email Analysis: How To Visualize Internal Communication

You and your colleagues, most likely, send thousands of emails between each other. You can transform these emails into valuable data by performing a Power BI email analysis. It's a great way to optimize your internal communication channels and identify possible issues, and in this article, we will show you how to do it by using Drill Down Graph PRO.

Feb 26, 2020

Blog Thumbnail
Use cases

Sales overview by product and sales representatives: sample report

Get inspired! Take a look at this sample report and find new ideas for sprucing up your own sales reports in Power BI. Check out interactions, chart...

May 10, 2019

Blog Thumbnail

Reveal your true organizational structure using Drill Down Graph PRO Visual and Power BI

ZoomCharts Drill Down Visuals family has a newcomer – the long-awaited Graph PRO visual. This is the first visual for Microsoft Power BI platform, which enables true graph data visualization, exploration and analysis
  • «
  • 1
  • ...
  • 7
  • 8
  • 9
  • 10
  • 11

Contents

Share this article

Want more info like this?

Subscribe to our newsletter and be the first to read our latest articles and expert data visualization tips!


Thank you!

Check your inbox to verify your email address.

logo
[email protected]
+44 204 577 3993
logo

Products

Drill Down Network PRO Drill Down Waterfall PRO Drill Down Graph PRO Drill Down Combo PRO Drill Down Combo Bar PRO Drill Down Donut PRO Drill Down Pie PRO Drill Down TimeSeries PRO Drill Down Timeline PRO Drill Down Map PRO Drill Down Scatter PRO All Visuals

Resources

Report Examples Webinars Blog ZoomCharts Academy Visuals Gallery Documentation Custom Visual Development Subscribe to News

Solutions

Custom Visual Development

Company

Pricing About Us Partners Leave feedback Join PowerGroup EU Funding

Help

ZoomCharts Assistance Contact Sales Contact Support FAQ

Drill Down Network PRO Drill Down Waterfall PRO Drill Down Graph PRO Drill Down Combo PRO Drill Down Combo Bar PRO Drill Down Donut PRO Drill Down Pie PRO Drill Down TimeSeries PRO Drill Down Timeline PRO Drill Down Map PRO Drill Down Scatter PRO All Visuals

Report Examples Webinars Blog ZoomCharts Academy Visuals Gallery Documentation Custom Visual Development Subscribe to News

Custom Visual Development

Pricing About Us Partners Leave feedback Join PowerGroup EU Funding

ZoomCharts Assistance Contact Sales Contact Support FAQ
+44 204 577 3993
[email protected]

Ready to get in touch?

Contact our experts with any question about Power BI and ZoomCharts for Free!

Contact us

© 2025, Data Visualization Software Lab

U.S. Patents No. 11,645,343; 11,921,804

Cookies Policy
Manage cookies
Privacy Policy
Global
EULA
Patent
warning

Error message

success

Success info: Done!

ZoomCharts AI Assistant

We noticed you're using an old OS version.

For the best experience, we recommend upgrading to ensure that all website features display correctly.

Cookie settings

We use necessary cookies for site functionality, as well as statistic, marketing, and preference cookies to enhance your experience. For more information and to manage your preferences, please visit our Cookie policy