Aug 06, 2024
August 2024: Updates and Improvements in ZoomCharts Visuals
We have made several under-the-hood performance and stability improvements for our visuals, introduced a new feature to Pie and Donut visuals, and launched the ZoomCharts Experience Reports development service.
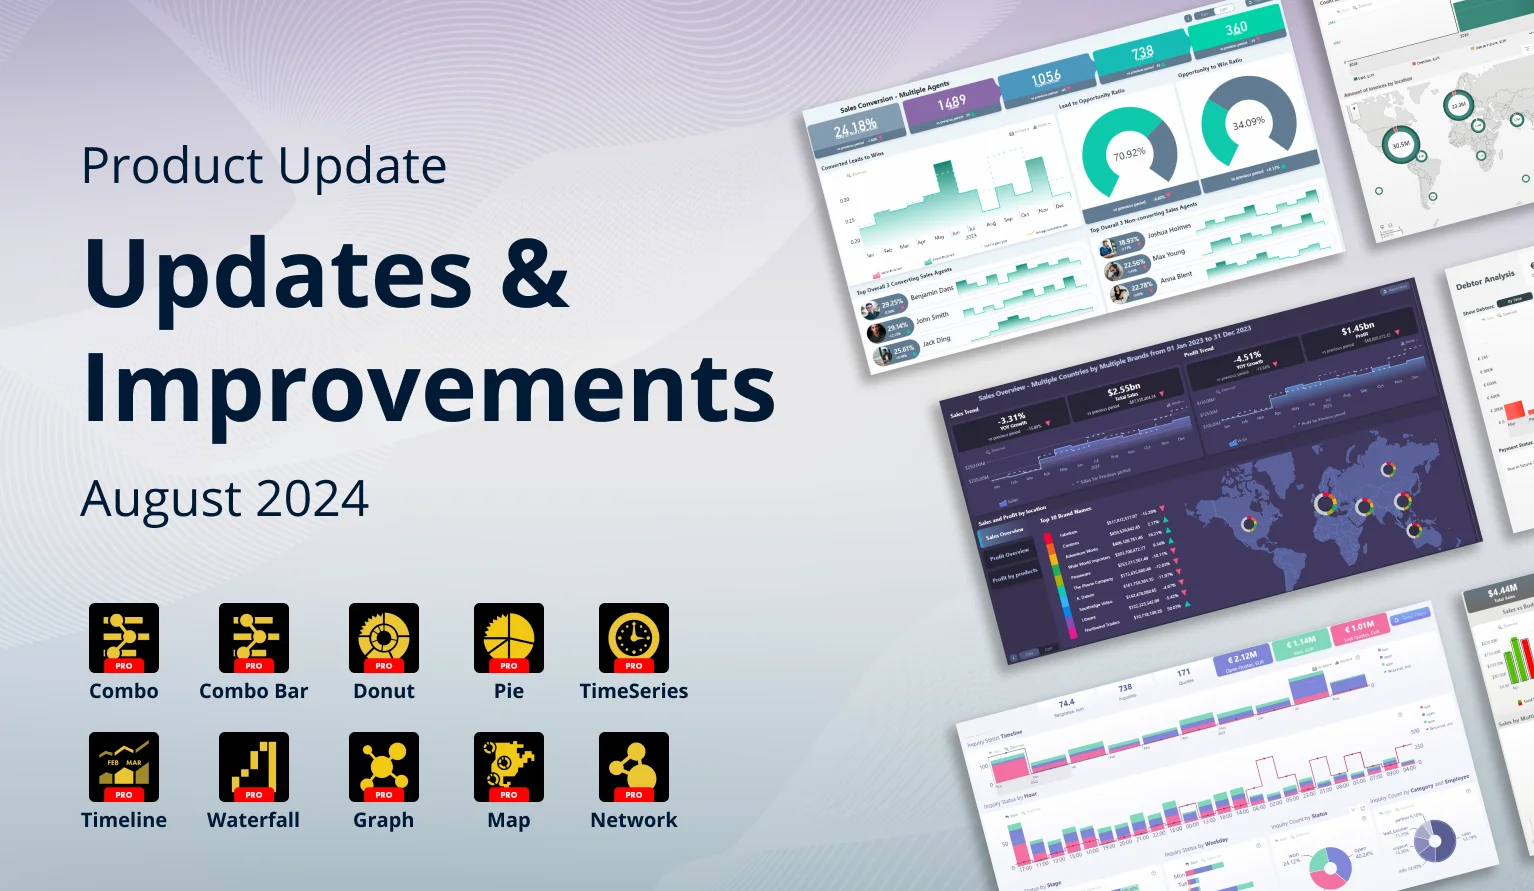

We have made several under-the-hood performance and stability improvements for our visuals, introduced a new feature to Pie and Donut visuals, and launched the ZoomCharts Experience Reports development service.
Your visuals should update automatically from AppSource. If you do not see the new features, make sure your visuals are on the latest version by pressing the “?” (Info) button at the top right corner of the visual, or by right-clicking the visual’s icon in the Visualizations pane and opening the About screen.
All Visuals: Power BI Visuals API 5.9.1
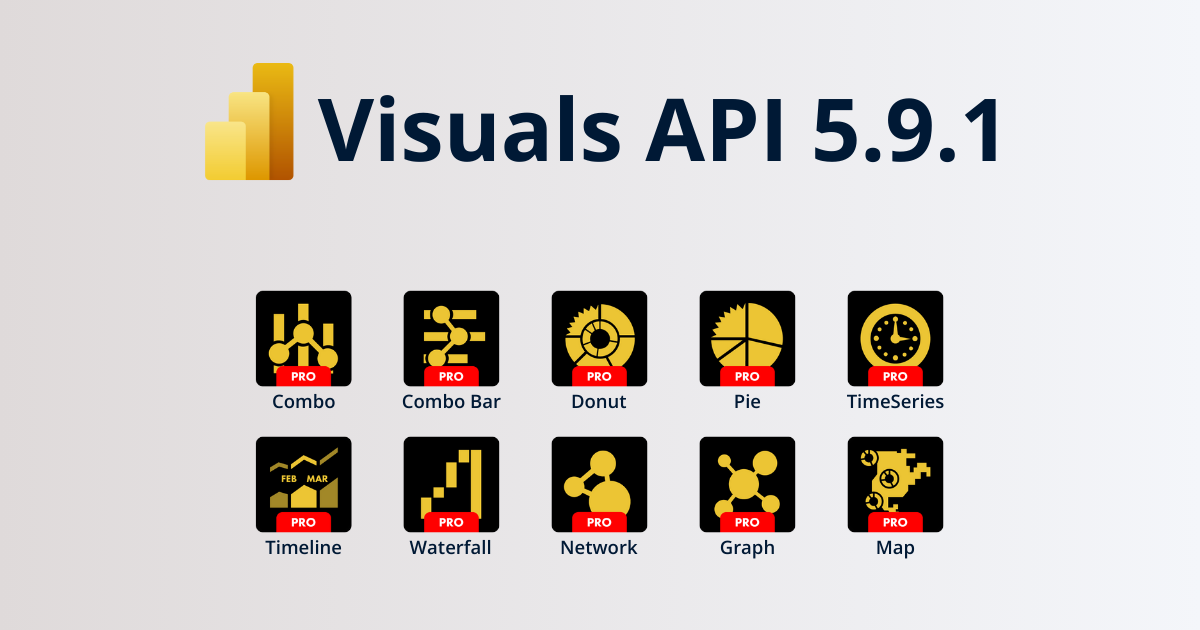
This month, we focused on various under-the-hood improvements to ensure better performance, stability and functionality for our visuals. The largest of these changes is the upgrade to Power BI visuals API version 5.9.1, which will ensure better security, stability, performance and compatibility You can read the API version history here.
Important: Power BI Desktop must be updated to March 2024 or later to ensure that ZoomCharts visuals using Visuals API 5.9.1 work properly. This change affects the following versions and newer:
- Combo & Combo Bar: 11.34.0
- Donut & Pie: 11.34.0
- TimeSeries:11.29.0
- Timeline: 11.39.0
- Waterfall: 11.30.0
- Network: Coming later in August
- Graph: Coming later in August
- Map:11.35.0
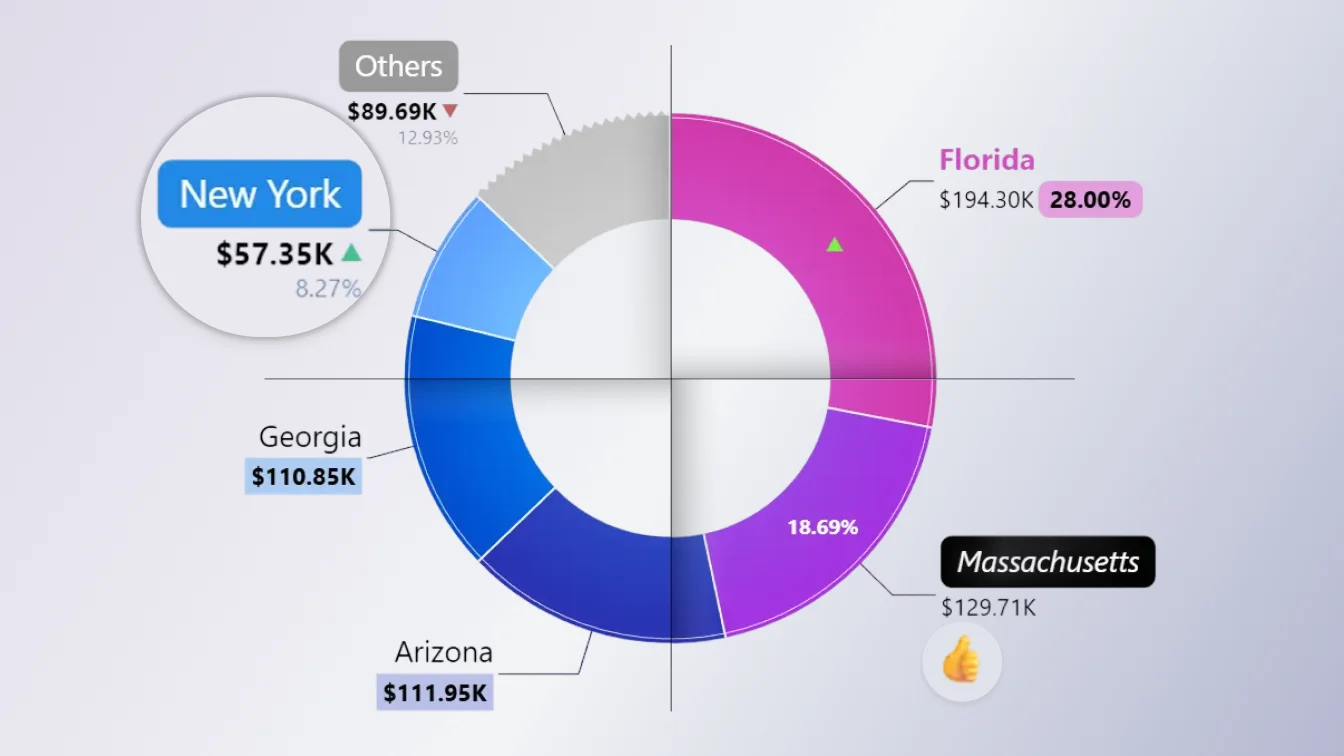
Pie and Donut: Auto-Drill into Single Slices
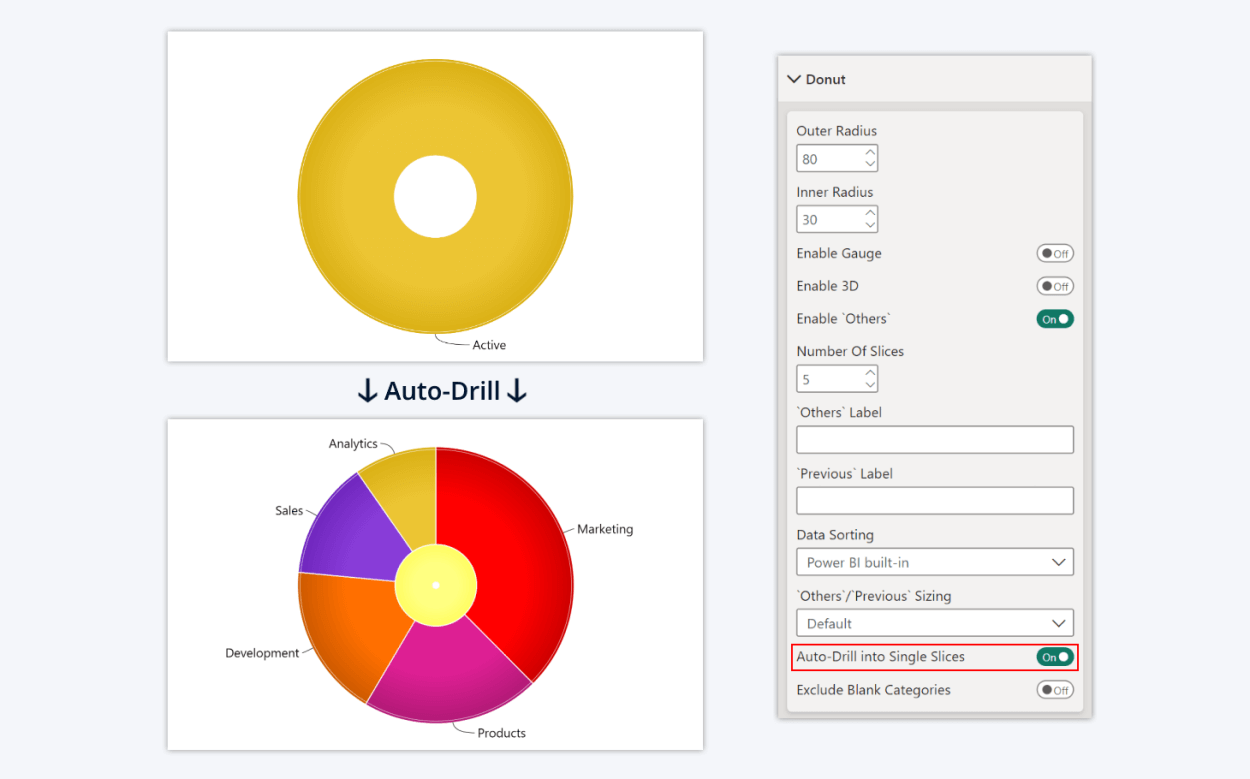
The 1.11.29.0 version of Drill Down Pie PRO and Donut PRO introduces a new toggle – "Auto-Drill into Single Slices”. This setting will only take effect on the initial load of the visual; therefore, it is better suited for drillthrough pages and/or report page tooltips, and it might not be useful for visuals in regular report pages.
If this toggle is enabled, the visual will automatically drill down if the initial view features only one slice. For example, if a drill-through page has a Pie or Donut visual in which one or more levels of drill down hierarchy only have one category, auto-drill will save the users from having to click one or more times by automatically drilling down to a level that contains multiple slices.
New Service: ZoomCharts Experience Reports
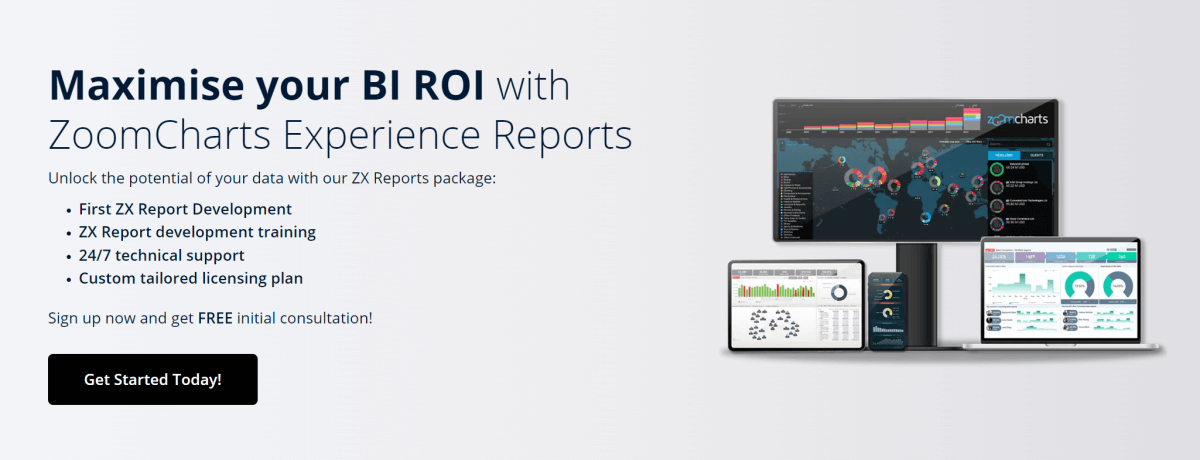
We are also excited to offer a new service for businesses – ZoomCharts Experience (ZX) Reports. As part of this package, we will develop a ZX Report tailored specifically to your requirements, provide ZX Report development training for your team, and offer a custom licensing plan for your business.
What are ZoomCharts Experience Reports? With ZX Reports, your business can maximize the ROI from your investment in business intelligence. ZX Reports provide a better and more intuitive user experience, make data exploration faster and more efficient, and produce better, more thorough insights.
In ZX Reports, users can easily drill down from a holistic overview to granular insights with just a few clicks and analyze data from multiple dimensions thanks to seamless cross-filtering between ZoomCharts visuals. Explore live demos of ZX Report examples and try the intuitive user interactions in our Report Gallery!

Want more info like this?
Subscribe to our newsletter and be the first to read our latest articles and expert data visualization tips!
