logo
For Power BI
  • Products
    • Drill Down Donut Pro Drill Down Donut PRO
    • Drill Down Pie Pro Drill Down Pie PRO
    • Drill TimeSeries Pro Drill Down TimeSeries PRO
    • Drill Combo Pro Drill Down Combo PRO
    • Drill Map Pro Drill Down Map PRO
    • Drill Scatter Pro Drill Down Scatter PRO
    • Drill Down Network Pro Drill Down Network PRO
    • Drill Down Waterfall Pro Drill Down Waterfall PRO
    • Drill Down Graph Pro Drill Down Graph PRO
    • Drill Down Timeline Pro Drill Down Timeline PRO
    • Drill Down Combo Bar PRO Drill Down Combo Bar PRO
    • Drill Down Line PRO Drill Down Line PRO

    Video tutorials

    Watch Now

    More than 90 videos on how to enhance Power BI with ZoomCharts

    Learn more
    All visuals
  • Resources

      Resources

    • Documentation
    • Report Examples
    • Blog
    • Webinars
    • Video Tutorials
    • Visuals Gallery

    Support

    • ZoomCharts Assistance
    • Contact Sales
    • Contact Support
    • FAQ

    Challenges

    Challenges

    Improve your report creation skills by participating in free challenges for report creators.

    Learn more
    Start trial
  • Services
    • Power BI Report Development
    • Custom Visual Development
  • Challenges
  • Pricing
Request a quote Start Free Book a Demo Sign in
Get it now
Go back

Contents

Go back

Aug 06, 2024

August 2024: Updates and Improvements in ZoomCharts Visuals

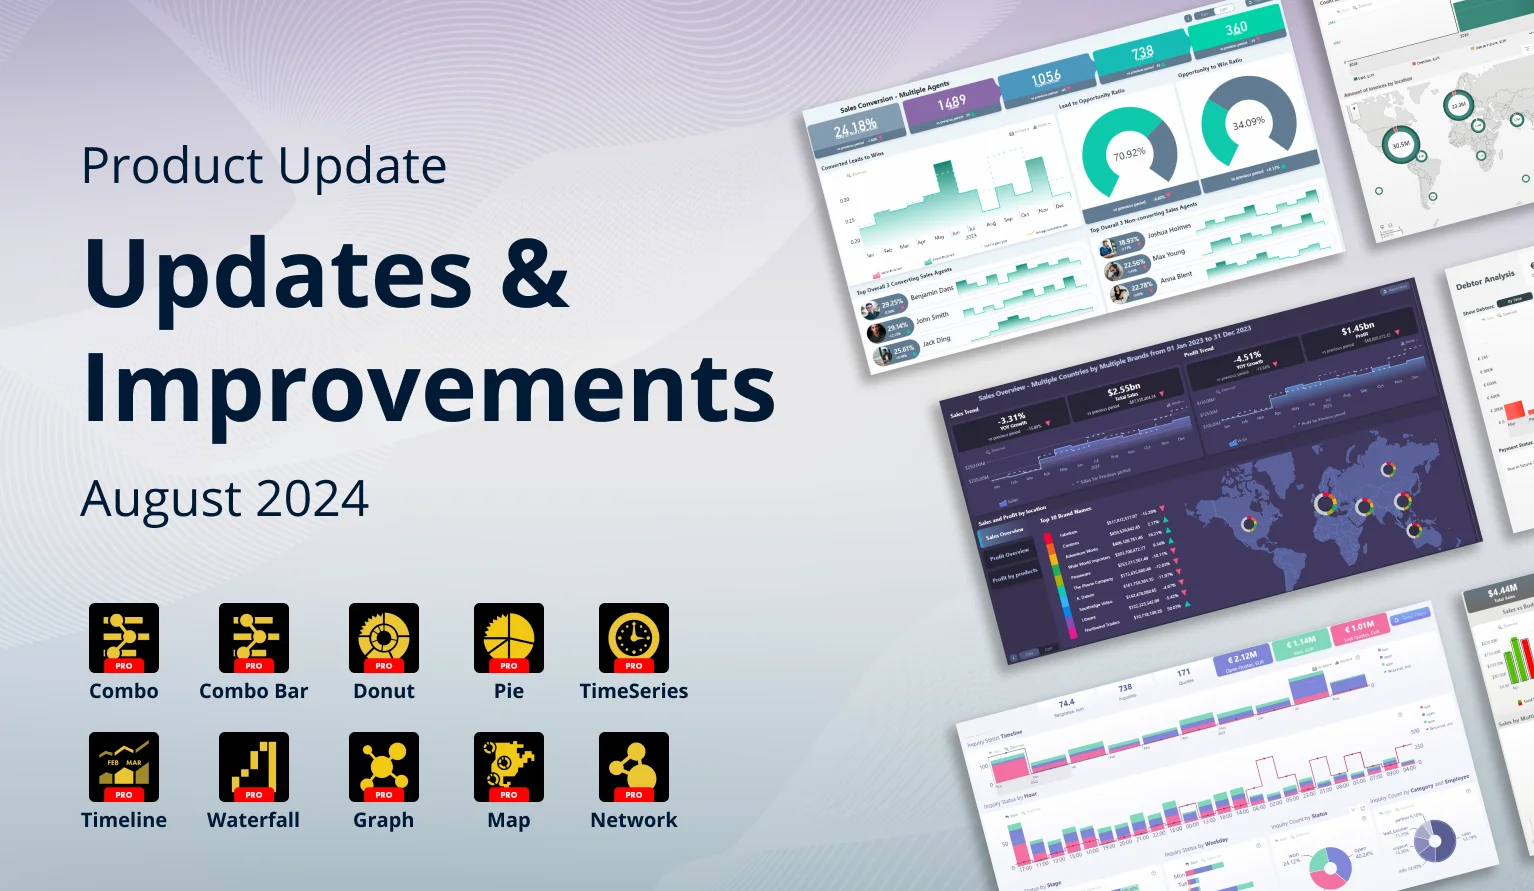
We have made several under-the-hood performance and stability improvements for our visuals, introduced a new feature to Pie and Donut visuals, and launched the ZoomCharts Experience Reports development service.
Title image
Title image

We have made several under-the-hood performance and stability improvements for our visuals, introduced a new feature to Pie and Donut visuals, and launched the ZoomCharts Experience Reports development service.

Contents

Share this article

Your visuals should update automatically from AppSource. If you do not see the new features, make sure your visuals are on the latest version by pressing the “?” (Info) button at the top right corner of the visual, or by right-clicking the visual’s icon in the Visualizations pane and opening the About screen.

All Visuals: Power BI Visuals API 5.9.1
ZoomCharts Drill Down Visuals Power BI API version 5.9.1

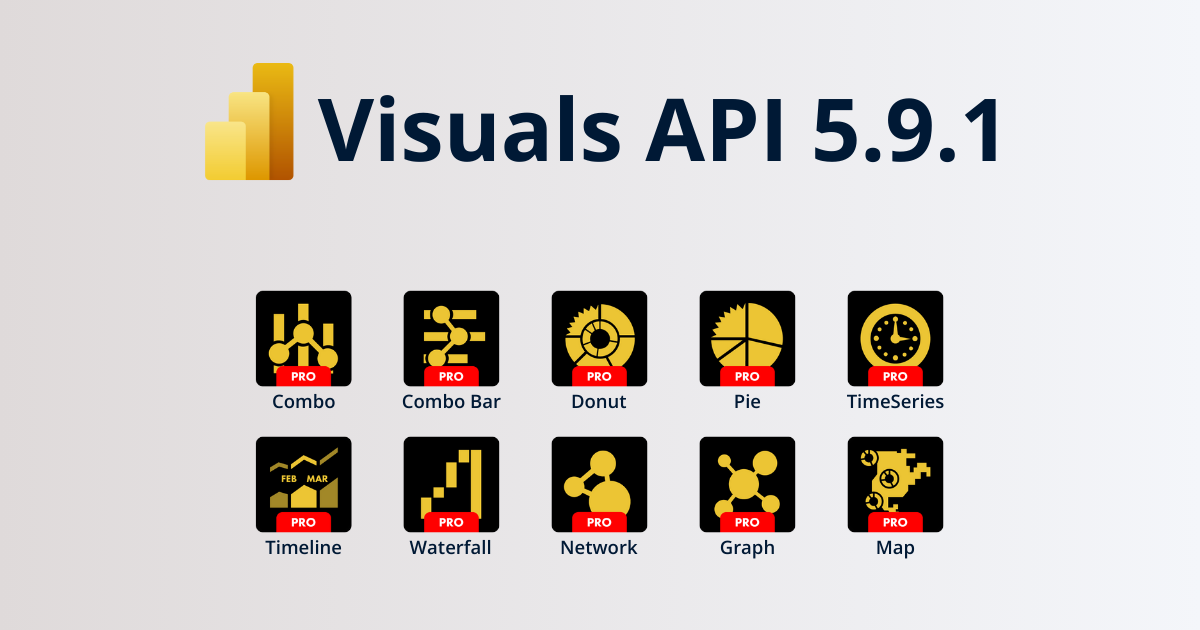
This month, we focused on various under-the-hood improvements to ensure better performance, stability and functionality for our visuals. The largest of these changes is the upgrade to Power BI visuals API version 5.9.1, which will ensure better security, stability, performance and compatibility You can read the API version history here.

Important: Power BI Desktop must be updated to March 2024 or later to ensure that ZoomCharts visuals using Visuals API 5.9.1 work properly. This change affects the following versions and newer:

  • Combo & Combo Bar: 11.34.0
  • Donut & Pie: 11.34.0
  • TimeSeries:11.29.0
  • Timeline: 11.39.0
  • Waterfall: 11.30.0
  • Network: Coming later in August
  • Graph: Coming later in August
  • Map:11.35.0

Pie and Donut: Auto-Drill into Single Slices
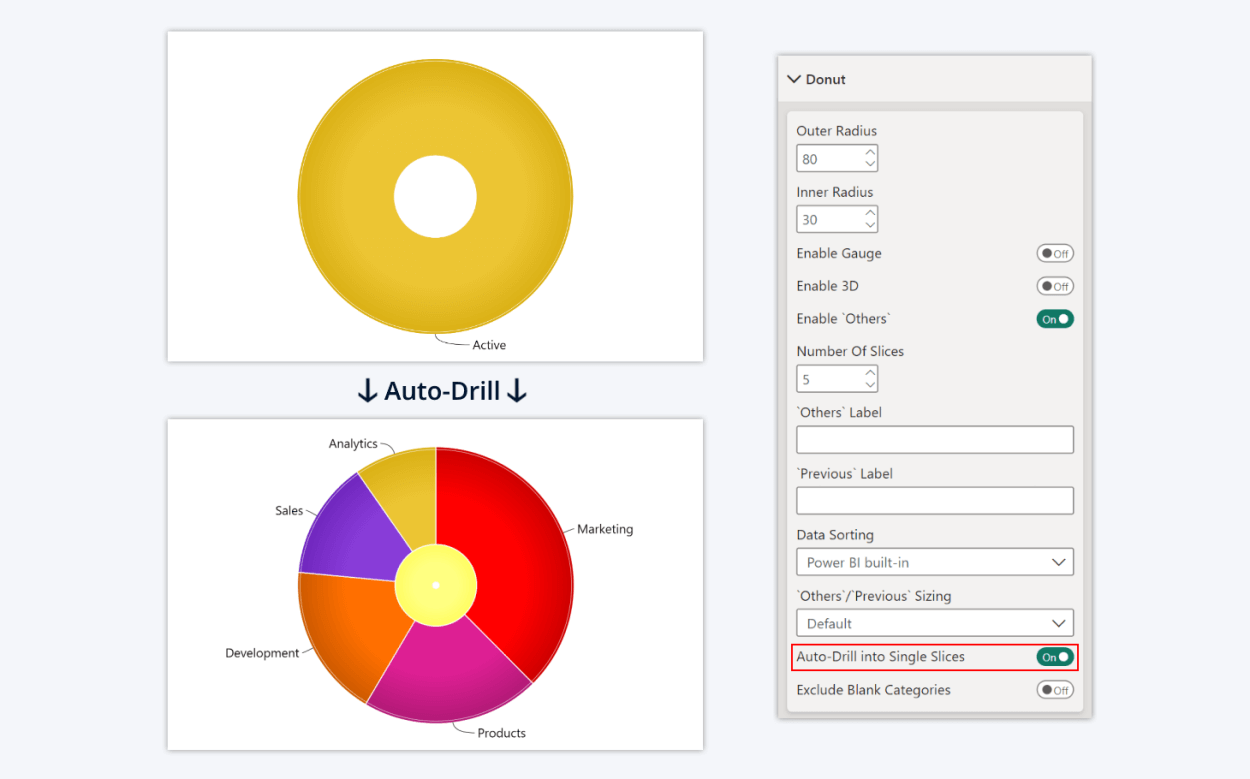
ZoomCharts Drill Down Pie and Donut: Auto-Drill into Single Slices

The 1.11.29.0 version of Drill Down Pie PRO and Donut PRO introduces a new toggle – "Auto-Drill into Single Slices”. This setting will only take effect on the initial load of the visual; therefore, it is better suited for drillthrough pages and/or report page tooltips, and it might not be useful for visuals in regular report pages.

If this toggle is enabled, the visual will automatically drill down if the initial view features only one slice. For example, if a drill-through page has a Pie or Donut visual in which one or more levels of drill down hierarchy only have one category, auto-drill will save the users from having to click one or more times by automatically drilling down to a level that contains multiple slices.

New Service: ZoomCharts Experience Reports

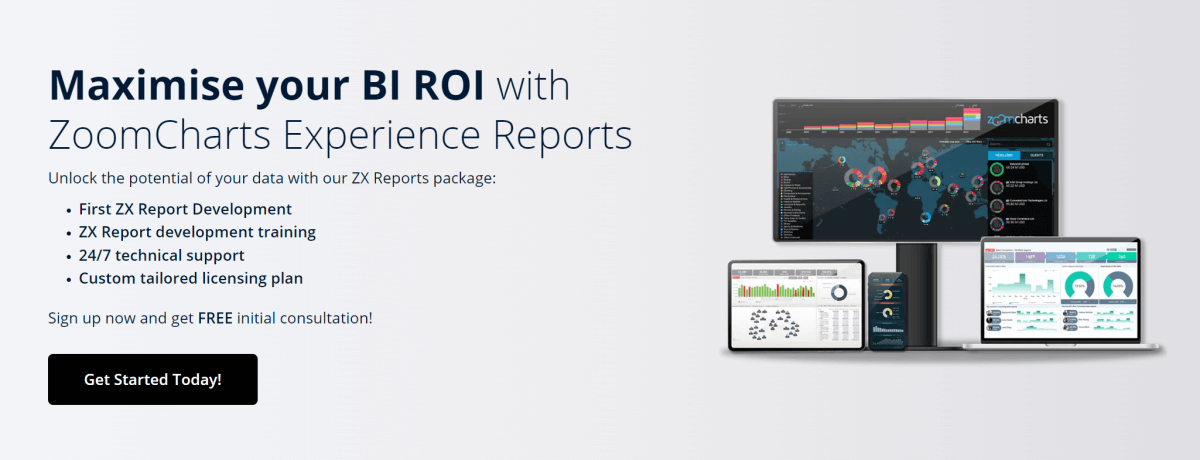
We are also excited to offer a new service for businesses – ZoomCharts Experience (ZX) Reports. As part of this package, we will develop a ZX Report tailored specifically to your requirements, provide ZX Report development training for your team, and offer a custom licensing plan for your business.

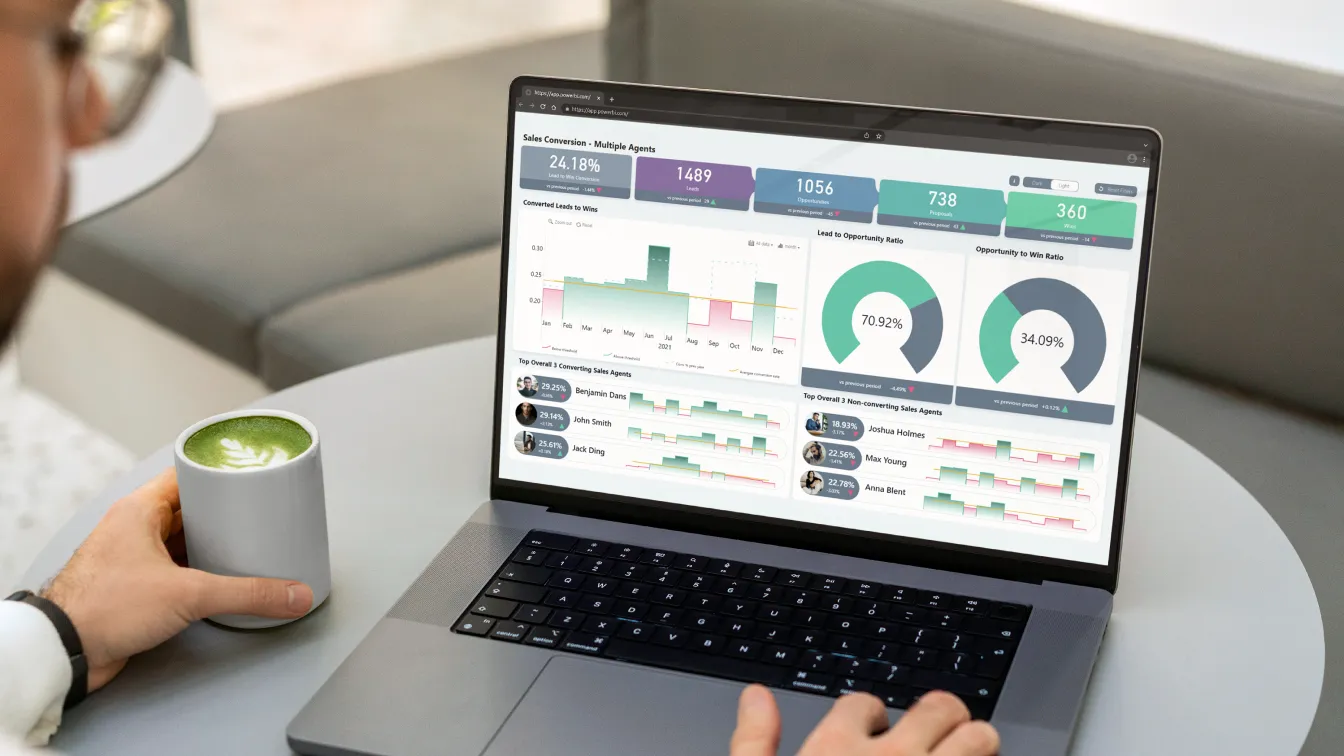
What are ZoomCharts Experience Reports? With ZX Reports, your business can maximize the ROI from your investment in business intelligence. ZX Reports provide a better and more intuitive user experience, make data exploration faster and more efficient, and produce better, more thorough insights.

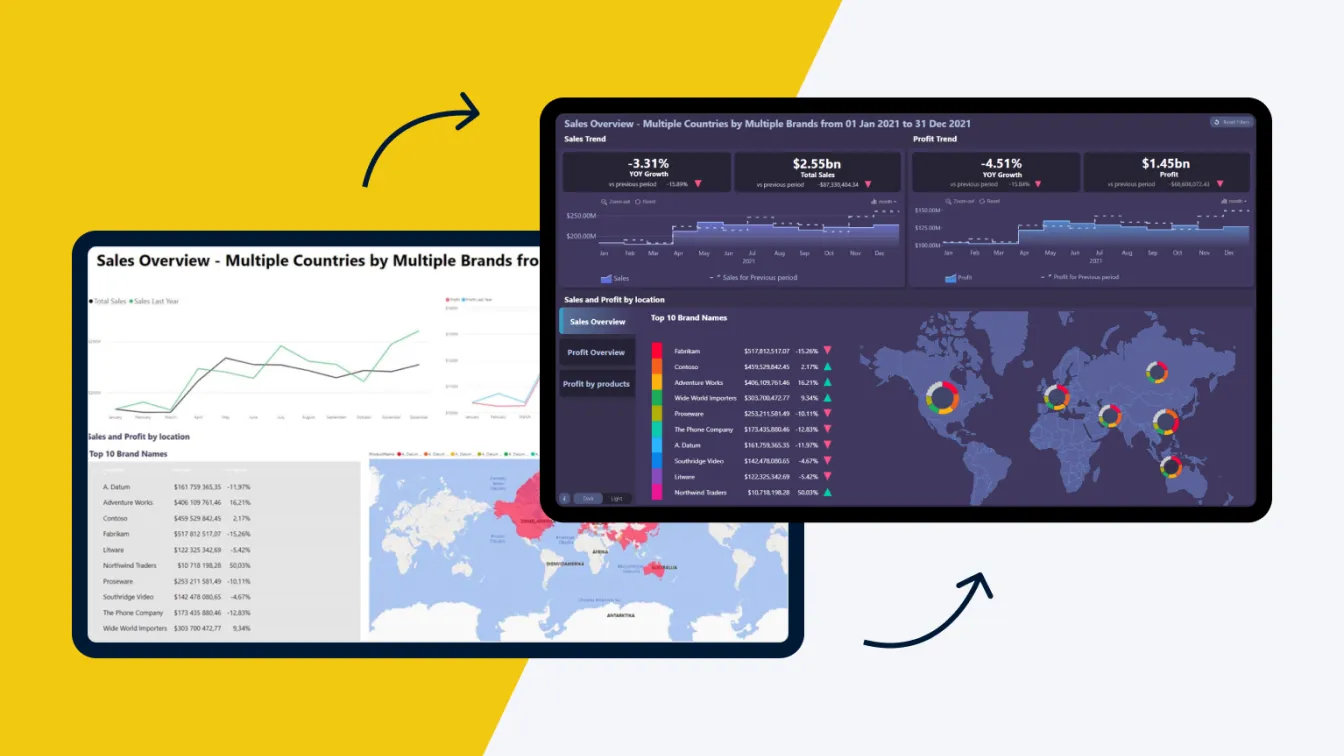
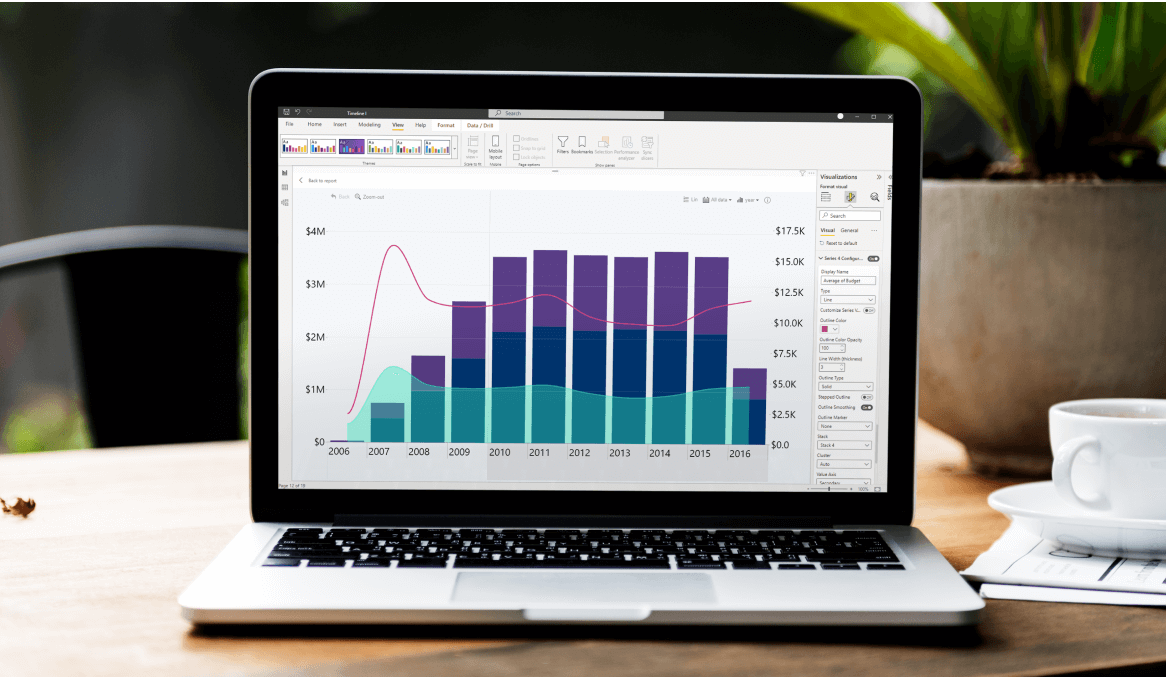
In ZX Reports, users can easily drill down from a holistic overview to granular insights with just a few clicks and analyze data from multiple dimensions thanks to seamless cross-filtering between ZoomCharts visuals. Explore live demos of ZX Report examples and try the intuitive user interactions in our Report Gallery!

Maximise your BI ROI with ZoomCharts Experience Reports

envelope icon

Want more info like this?

Subscribe to our newsletter and be the first to read our latest articles and expert data visualization tips!
Find out more

Dec 16, 2021

Blog Thumbnail

How We Turned Many Excel Files Into an Interactive Power BI Report about Latvia’s Export landscape

How We Turned an Excel Sheet Into an Interactive Report: Latvia Export Barometer. ZoomCharts took part in a widescale project that created a full report of...

Sep 04, 2022

Blog Thumbnail
Guides

Power BI Donut Chart

The donut and pie charts are some of the most ubiquitous charts around. Instantly recognizable by people who have very little to do with charts, every report creator is bound to have to include a Power BI donut chart into a report at some point. This is not a commentary on whether you should love or hate donut charts, but rather a guide on getting the most out of donut and pie charts. Strap in tight, we're going to go over the whys, hows, do's and don'ts of Power BI donut charts.

Aug 30, 2021

Blog Thumbnail
Guides

Business Intelligence Implementation: A Complete Guide

It's no secret that the leading organizations of the world don't take any chances when it comes to business strategy - they use business intelligence to make data-driven decisions. Just like a sports team needs a coach or an army needs a strategist to achieve victory, your can reach your business goals more efficiently with the help of a robust BI system and expert BI analysts.

Sep 02, 2022

Blog Thumbnail
Pro reports

Power BI Design Tips: Make Your Reports More Efficient

What are some of the best design practices and most important tips for designing a great Power BI dashboard? How can you design a report that is both appealing and efficient at conveying business information? Learn more in this article!

Sep 07, 2022

Blog Thumbnail
Pro reports

Top 5 Best Power BI Report Design Practices

First impressions matter, even when you're creating Power BI reports. When your users open your report for the first time, they need to be presented with good-looking visuals that present data in an easy-to-read way, otherwise they'll leave confused and with more questions than before.

Aug 31, 2022

Blog Thumbnail
Guides

Tips and Tricks for Power BI Map visualizations

Maps are one of the most important data visualizations for businesses these days. With the rise of globalization, companies are looking to expand and transcend borders. This makes it necessary to track and analyze data on a geographic level, presenting a new element of map visualization when making data-driven decisions.
  • «
  • 1
  • ...
  • 6
  • 7
  • 8
  • 9
  • 10
  • 11
  • »

Contents

Share this article

Want more info like this?

Subscribe to our newsletter and be the first to read our latest articles and expert data visualization tips!


Thank you!

Check your inbox to verify your email address.

logo
[email protected]
+44 204 577 3993
logo

Products

Drill Down Network PRO Drill Down Waterfall PRO Drill Down Graph PRO Drill Down Combo PRO Drill Down Combo Bar PRO Drill Down Donut PRO Drill Down Pie PRO Drill Down TimeSeries PRO Drill Down Timeline PRO Drill Down Map PRO Drill Down Scatter PRO All Visuals

Resources

Report Examples Webinars Blog ZoomCharts Academy Visuals Gallery Documentation Custom Visual Development Subscribe to News

Solutions

Custom Visual Development

Company

Pricing About Us Partners Leave feedback Join PowerGroup EU Funding

Help

ZoomCharts Assistance Contact Sales Contact Support FAQ

Drill Down Network PRO Drill Down Waterfall PRO Drill Down Graph PRO Drill Down Combo PRO Drill Down Combo Bar PRO Drill Down Donut PRO Drill Down Pie PRO Drill Down TimeSeries PRO Drill Down Timeline PRO Drill Down Map PRO Drill Down Scatter PRO All Visuals

Report Examples Webinars Blog ZoomCharts Academy Visuals Gallery Documentation Custom Visual Development Subscribe to News

Custom Visual Development

Pricing About Us Partners Leave feedback Join PowerGroup EU Funding

ZoomCharts Assistance Contact Sales Contact Support FAQ
+44 204 577 3993
[email protected]

Ready to get in touch?

Contact our experts with any question about Power BI and ZoomCharts for Free!

Contact us

© 2025, Data Visualization Software Lab

U.S. Patents No. 11,645,343; 11,921,804

Cookies Policy
Manage cookies
Privacy Policy
Global
EULA
Patent
warning

Error message

success

Success info: Done!

ZoomCharts AI Assistant

We noticed you're using an old OS version.

For the best experience, we recommend upgrading to ensure that all website features display correctly.

Cookie settings

We use necessary cookies for site functionality, as well as statistic, marketing, and preference cookies to enhance your experience. For more information and to manage your preferences, please visit our Cookie policy