logo
For Power BI
  • Products
    • Drill Down Donut Pro Drill Down Donut PRO
    • Drill Down Pie Pro Drill Down Pie PRO
    • Drill TimeSeries Pro Drill Down TimeSeries PRO
    • Drill Combo Pro Drill Down Combo PRO
    • Drill Map Pro Drill Down Map PRO
    • Drill Scatter Pro Drill Down Scatter PRO
    • Drill Down Network Pro Drill Down Network PRO
    • Drill Down Waterfall Pro Drill Down Waterfall PRO
    • Drill Down Graph Pro Drill Down Graph PRO
    • Drill Down Timeline Pro Drill Down Timeline PRO
    • Drill Down Combo Bar PRO Drill Down Combo Bar PRO
    • Drill Down Line PRO Drill Down Line PRO

    Video tutorials

    Watch Now

    More than 90 videos on how to enhance Power BI with ZoomCharts

    Learn more
    All visuals
  • Resources

      Resources

    • Documentation
    • Report Examples
    • Blog
    • Webinars
    • Video Tutorials
    • Visuals Gallery

    Support

    • ZoomCharts Assistance
    • Contact Sales
    • Contact Support
    • FAQ

    Challenges

    Challenges

    Improve your report creation skills by participating in free challenges for report creators.

    Learn more
    Start trial
  • Services
    • Power BI Report Development
    • Custom Visual Development
  • Challenges
  • Pricing
Request a quote Start Free Book a Demo Sign in
Get it now
Go back

Contents

Go back

Jul 15, 2025

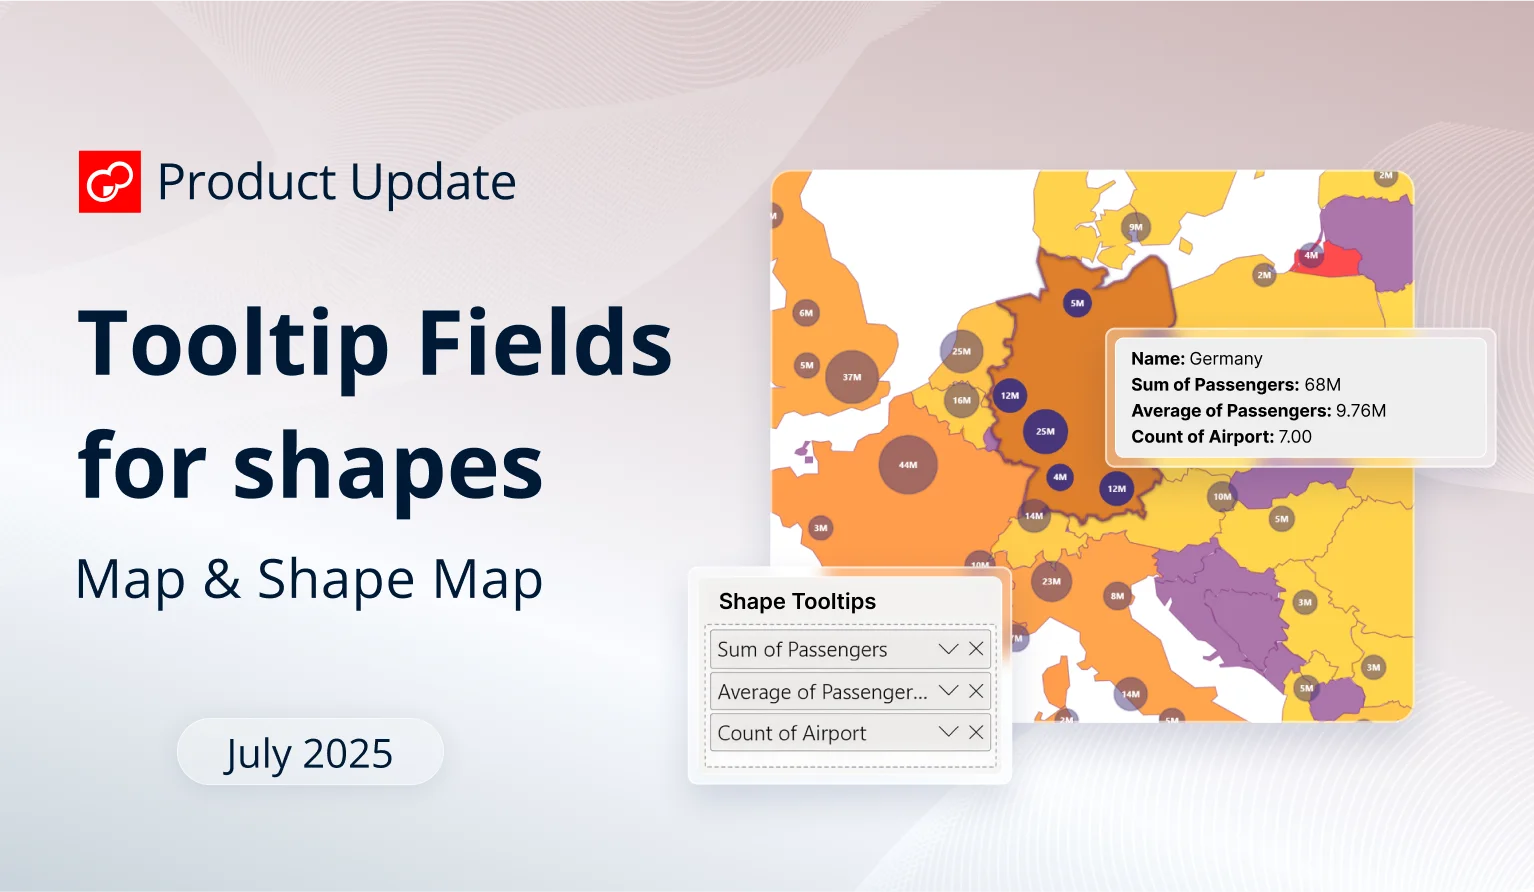
July 2025 Update: Tooltip Fields for Map Shapes

The latest ZoomCharts update brings a new field to Map and Shape Map visuals, which allows you to display columns or measures in shape tooltips for additional insights.

Title image
Title image

The latest ZoomCharts update brings a new field to Map and Shape Map visuals, which allows you to display columns or measures in shape tooltips for additional insights.

Contents

Share this article

While our main focus for the past months has been the launch of two new visuals – the recently released Drill Down Line PRO, and a new visual which is coming soon (stay tuned!), we’ve also made continuous improvements to our existing line-up.

Most of it has been various bugfixes (for example, we’ve resolved the issue that prevented applying different node outline types for Graph and Scatter). We also implemented support for Power BI Modern visual tooltips, and done other under-the-hood improvements. Let’s go through the highlights of the most recent ZoomCharts release!

Your visuals should update automatically from AppSource. If your visuals have not received the updates automatically, read this documentation article that explains the manual update process.

Map, Shape Map: New Field for 'Shape Tooltip'

Shape Tooltip field in Power BI Drill Down Map visual

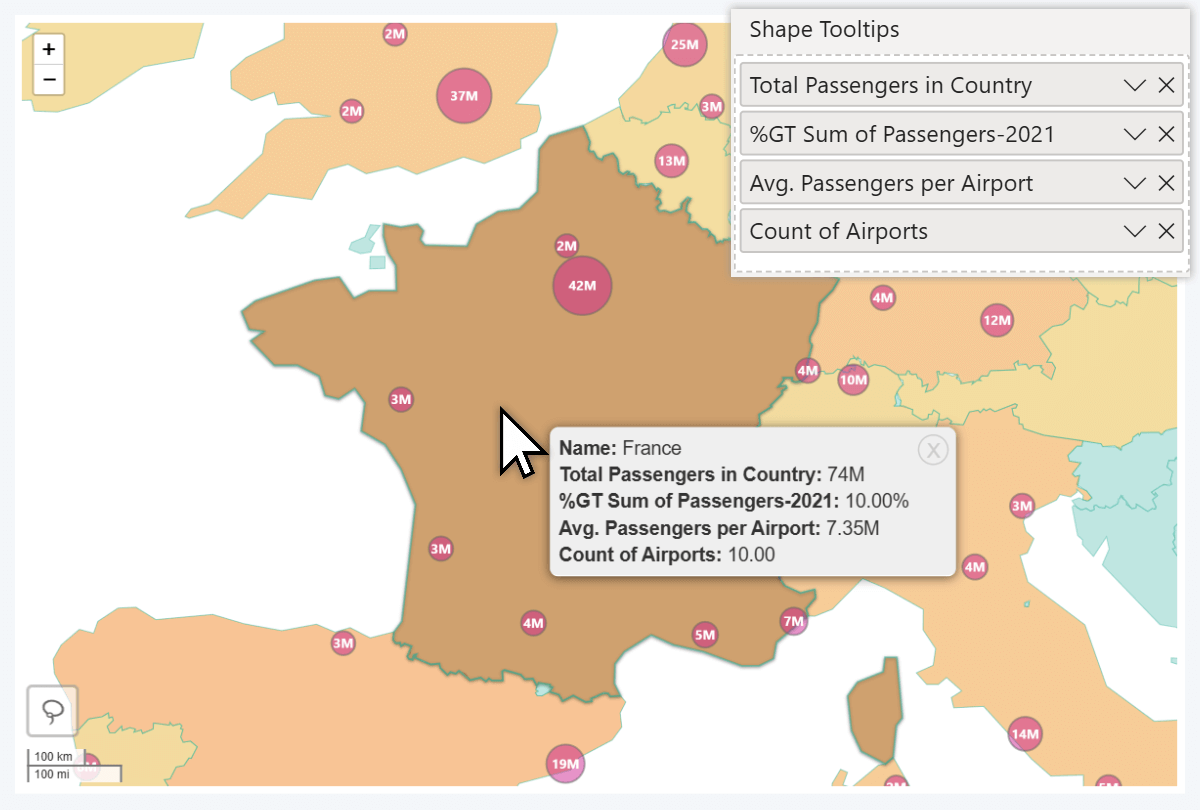
The latest update to our Map and Shape Map visuals have replaced the old Tooltip Fields with two new fields – Node Tooltips and Shape Tooltips. With this change, you can display additional insights to the user in the tooltip when they right-click on a shape – previously, Tooltip Fields would only apply to node tooltips and not shapes.

Why it matters: In both of our Power BI map visuals, you can enable up to 10 different shape layers: country/state borders, custom Lasso Tool shapes, or external KML/GeoJSON files (only in Map). They can be used to visually distinguish multiple regions, and act as a convenient way to select all data within a region with just a click.

Previously, when you added columns or measures to Tooltip Fields, that data would only display when right-clicking directly on a node. The shape tooltip would not be affected and show just the shape’s name.

Old 'Tooltip Fields' in Drill Down Map & Shape Map

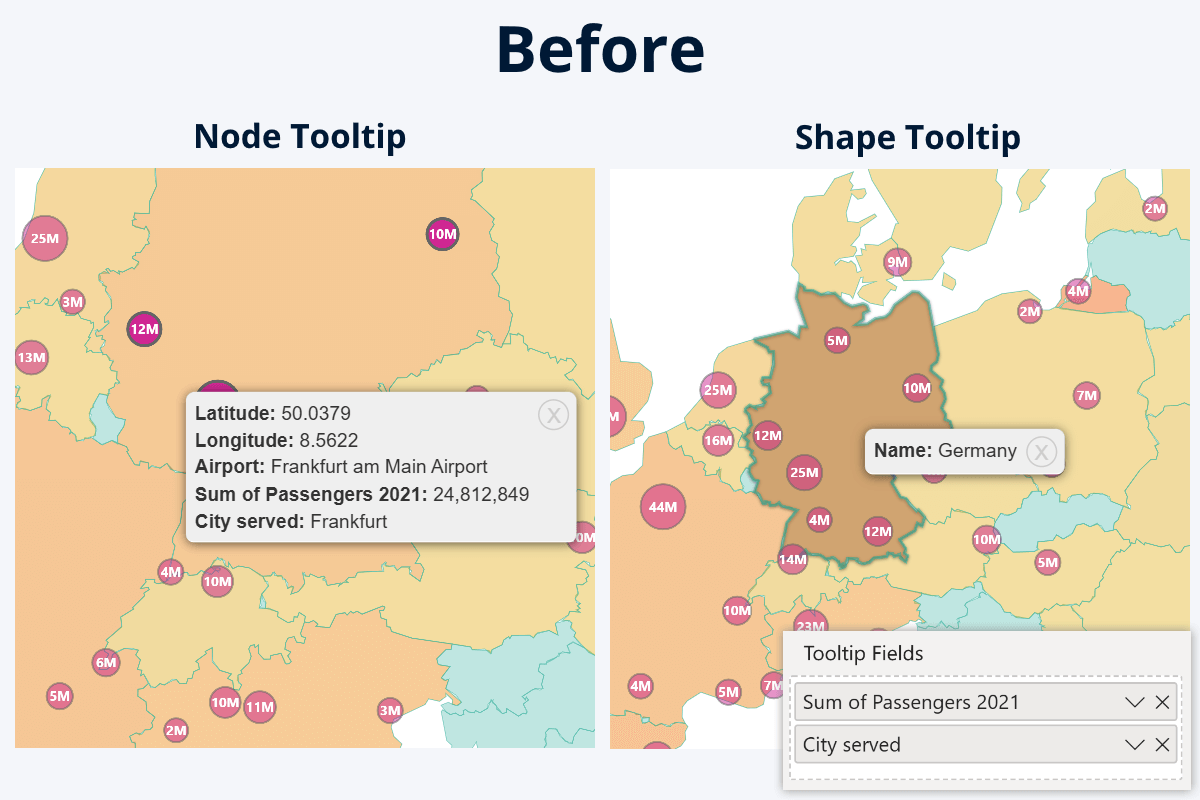
Now, with the two separate fields, you can control what is displayed in node tooltip, and what is displayed in shape tooltip.

Node Tooltip and Shape Tooltip fields in Drill Down Map PRO for Power BI

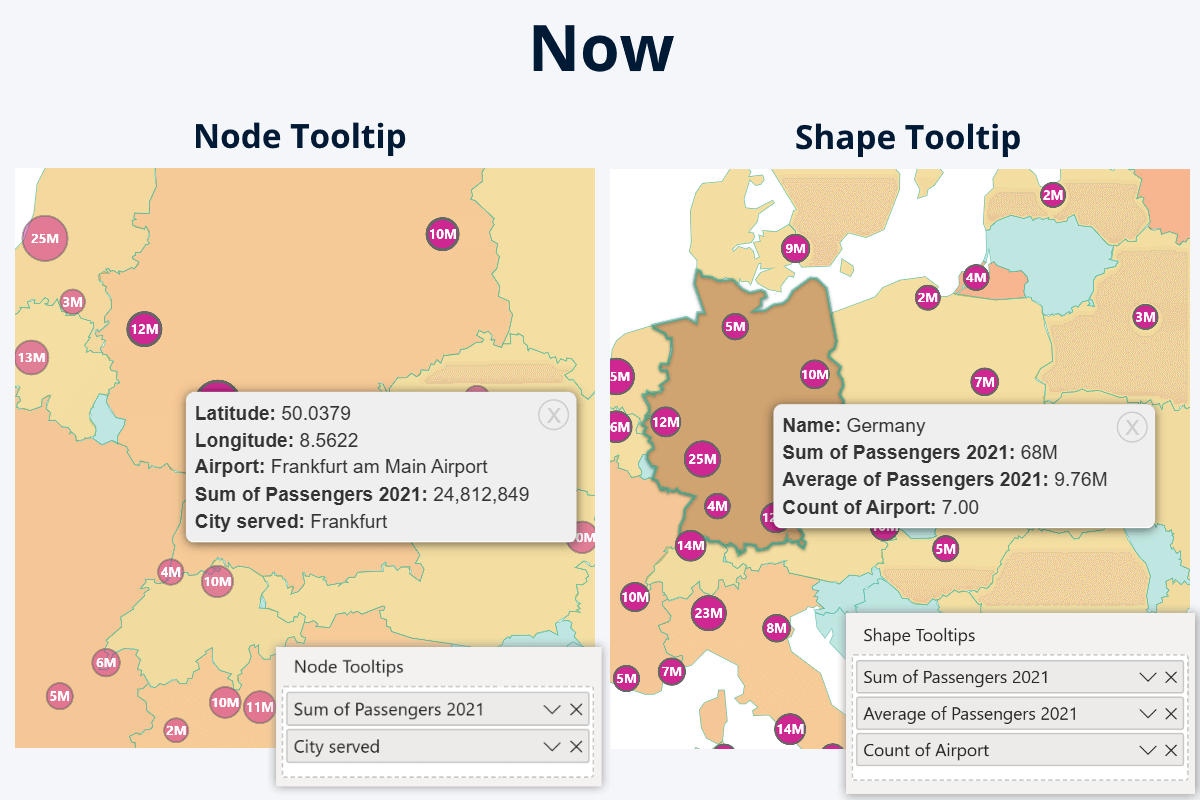
If you wish, you can use different columns or measures to display different insights for each. Alternatively, you can add the same column or measure to both fields, in which case the node tooltip will show the individual value for the row, but the shape tooltip will show aggregated value of all nodes within that shape. Some use cases for shape tooltip fields:

  • Sum: show the total revenue of all retail locations in a country.
  • Average: average income, user spending, rating, or age in the region.
  • Count: show how many nodes (retail locations, users, traffic reports etc.) are within the region.
  • Minimum/maximum: highlight the best-performing retail location in the country.

All Visuals: Vector Icons in 'Visualizations' Pane

Visual icons in Power BI visualizations pane

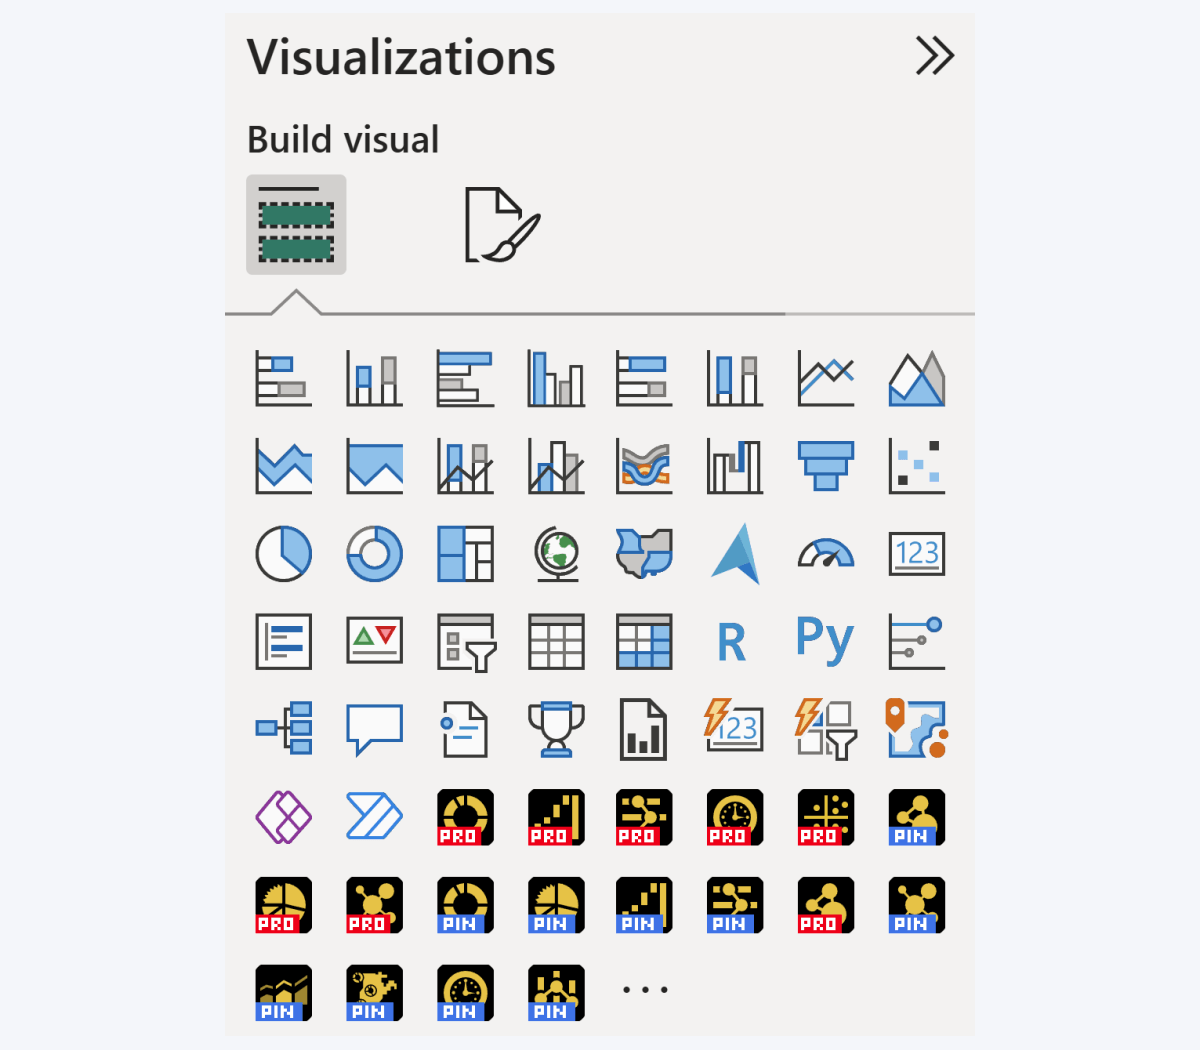
Here’s a nice-to-have quality improvement to all our visuals – we have upgraded the product icons from raster PNGs to vector SVGs. Now, the icons will look sharp and crystal-clear on any screen size and DPI setting. Note the product version label font, which appears ‘blocky’ – that is an intentional design choice to ensure readability at any zoom level.

Get Started with ZoomCharts

Be sure to download the latest version of ZoomCharts Visuals to enjoy these new additions, along with hundreds of other features! With a free trial available, you can see for yourself how these powerful visuals can take your Power BI reports to the next level.

  • Get Drill Down Map PRO & Shape Map PRO
  • View All Drill Down Visuals for Power BI
envelope icon

Want more info like this?

Subscribe to our newsletter and be the first to read our latest articles and expert data visualization tips!


Find out more

Jun 20, 2022

Blog Thumbnail

ZoomCharts Receives EU Funding for New Product Development

The co-financing initiative will ensure the attraction of highly skilled specialists and speed up the development of 3 brand-new custom visuals for Power BI. The work has begun, and the team plans to launch the new visualizations within a year.  

Mar 08, 2023

Blog Thumbnail

Is hiring Power BI experts for report overhaul worth it?

Power BI experts come in many shapes and sizes. Some may help your company implement a Microsoft Power BI workflow, others will help you maintain your data warehouse, and some are suited to give your existing reports a UX and functionality glow-up by performing a thorough report overhaul. In this article, we will focus on the latter and help you decide whether you should hire Power BI experts in lieu of in-house report creators.

Feb 22, 2023

Blog Thumbnail
Guides

Filters in Power BI: Everything You Need to Know

Filters in Power BI reports are a game changer when you’re looking to make big decisions with interactive data visualization. Rummaging through static infographics can get frustrating, thus impacting business management. Fortunately, dynamic Power BI reports can pack large amounts of crucial data into a single report. This article looks at one of the most important parts of interactive data analysis – filters in Power BI reports.

Feb 16, 2023

Blog Thumbnail
Guides

Power BI Combo Chart: Tips & Best Features

A Power BI combo chart is a great way to combine a lot of data into a simple and easily readable package. It can contain multiple series and various chart types on a single visual, giving report creators a lot of options. In this article, we will explore what you can do with Drill Down Combo PRO and how you can best use the wide variety of options that it offers.

Dec 20, 2022

Blog Thumbnail
Guides

Make Power BI Time Series Charts Easily

Time is of the essence. This is also true for data. When assessing the performance of a business, people want to look at quantifiable results to develop their future strategy. However, looking at data from a time-based perspective can reveal valuable insights into seasonal trends. Using this information, companies can adjust to any changes that plain numbers fail to show. That’s where a Power BI time series chart comes into data visualization.

Feb 09, 2023

Blog Thumbnail
Guides

Power BI Pie Chart: All You Need To Know

Pie charts can be an excellent addition to your report. They will show a quick overview of your data, and act as an eye-catching visual accent. That being said, you need to know when to use them, and how to use them correctly for them to be a valuable part of your visual narrative, not a detriment. We’ll answer these questions and give you a brief Power BI pie chart tutorial in this article.
  • «
  • 1
  • ...
  • 4
  • 5
  • 6
  • 7
  • 8
  • 9
  • 10
  • 11
  • »

Contents

Share this article

Want more info like this?

Subscribe to our newsletter and be the first to read our latest articles and expert data visualization tips!


Thank you!

Check your inbox to verify your email address.

logo
[email protected]
+44 204 577 3993
logo

Products

Drill Down Network PRO Drill Down Waterfall PRO Drill Down Graph PRO Drill Down Combo PRO Drill Down Combo Bar PRO Drill Down Donut PRO Drill Down Pie PRO Drill Down TimeSeries PRO Drill Down Timeline PRO Drill Down Map PRO Drill Down Scatter PRO All Visuals

Resources

Report Examples Webinars Blog ZoomCharts Academy Visuals Gallery Documentation Custom Visual Development Subscribe to News

Solutions

Custom Visual Development

Company

Pricing About Us Partners Leave feedback Join PowerGroup EU Funding

Help

ZoomCharts Assistance Contact Sales Contact Support FAQ

Drill Down Network PRO Drill Down Waterfall PRO Drill Down Graph PRO Drill Down Combo PRO Drill Down Combo Bar PRO Drill Down Donut PRO Drill Down Pie PRO Drill Down TimeSeries PRO Drill Down Timeline PRO Drill Down Map PRO Drill Down Scatter PRO All Visuals

Report Examples Webinars Blog ZoomCharts Academy Visuals Gallery Documentation Custom Visual Development Subscribe to News

Custom Visual Development

Pricing About Us Partners Leave feedback Join PowerGroup EU Funding

ZoomCharts Assistance Contact Sales Contact Support FAQ
+44 204 577 3993
[email protected]

Ready to get in touch?

Contact our experts with any question about Power BI and ZoomCharts for Free!

Contact us

© 2025, Data Visualization Software Lab

U.S. Patents No. 11,645,343; 11,921,804; 12,346,389

Cookies Policy
Manage cookies
Privacy Policy
Global
EULA
Patent
warning

Error message

success

Success info: Done!

ZoomCharts AI Assistant

We noticed you're using an old OS version.

For the best experience, we recommend upgrading to ensure that all website features display correctly.

Cookie settings

We use necessary cookies for site functionality, as well as statistic, marketing, and preference cookies to enhance your experience. For more information and to manage your preferences, please visit our Cookie policy