logo
Report Templates
  • Products

    Drill Down Visuals for Power BI

    Discover the most customizable custom visuals for Power BI.

    Pricing & licensing
    • Drill Down Donut Pro
      Drill Down Donut Category Composition
    • Drill Down Pie Pro
      Drill Down Pie Proportional Breakdown
    • Drill Down Combo Pro
      Drill Down Combo Multi-Metric Trends
    • Drill Down Combo Bar Pro
      Drill Down Combo Bar Cross-Metric Trends
    • Drill Down Line Pro
      Drill Down Line Trend Analysis
    • Drill Down Bubble Pro
      Drill Down Bubble Value Relationships
    • Drill Down Scatter Pro
      Drill Down Scatter Correlation Analysis
    • Drill Down Network Pro
      Drill Down Network Entity Connections
    • Drill Down Graph Pro
      Drill Down Graph Relationship Mapping
    • Drill Down Map Pro
      Drill Down Map Geographic Insights
    • Drill Down Waterfall Pro
      Drill Down Waterfall Change Breakdown
    • Drill Down Timeline Pro
      Drill Down Timeline Time-Based Metrics
    • Drill Down TimeSeries Pro
      Drill Down TimeSeries Temporal Patterns
    • Drill Down Line Pro
      Drill Down Line Trend Analysis

    Visuals in Planning

    Discover visuals we’re exploring, share your feedback, and help us decide what to build next.

    Browse concepts
  • Report Templates
    • Browse Report Templates
      Browse Report Templates Explore 2700+
      Power BI reports
    • Plans & Pricing Choose the report download plan
      that fits your needs

    Browse by Category

    KPISalesProject ManagementFinanceLogisticsBankingHRCRMMarketingCustomer Support
  • Resources

      Learn

    • Video Tutorials Step-by-step Power BI guides
    • Webinars Live and recorded expert sessions
    • Visuals Gallery Explore all custom Power BI visuals
    • Blog Power BI tips, updates, and guides
    • Documentation Setup, features, and API reference

    Support

    • ZoomCharts Assistance Help from our product experts
    • Contact Sales Questions about pricing or licensing
    • Contact Support Technical help and troubleshooting
    • FAQ Quick answers to common questions
  • Services
    • Power BI Report Development
      Power BI Report Development End-to-end custom
      Power BI reports.
    • Custom Visual Development
      Custom Visual Development Custom visuals for
      your business needs.
  • Challenges
  • Pricing
Get started
Get started
Get it now
Go back

Contents

Contest logo

Full visual bundle. €365 for year one.

Per developer · Billed yearly · New customers only · Ends 1 Dec

Get the bundle

Full visual bundle. €365 for year one.

Contest logo
Get the bundle

Per developer · Billed yearly · New customers only · Ends 1 Dec

Power BI Dashboard Examples

The Worlds #1 Interactive Power BI
Template Gallery

See our Power BI templates for new ideas to implement within your own reports. Explore interactive report examples of sales, banking, HR and other kinds of data. Click on each template to view in more detail. Download pbix and start interacting.

Free Templates for the Community

Free to preview & interact

Download PBIX Files

2700+

Power BI Templates

1000+

Report creators

100+

New reports monthly

1M+

Report views

Free to preview & interact

2700+
Power BI Templates
1000+
Report creators
100+
New monthly reports
1M+
Report views

Filters

Popular Categories:
All
KPI
Sales
Project Management
Accounting & Finance
Logistics
Banking
HR
CRM
Marketing
Customer Support
Sort by:

Showing:

4U Reports

Reports that earn attention, built on four user-centered qualities: Unique, User-friendly, Uncovering, and Understandable.
Designed to be opened, explored, understood, and acted upon.

Editor's Pick
Specially selected reports to help you get started

No records
All Reports 3048 results
New
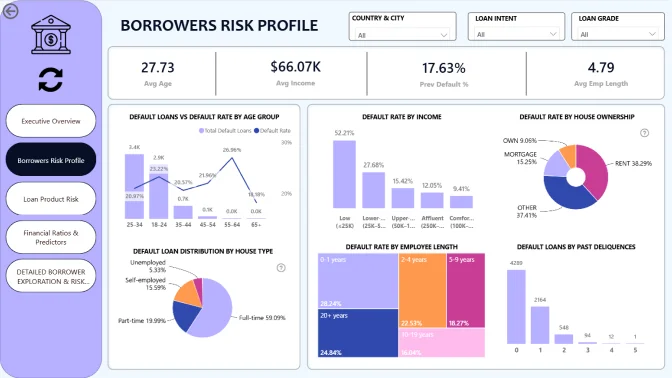
Bank Credit Risk...

Bank Credit Risk Analysis

Phanindra Parvathi

4 pages

1880

New
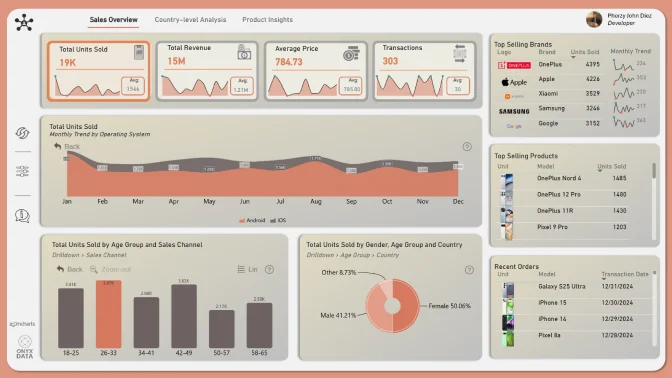
Onyx Data Challenge...

Onyx Data Challenge - Mobile Sales Analysis

Pherzy John Diez

1 page

1878

New
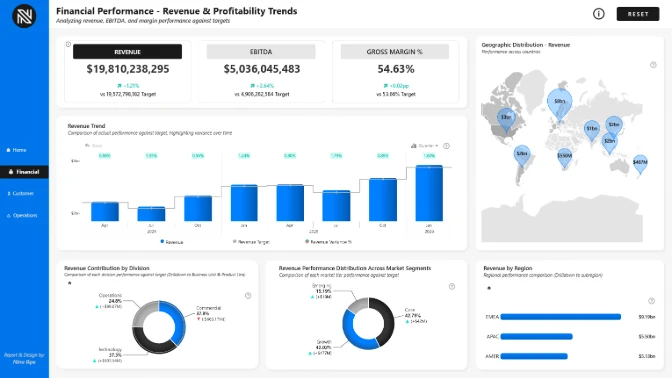
Power BI Executive...

Power BI Executive Financial Performance Dashboard

Nina Ikpe

4 pages

1875

New
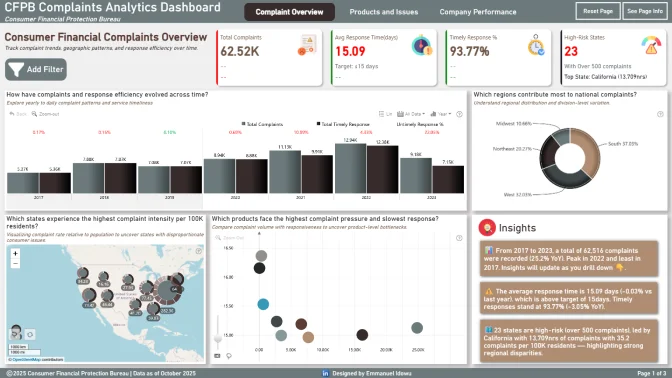
Power BI Consumer...

Power BI Consumer Complaints Dashboard

Emmanuel Idowu

4 pages

1875

New
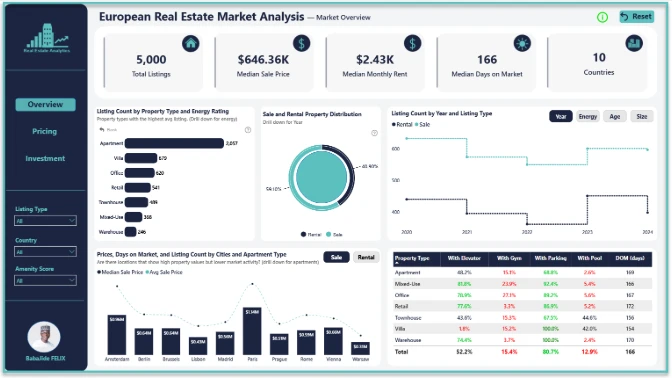
Property Value &...

Property Value & Market Activity Dashboard

BabaJide Felix

3 pages

1872

New
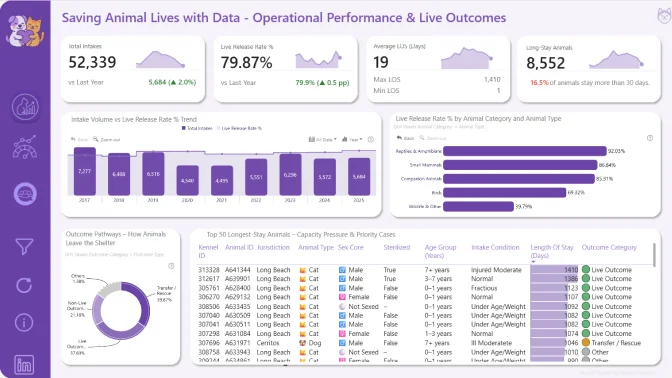
Animal Shelter Analytics...

Animal Shelter Analytics Dashboard

Siddesh Pardeshi

3 pages

1871

New
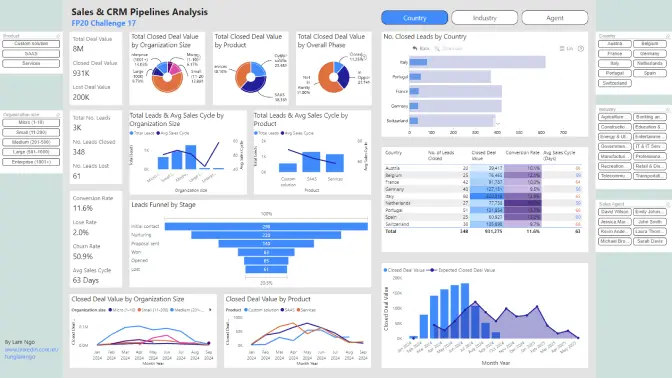
Sales & CRM...

Sales & CRM Pipelines Analysis

Tung Lam Ngo

1 page

1863

New
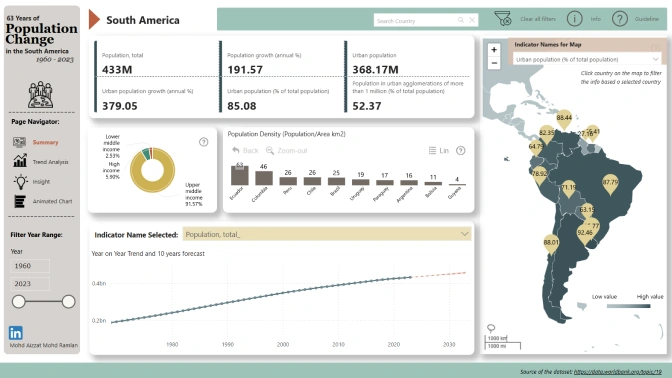
Urbanization in South...

Urbanization in South America: Key Indicators & Insights

Mohd Aizzat

4 pages

1860

New
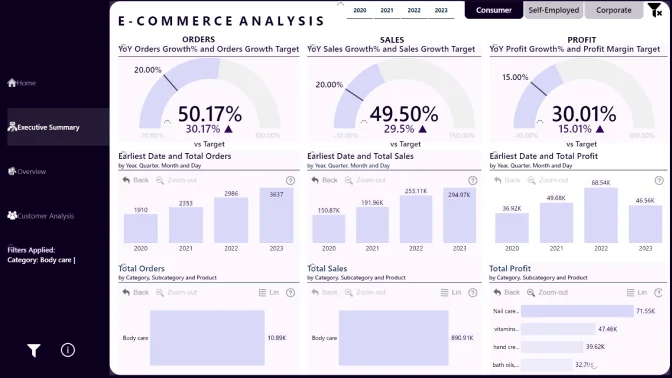
Ecommerce Analysis

Ecommerce Analysis

Sushree Jena

3 pages

1858

New
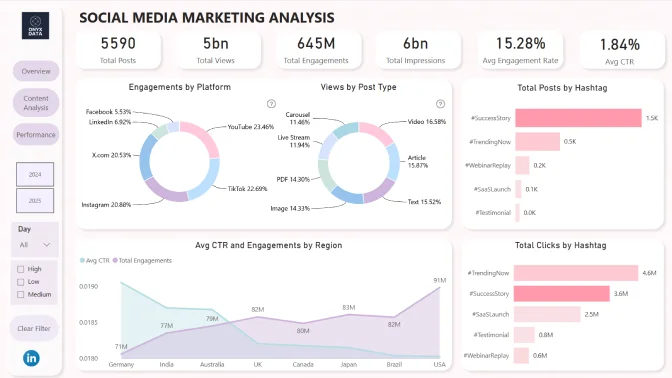
Social Media Performance...

Social Media Performance Dashboard

anushree dhomne

3 pages

1840

New
KPI Dashboard Example...

KPI Dashboard Example for Power BI Financial Performance

Aakash M

4 pages

1837

New
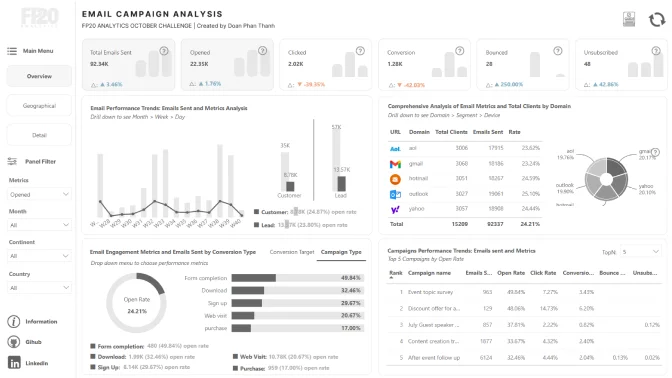
Marketing Email Campaign...

Marketing Email Campaign Performance

Phan Thanh Doan

3 pages

1837

New
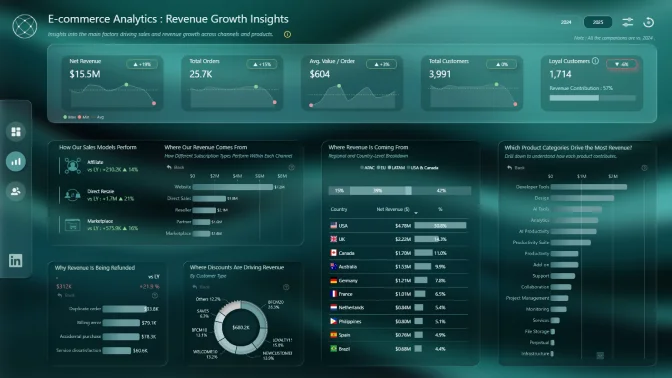
E-commerce Analytics 2

E-commerce Analytics 2

Akshay Patil

3 pages

1832

New
Inventory Management Analysis...

Inventory Management Analysis 3

Eniola Adekoya

3 pages

1826

New
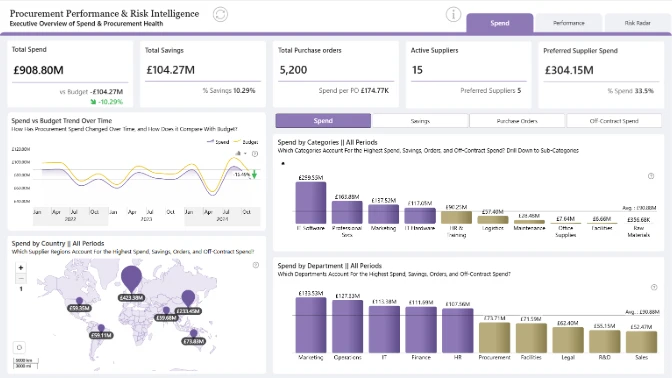
Procurement Performance Analytics...

Procurement Performance Analytics Report

Jude Onuh

4 pages

1822

New
E-Commerce Dashboard

E-Commerce Dashboard

Spurthy Ramappa

2 pages

1821

New
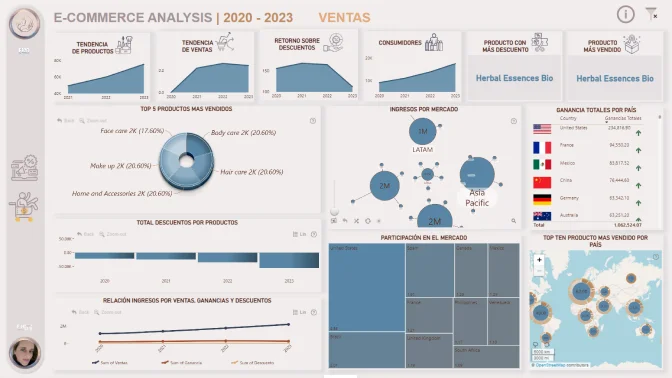
MFH E-COMMERCE ANALYSIS

MFH E-COMMERCE ANALYSIS

María Fernanda Helguero

2 pages

1816

New
OTIF Dashboard Power...

OTIF Dashboard Power BI

Peace Joshua

3 pages

1816

New
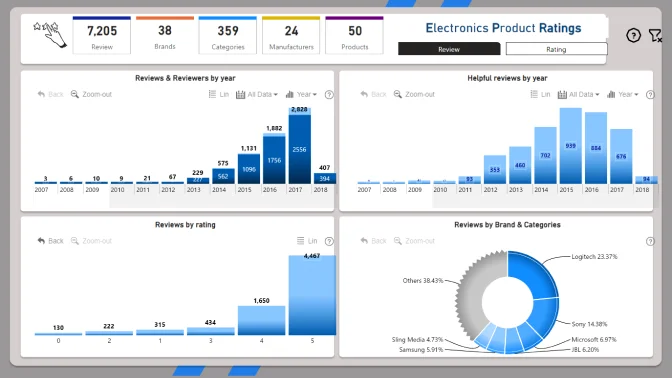
Electronic Product Rating...

Electronic Product Rating Analytics

Rigoberto Garcia

3 pages

1814

New
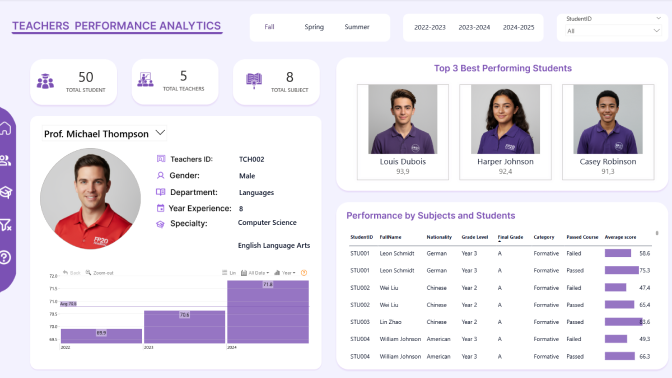
Student Performance Power...

Student Performance Power BI Report 27

Maura Galindo

2 pages

1806

New
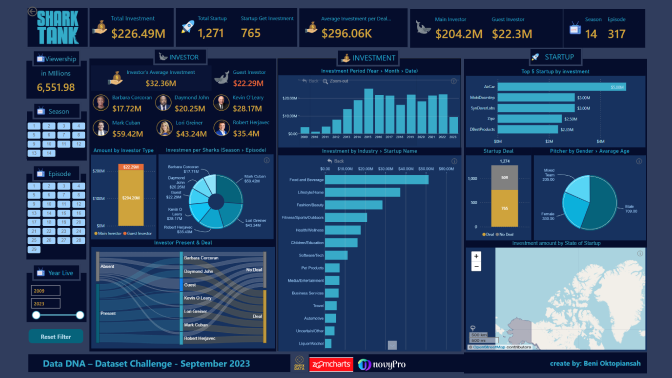
Shark Tank Analysis...

Shark Tank Analysis Report - DataDNA Challenge

Beni Oktopiansah

1 page

1806

New
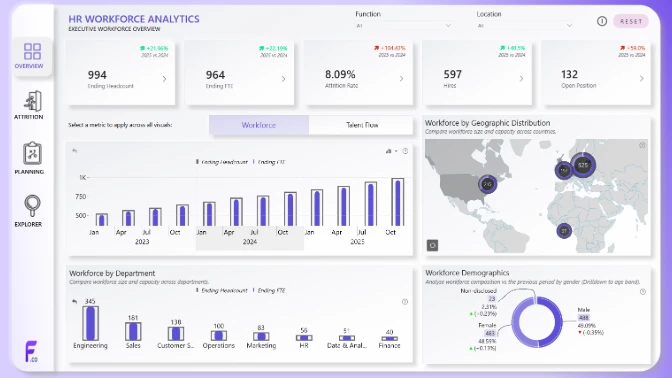
Power BI HR...

Power BI HR Attrition Analysis Dashboard

Odunlami Zainab

5 pages

1801

New
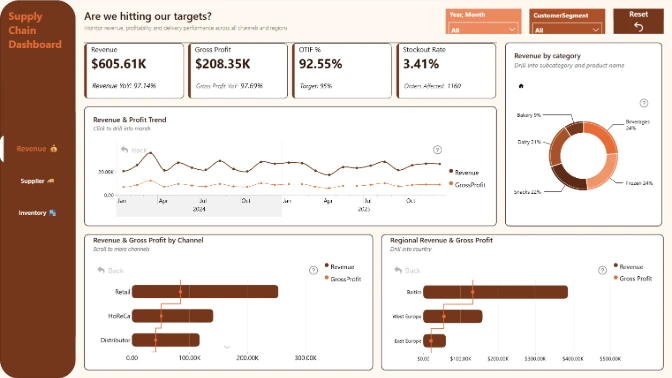
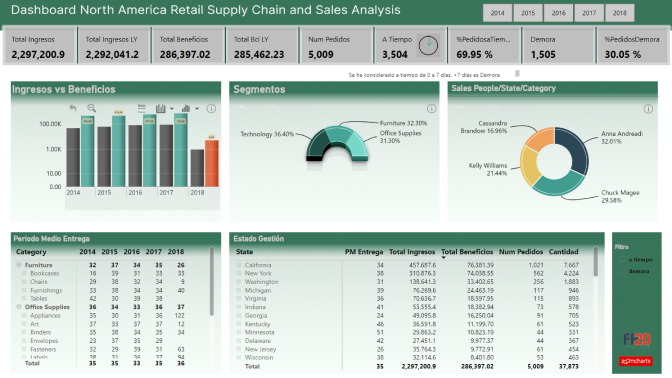
Power BI Retail...

Power BI Retail Supply Chain & Sales Analytics Dashboard Template

Montse Collantes

2 pages

1797

New
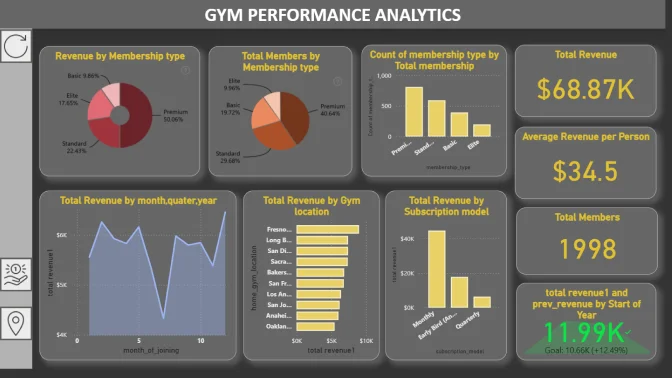
Gym Performance Analytics...

Gym Performance Analytics Dashboard

Adwaith Ashokan

3 pages

1792

New
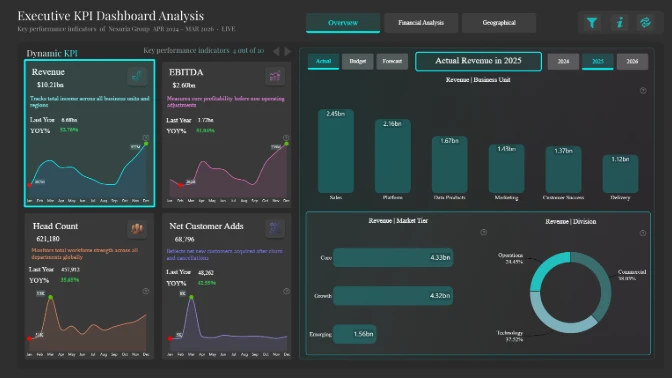
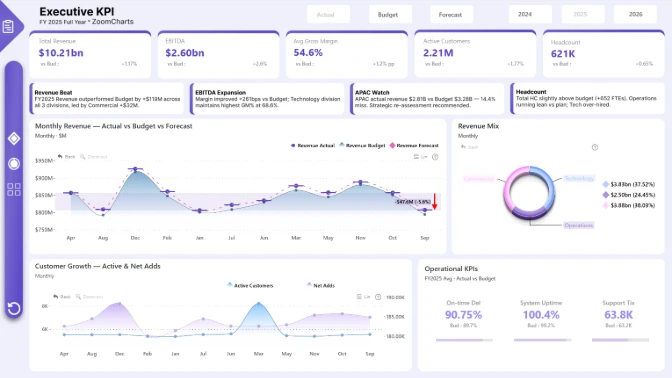
Power BI Executive...

Power BI Executive KPI Dashboard

Abhijit Basak

5 pages

1790

New
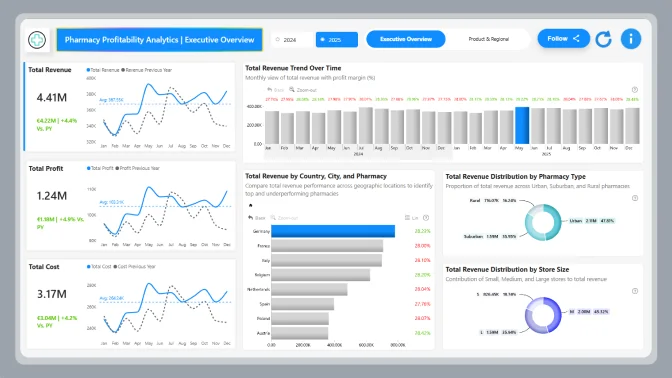
Pharmacy Sales Power...

Pharmacy Sales Power BI Dashboard

Akhilesh Raut

2 pages

1790

New
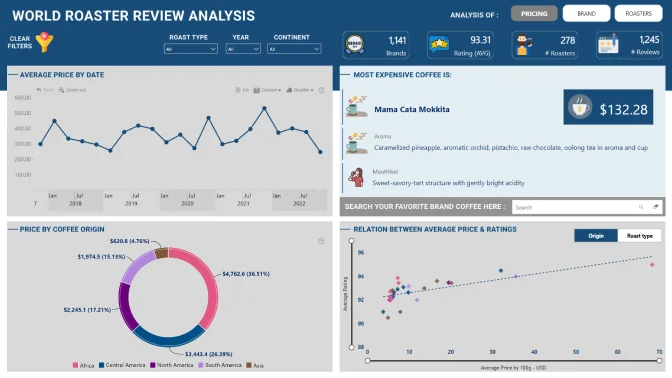
World Roaster Review...

World Roaster Review Analysis

Giancarlo Ramos de Rosas

2 pages

1789

New
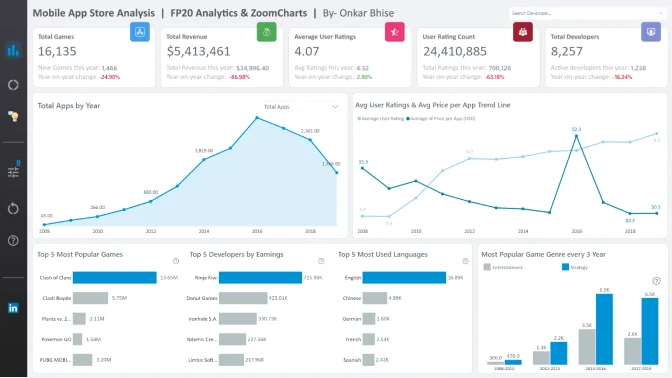
Mobile Games Analysis

Mobile Games Analysis

Onkar Bhise

3 pages

1788

New
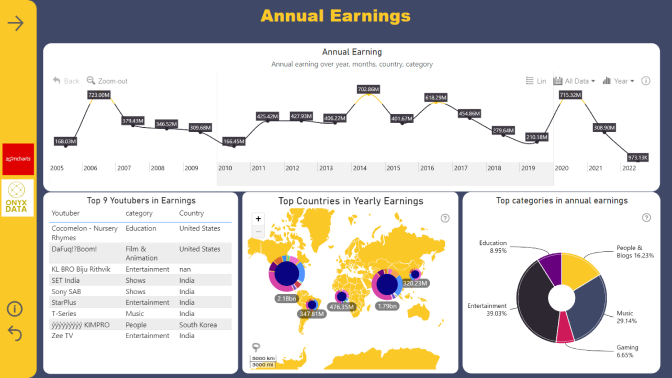
Youtubers DataSet

Youtubers DataSet

Abdelrhman Nabil Ibraheem

2 pages

1786

New
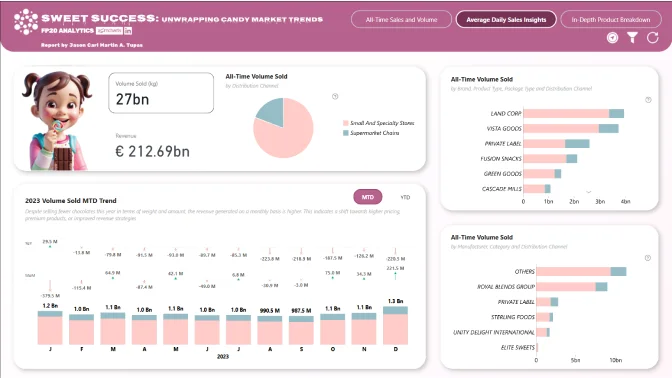
Sweet Success -...

Sweet Success - Unwrapping Candy Market Trends
Jason Carl Martin Tupas
3 pages

1780

New
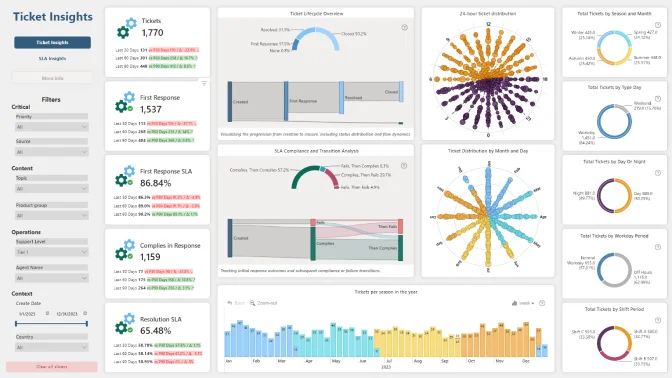
Power BI Technical...

Power BI Technical Support Ticket Lifecycle & Trends Dashboard

Norman Reynaldo Sabillon Castro

4 pages

1772

New
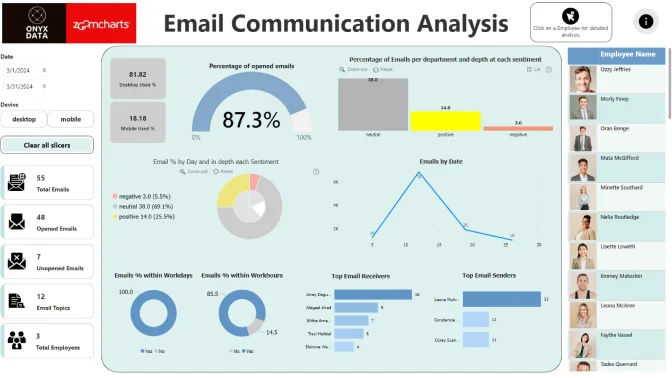
Email Analysis ONYX...

Email Analysis ONYX Data challenge

Abhinandan Pawar

1 page

1770

New
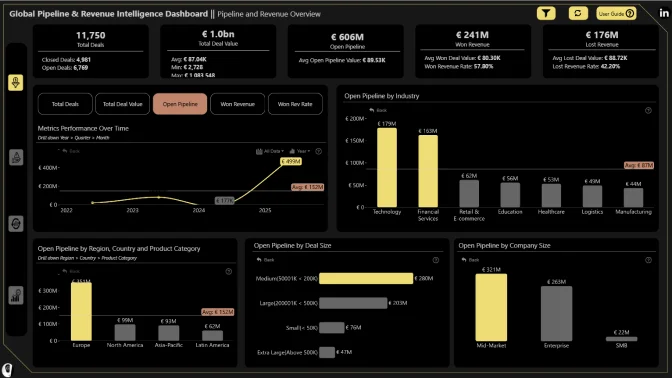
Sales Pipeline &...

Sales Pipeline & Deals Analytics Power BI Dashboard

Nnamdi Nwankwo

4 pages

1769

New
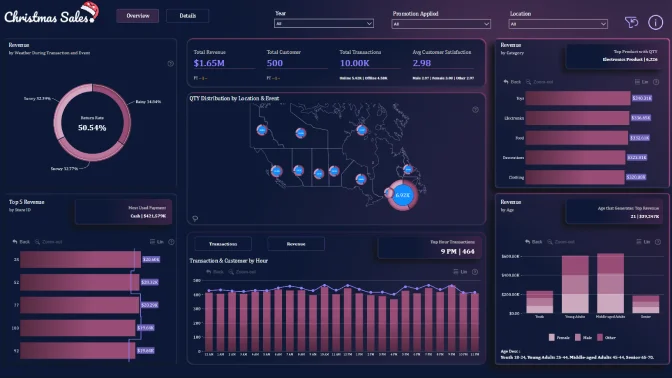
Christmas Sales Report

Christmas Sales Report

Andreas Miftakhul Pratama

2 pages

1768

New
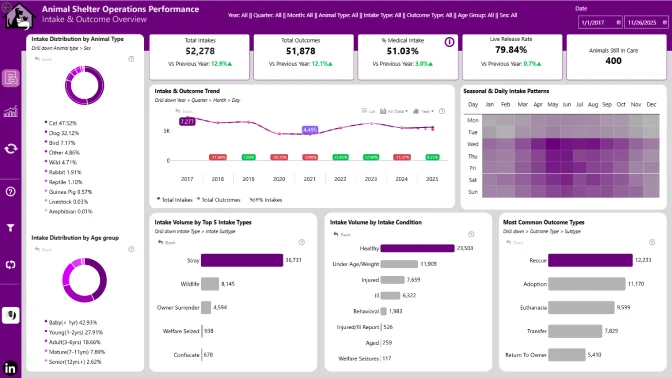
Animal Shelter Operations...

Animal Shelter Operations Analytics Report

Nnamdi Nwankwo

3 pages

1766

New
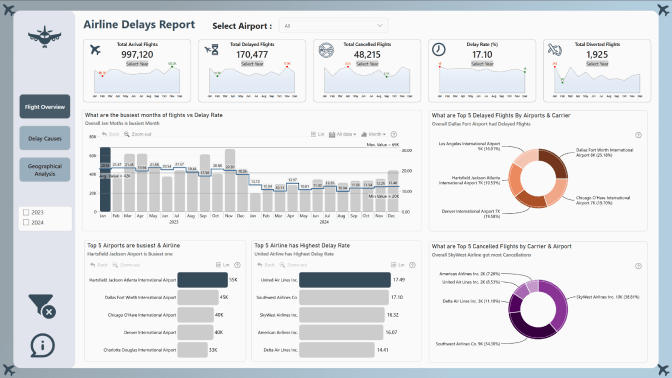
Airline Delay Analysis...

Airline Delay Analysis Power BI Report Example

Akhilesh Raut

3 pages

1765

New
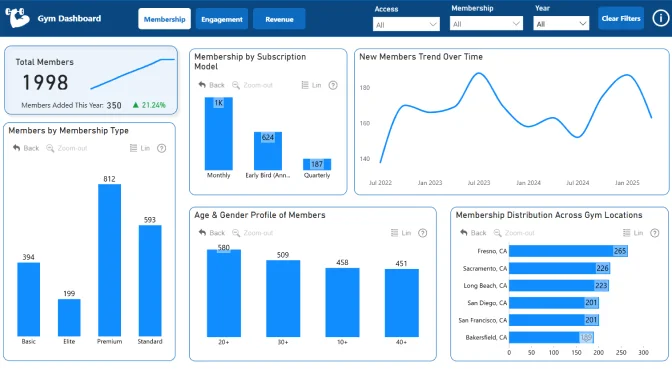
Gym Membership Dashboard

Gym Membership Dashboard

Abhishek Kumar Paul

3 pages

1764

New
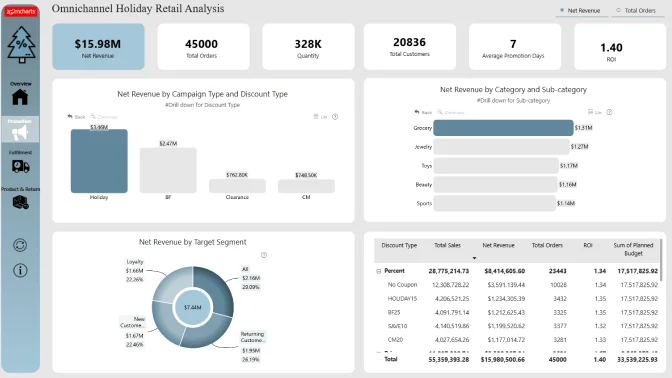
Omnichannel Holiday Sales...

Omnichannel Holiday Sales – Power BI 2

Kapila Karunakaran

4 pages

1764

New
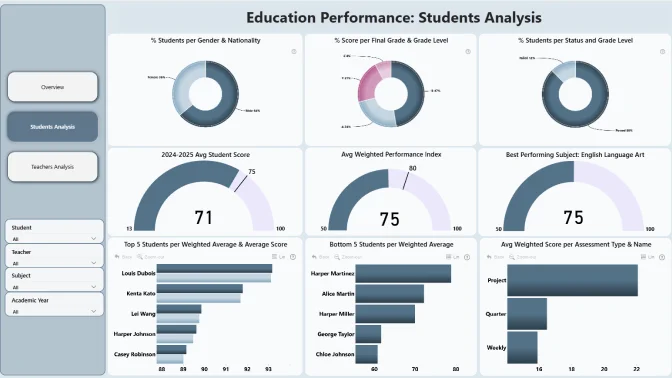
Student Performance Power...

Student Performance Power BI Report 20

Menna Samir

3 pages

1763

New
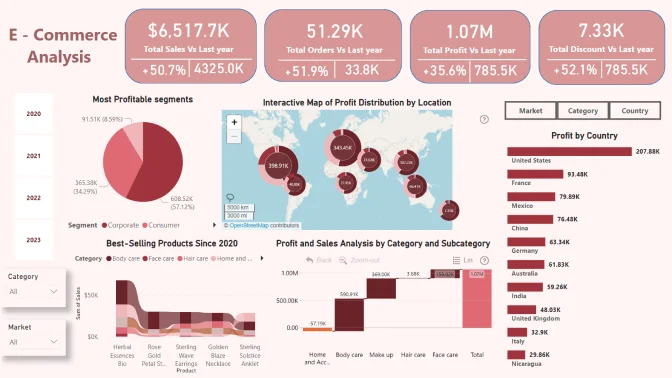
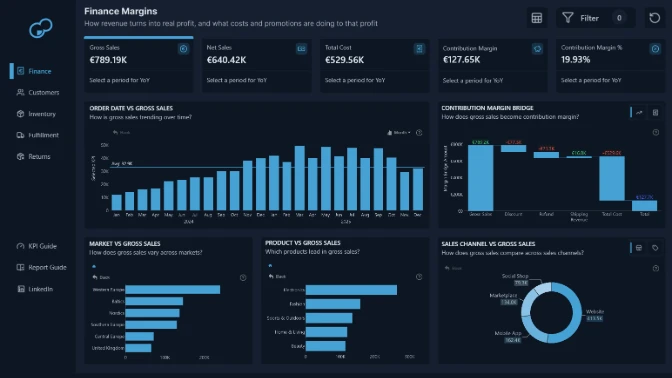
E-Commerce Profitability &...

E-Commerce Profitability & Operations Power BI Dashboard

Mantena Chakradhar

4 pages

1752

  • «
  • 1
  • ...
  • 4
  • 5
  • 6
  • 7
  • 8
  • 9
  • 10
  • 11
  • 12
  • ...
  • 77
  • »

How to use a PBIX template

Preview the interactive report, download the PBIX file, open it in Power BI Desktop, and replace the same data connection with your own dataset.

Preview and download

Explore the report online and download the PBIX template file.

Open in Power BI Desktop

Open the downloaded PBIX file in Power BI Desktop.

Connect your data

Replace the sample data source with your own dataset.

Refresh and adjust

Refresh the model and update fields or visual were needed.

Save and share

Save your report and publish it for your audience.

Power BI Template Guide

Have a question about Power BI report templates?

Take a look at the answers below, or reach out to us via chat.

A Power BI report template is a ready-made PBIX report that includes a designed layout, visuals, measures, and sample data that you can adapt to your own reporting needs.

Yes. Open the PBIX file in Power BI Desktop, replace the sample data source, and map your fields to the existing report structure.

Yes. The gallery lets visitors preview and interact with published reports before deciding which PBIX file to download.

Template downloads are provided as PBIX files that can be opened in Power BI Desktop.

Choose a template that matches your business area, required KPIs, and preferred report structure. Category filters can help narrow down the best fit.

Absolutely. Every template is fully editable in Power BI Desktop. You can replace the sample data with your own, modify the layout, add or remove pages, customize KPIs, and adapt the report to your business requirements.

The templates are built with ZoomCharts custom visuals to deliver advanced interactivity, drill-down, and data exploration. To publish or share reports that use ZoomCharts visuals, you'll need a ZoomCharts license. Learn more about available licensing options on our Power BI Visuals Pricing page.

After editing the PBIX file in Power BI Desktop, you can publish it to Power BI Service if your environment and licensing allow it.

Leave a question
ZoomCharts

Welcome to ZoomCharts

You’re almost there! Create an account to download reports.

Sign up with Microsoft
or

Verify your email address

We have sent a code to your email address. Please input the code below.

Didn't receive code? Request again (after 30 seconds)

Already have an account? Log in

Get access to this and 2,000+ more reports

Skip weeks of building.

Pick a template, connect your data, ship in days.

Trusted by 1M+ users.

Used by Power BI developers, consultants, and managers.

100+ new reports monthly.

The gallery keeps growing - always fresh, always relevant.

Report
ZoomCharts

Log in to your ZoomCharts account

You’re almost there! Log in to download reports.

Log in with Microsoft
or
Forgot password?

Reset your password

We'll email you instructions on how to reset your password

Don't have an account? Sign up

Get access to this and 2,000+ more reports

Skip weeks of building.

Pick a template, connect your data, ship in days.

Trusted by 1M+ users.

Used by Power BI developers, consultants, and managers.

100+ new reports monthly.

The gallery keeps growing - always fresh, always relevant.

Report
logo
[email protected]
+44 204 577 3993
logo

Products

Drill Down Bubble PRO Drill Down Line PRO Drill Down Network PRO Drill Down Waterfall PRO Drill Down Graph PRO Drill Down Combo PRO Drill Down Combo Bar PRO Drill Down Donut PRO Drill Down Pie PRO Drill Down TimeSeries PRO Drill Down Timeline PRO Drill Down Map PRO Drill Down Scatter PRO All Visuals

Resources

Report Examples Webinars Blog ZoomCharts Academy Visuals Gallery Documentation Subscribe to News

Solutions

Custom Visual Development Power BI Report Development

Company

Pricing About Us Partners Leave feedback Join PowerGroup EU Funding

Help

ZoomCharts Assistance Contact Sales Contact Support FAQ AI Information

Drill Down Line PRO Drill Down Bubble PRO Drill Down Network PRO Drill Down Waterfall PRO Drill Down Graph PRO Drill Down Combo PRO Drill Down Combo Bar PRO Drill Down Donut PRO Drill Down Pie PRO Drill Down TimeSeries PRO Drill Down Timeline PRO Drill Down Map PRO Drill Down Scatter PRO All Visuals

Report Examples Webinars Blog ZoomCharts Academy Visuals Gallery Documentation Subscribe to News

Custom Visual Development Power BI Report Development

Pricing About Us Partners Leave feedback Join PowerGroup EU Funding

ZoomCharts Assistance Contact Sales Contact Support FAQ AI Information
+44 204 577 3993
[email protected]

Ready to get in touch?

Contact our experts with any question about Power BI and ZoomCharts for Free!

Contact us

© 2026, Data Visualization Software Lab

U.S. Patents No. 11,645,343; 11,921,804; 12,346,389

Cookies
Privacy Policy
Global
Legal
Patent
warning

Error message

success

Success info: Done!

ZoomCharts AI Assistant

We noticed you're using an old OS version.

For the best experience, we recommend upgrading to ensure that all website features display correctly.

Cookie settings

We use necessary cookies for site functionality, as well as statistic, marketing, and preference cookies to enhance your experience. For more information and to manage your preferences, please visit our Cookie policy