logo
For Power BI
  • Products
    • Custom Visuals for Power BI
    • Report Templates
  • Resources

      Resources

    • Documentation
    • Report Examples
    • Blog
    • Webinars
    • Video Tutorials
    • Visuals Gallery

    Support

    • ZoomCharts Assistance
    • Contact Sales
    • Contact Support
    • FAQ

    Challenges

    Challenges

    Improve your report creation skills by participating in free challenges for report creators.

    Learn more
    Get Developer License
  • Services
    • Power BI Report Development
    • Custom Visual Development
  • Challenges
  • Pricing
    • Custom Visuals for Power BI
    • Report Templates
Subscribe
Subscribe
Get it now
Go back

Contents

Contest logo
Contest logo
Contest logo
Contest logo
Try Free Now
Go back

Onyx Data September 2025 Challenge

Report Author: Phanindra Parvathi

34

Bank Credit Risk Analysis

Report
Report Interact

Pie Donut Banking Accounting & Finance

Share template with others

This Power BI report uses the Credit Bank Risk Dataset and features ZoomCharts Drill Down PRO custom visuals for Power BI. It was submitted to the Onyx Data DataDNA ZoomCharts Mini Challenge in September 2025.


Author's Description:

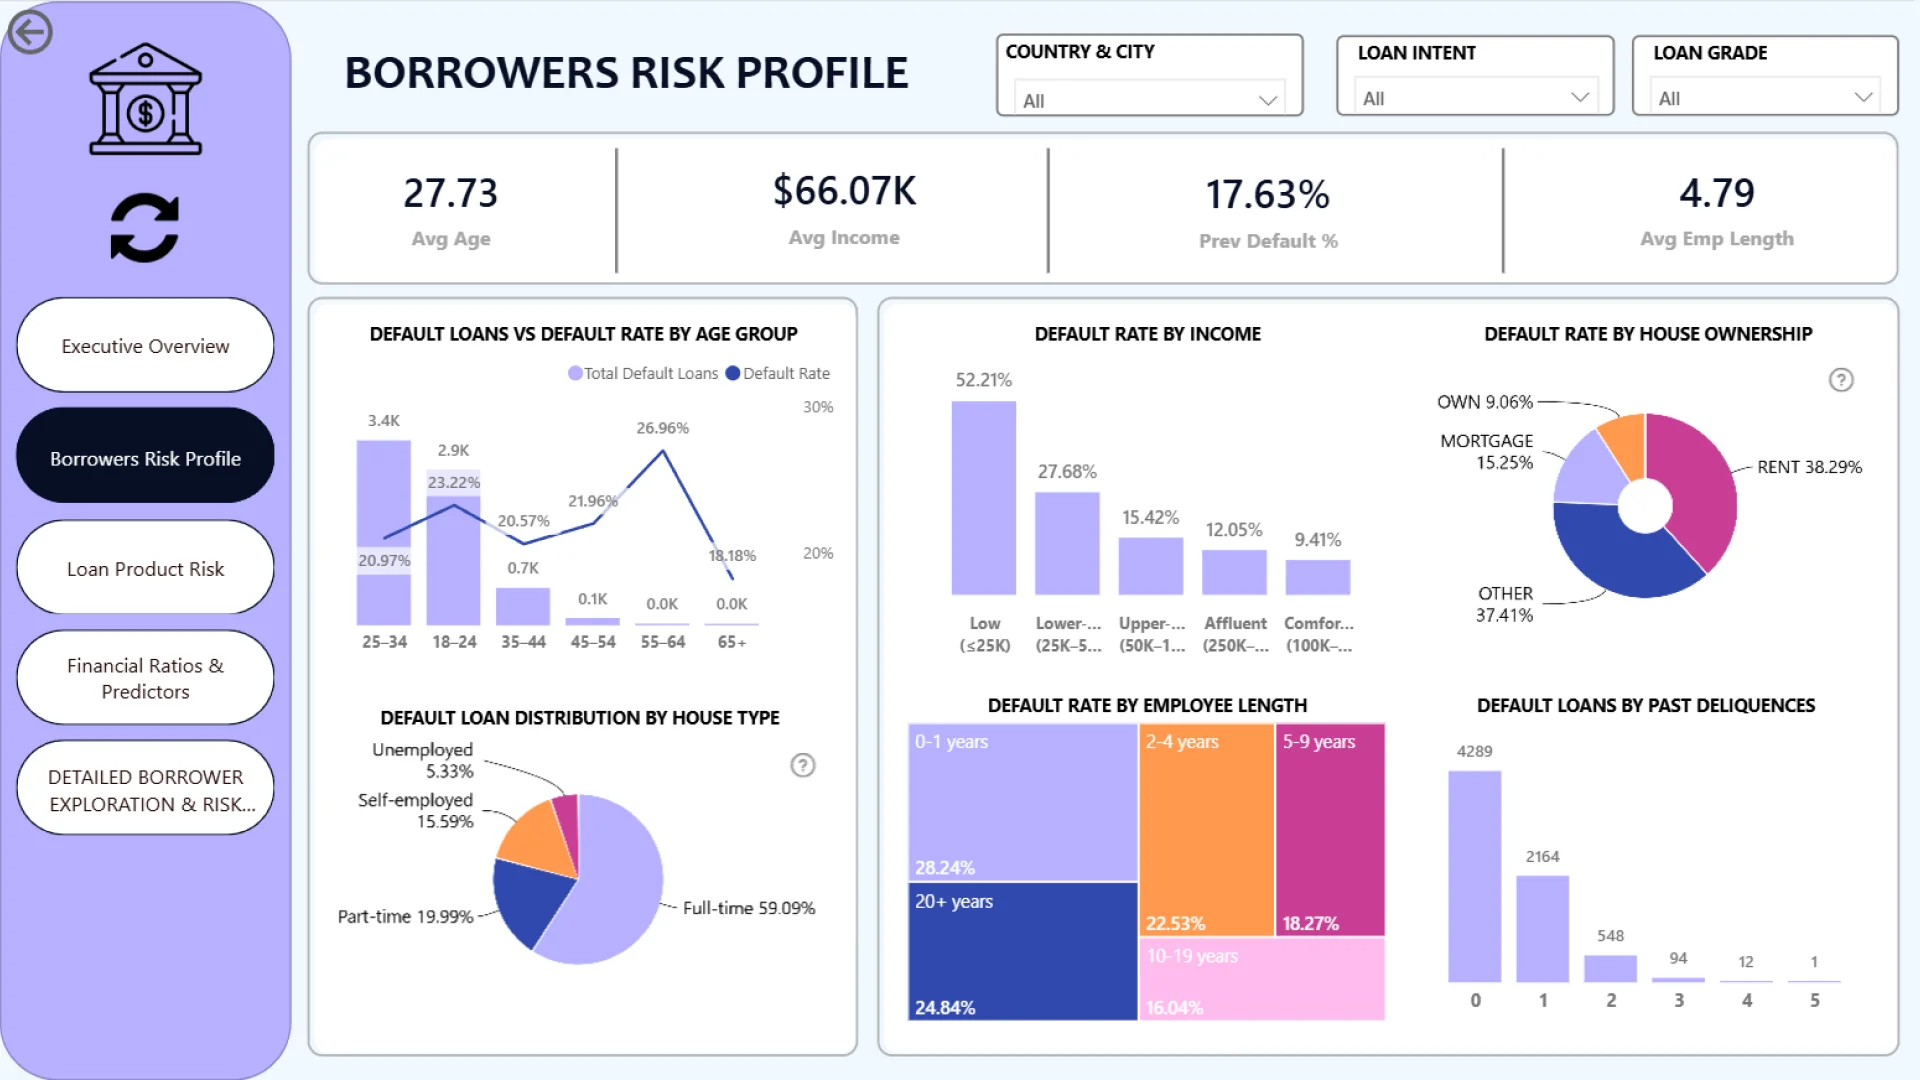
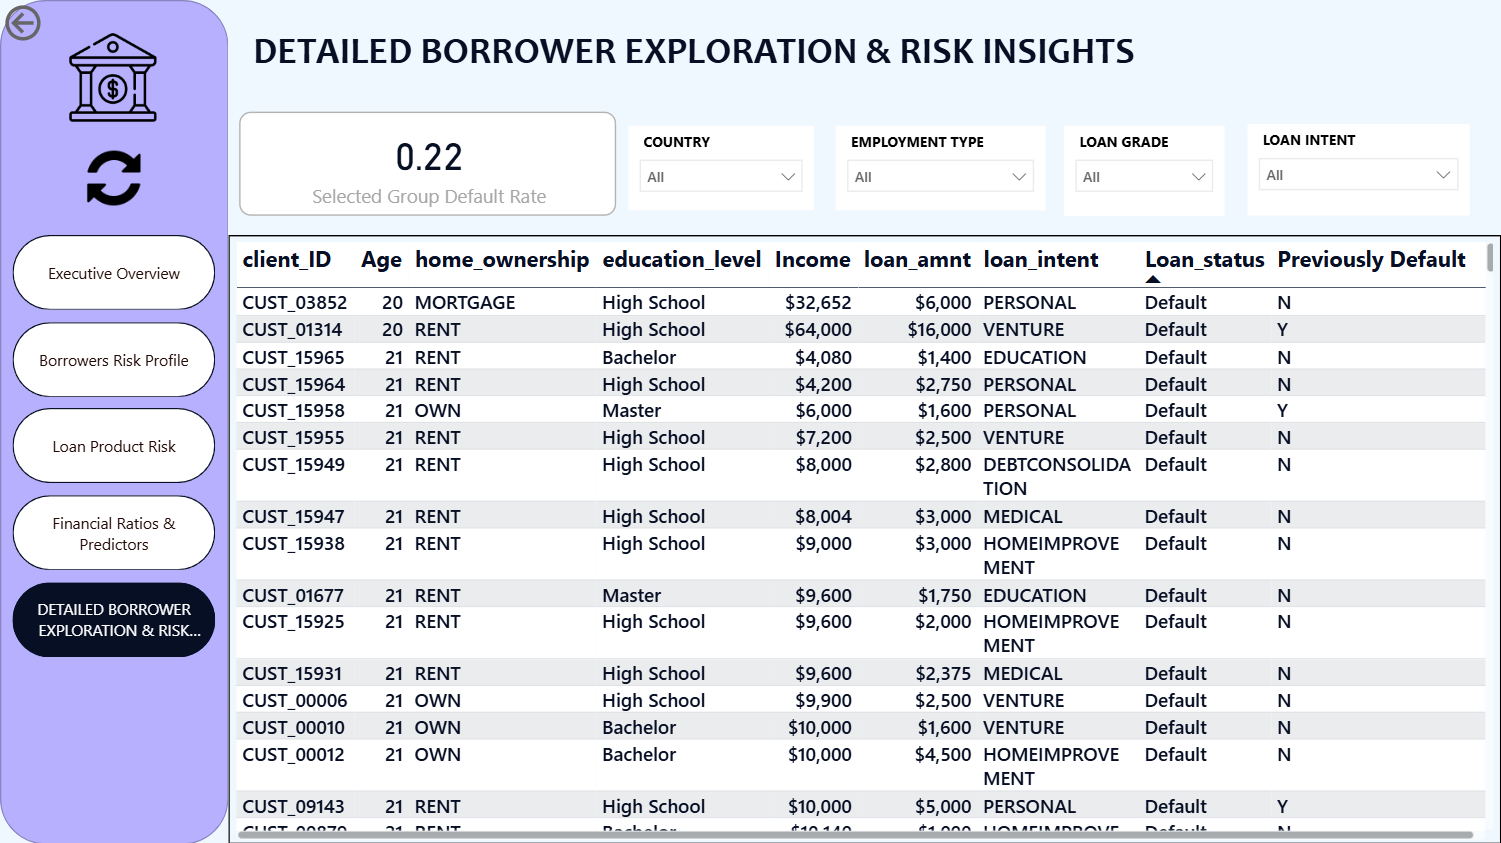
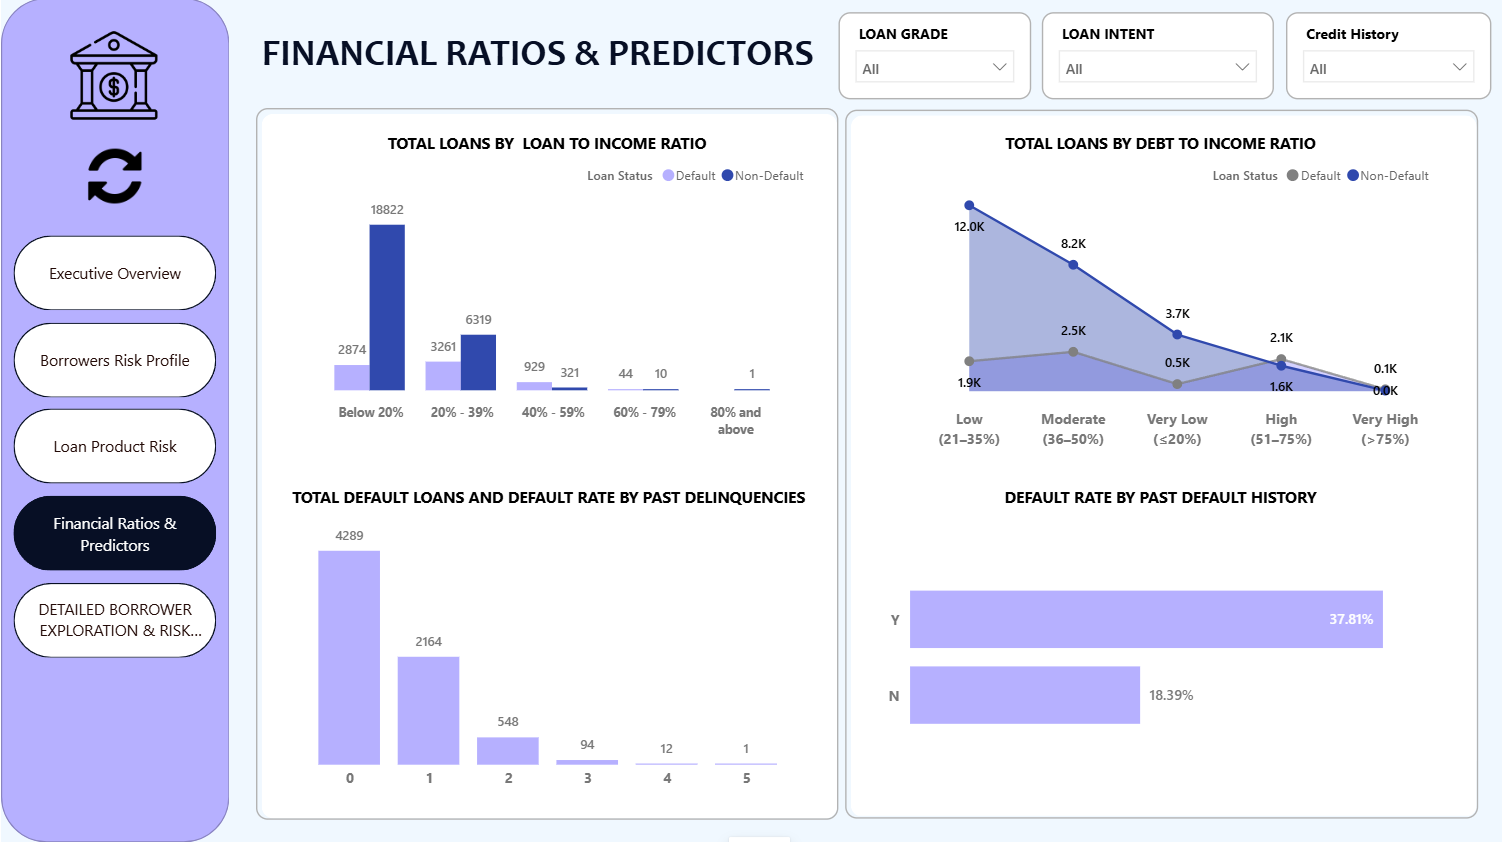
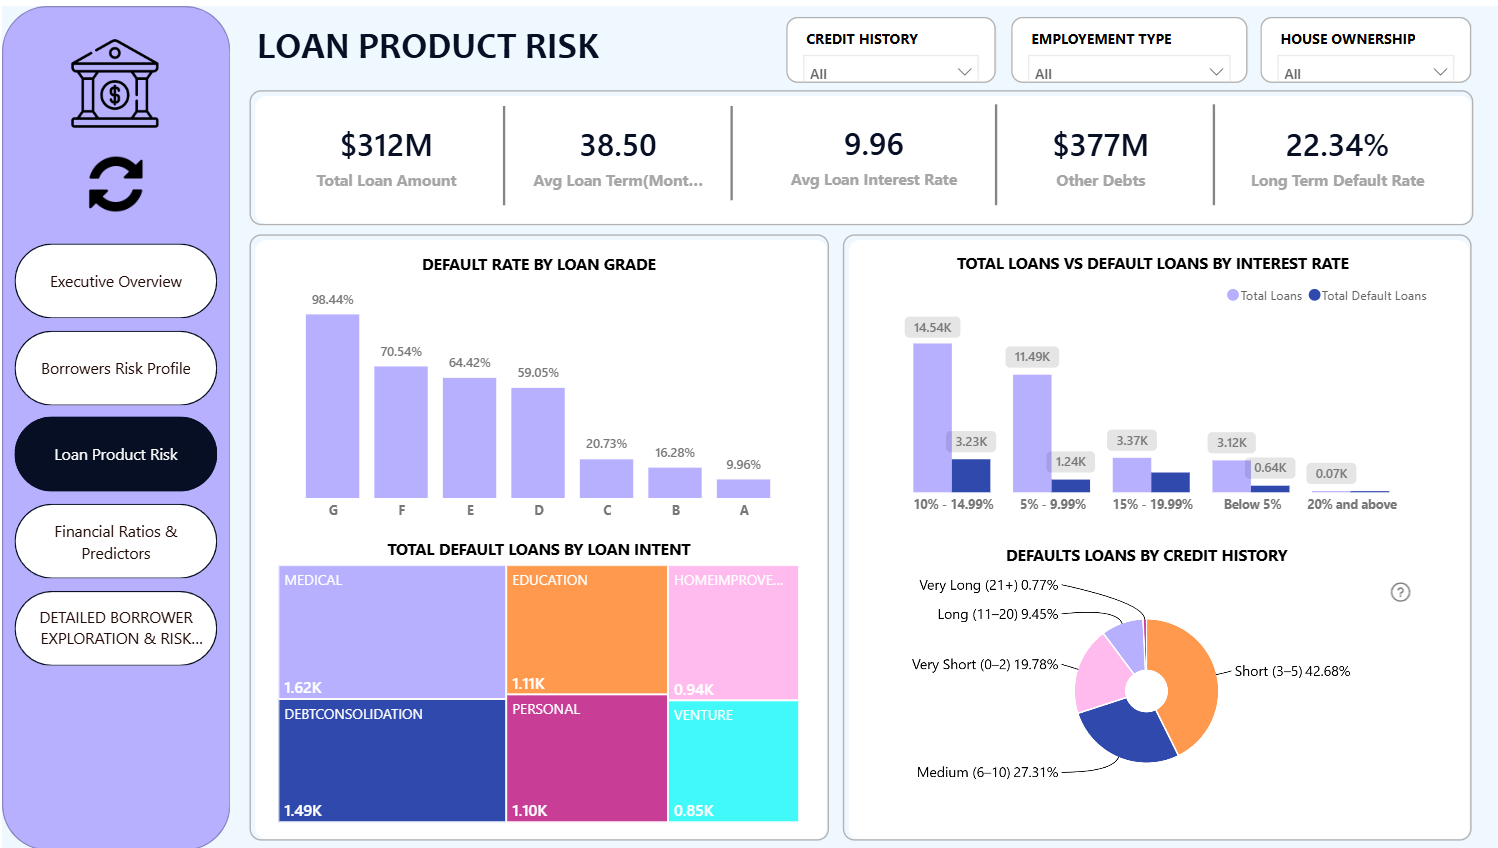
This Power BI report provides a comprehensive analysis of credit risk to help Nova Bank make informed and balanced lending decisions. By examining borrower demographics, financial indicators, loan characteristics, and repayment outcomes, the report uncovers key patterns that influence the likelihood of loan default. The analysis highlights several critical insights. Borrowers with a debt-to-income ratio above 0.6 are significantly more likely to default, indicating that debt burden is a strong predictor of repayment behavior. Longer loan terms (e.g., 60 months) are associated with higher default rates, while borrowers with shorter credit histories show increased risk compared to those with established credit records. Additionally, previous default history substantially raises the probability of future defaults, and Grade G loans, although fewer in number, exhibit extremely high default rates (\~98%). The dashboard uses interactive visuals and key performance indicators to make these patterns easy to explore and understand, enabling Nova Bank to identify risky borrower segments, refine lending policies, and enhance overall credit decision-making.

ZoomCharts visuals used

Drill Down Pie PRO Drill Down Pie PRO
Drill Down Donut PRO Drill Down Donut PRO

Need help?

Send your question to ZoomCharts assistant, and we will respond to you as soon as possible.

Contact Us

Mobile view allows you to interact with the report. To Download the template please switch to desktop view.

Report Overhaul

ZoomCharts Academy

Learn ZoomCharts with experts and become certified!

Go to Academy!
Report Overhaul

Was this helpful? Thank you for your feedback!

Sorry about that.

How can we improve it?

Bank Credit Risk Analysis

Share

ZoomCharts

Welcome to ZoomCharts

You’re almost there! Create an account to keep your saved reports.

or
Sign up with Microsoft

Verify your email address

We have sent a code to your email address. Please input the code below.

Didn't receive code? Request again (after 30 seconds)

Already have an account? Log in

ZoomCharts

Log in to your ZoomCharts account

Log in with Microsoft
or
Forgot password?

Reset your password

We'll email you instructions on how to reset your password

Don't have an account? Sign up

Please add credits

You have 0 available downloads.
Get more credits or upgrade your plan to continue.

View pricing
logo
[email protected]
+44 204 577 3993
logo

Products

Drill Down Network PRO Drill Down Waterfall PRO Drill Down Graph PRO Drill Down Combo PRO Drill Down Combo Bar PRO Drill Down Donut PRO Drill Down Pie PRO Drill Down TimeSeries PRO Drill Down Timeline PRO Drill Down Map PRO Drill Down Scatter PRO All Visuals

Resources

Report Examples Webinars Blog ZoomCharts Academy Visuals Gallery Documentation Custom Visual Development Subscribe to News

Solutions

Custom Visual Development

Company

Pricing About Us Partners Leave feedback Join PowerGroup EU Funding

Help

ZoomCharts Assistance Contact Sales Contact Support FAQ

Drill Down Network PRO Drill Down Waterfall PRO Drill Down Graph PRO Drill Down Combo PRO Drill Down Combo Bar PRO Drill Down Donut PRO Drill Down Pie PRO Drill Down TimeSeries PRO Drill Down Timeline PRO Drill Down Map PRO Drill Down Scatter PRO All Visuals

Report Examples Webinars Blog ZoomCharts Academy Visuals Gallery Documentation Custom Visual Development Subscribe to News

Custom Visual Development

Pricing About Us Partners Leave feedback Join PowerGroup EU Funding

ZoomCharts Assistance Contact Sales Contact Support FAQ
+44 204 577 3993
[email protected]

Ready to get in touch?

Contact our experts with any question about Power BI and ZoomCharts for Free!

Contact us

© 2025, Data Visualization Software Lab

U.S. Patents No. 11,645,343; 11,921,804; 12,346,389

Cookies
Privacy Policy
Global
Legal
Patent
warning

Error message

success

Success info: Done!

ZoomCharts AI Assistant

We noticed you're using an old OS version.

For the best experience, we recommend upgrading to ensure that all website features display correctly.

Cookie settings

We use necessary cookies for site functionality, as well as statistic, marketing, and preference cookies to enhance your experience. For more information and to manage your preferences, please visit our Cookie policy