1190
Student Performance Power BI Report 20
Student Performance Power BI Report 20
More Report pages
Report Author: Menna Samir
1190
Share template with others
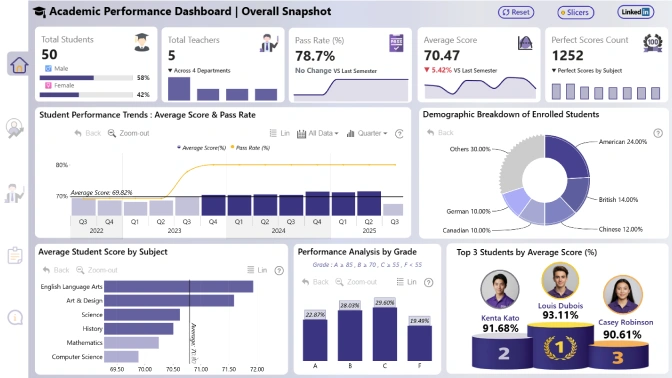
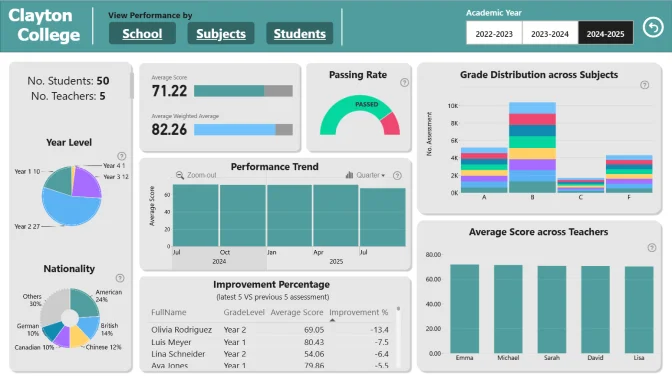
This Power BI report uses the Education/Student Performance dataset and features ZoomCharts Drill Down PRO custom visuals for Power BI. It was submitted to the FP20 Analytics ZoomCharts Data Challenge 31 in October 2025.
Author Description:
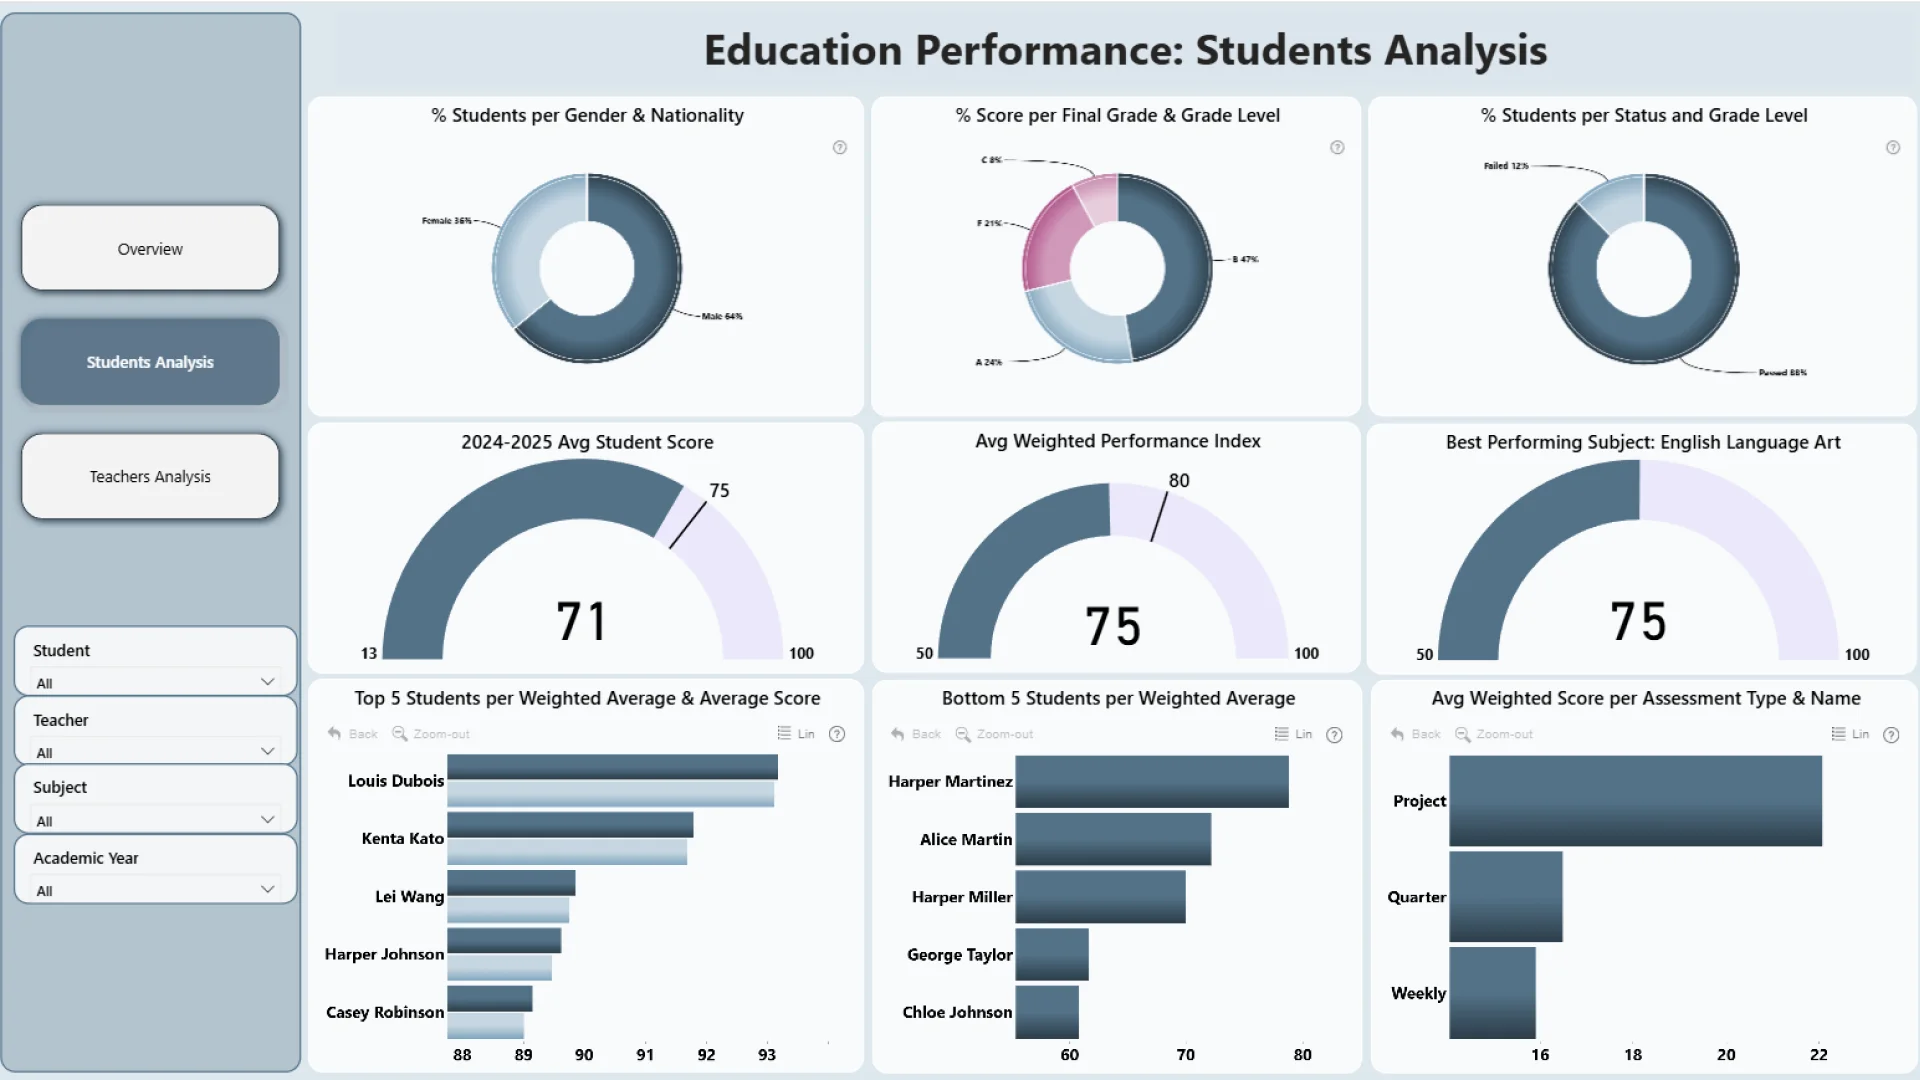
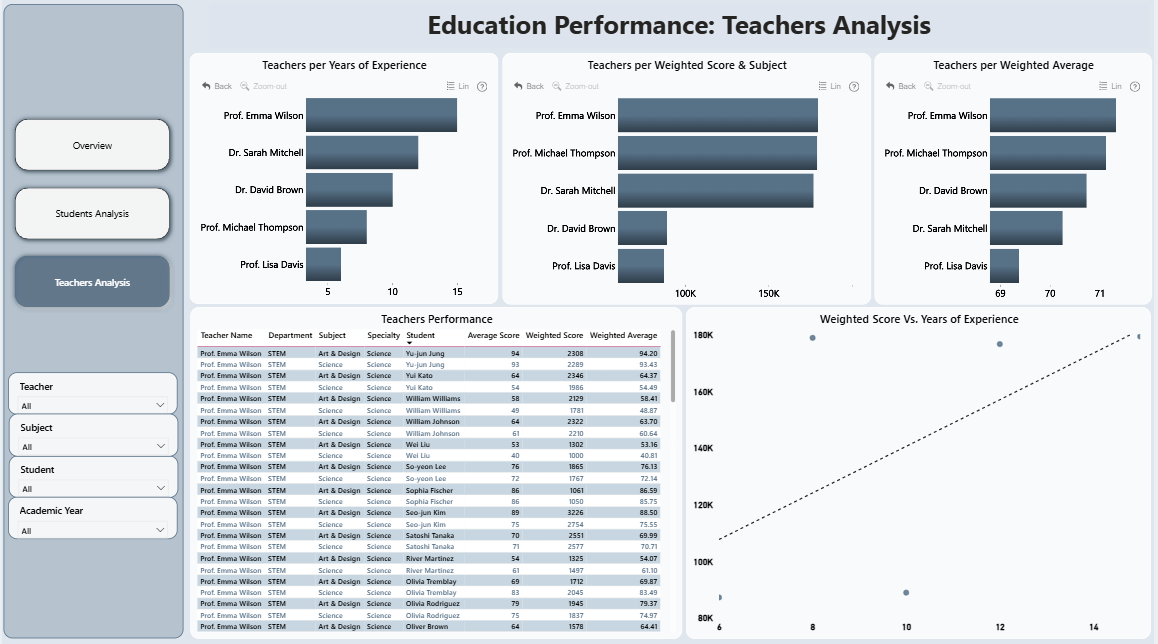
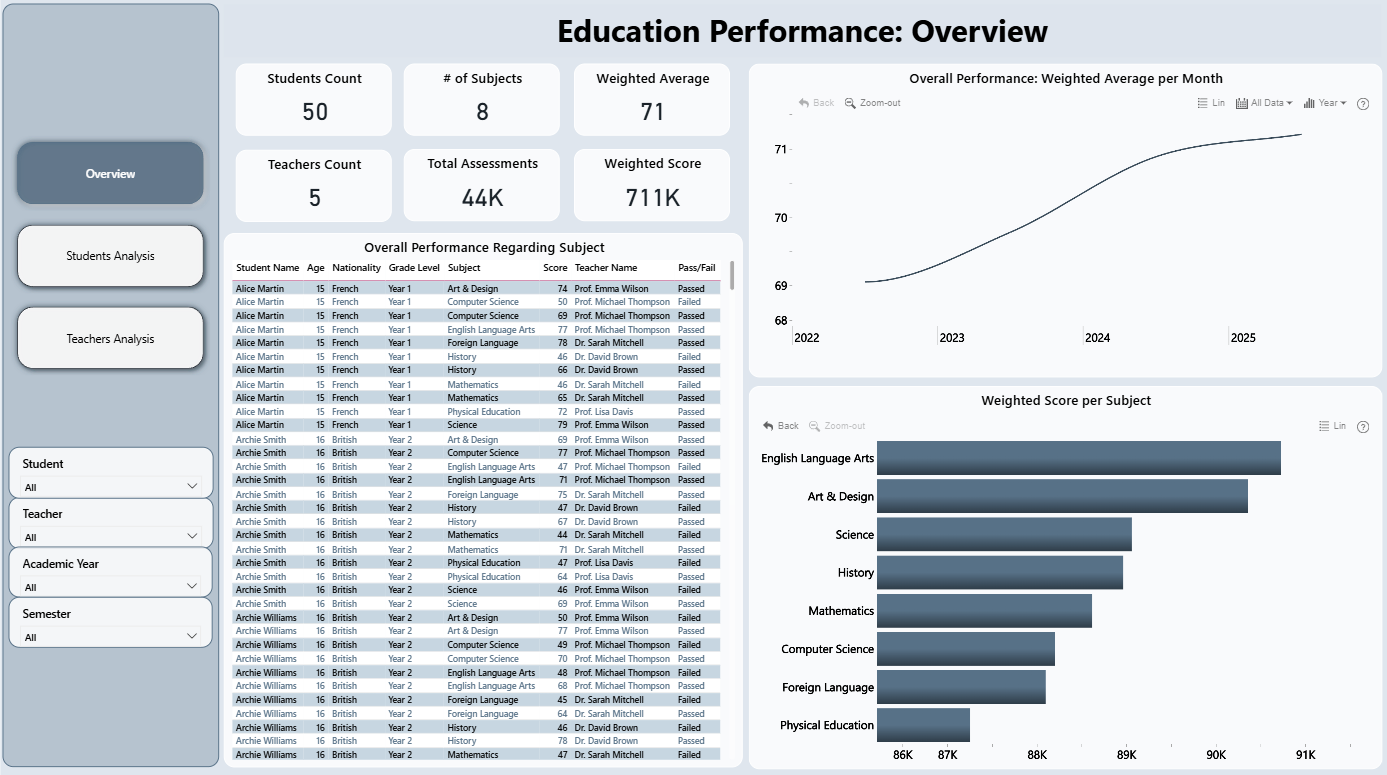
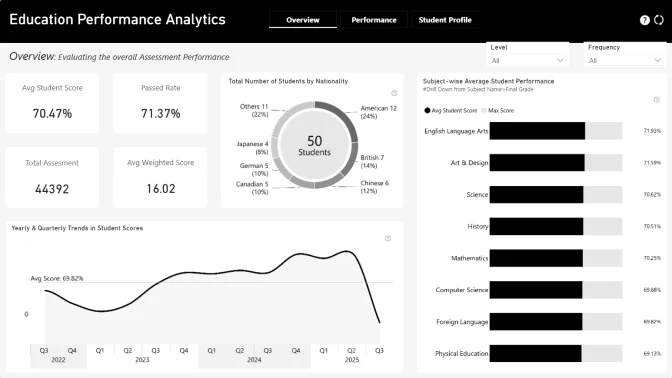
This analysis evaluates overall academic performance by examining both student and teacher data. It highlights key trends in grades, identifies top and struggling students, and measures teacher effectiveness based on class outcomes. The goal is to provide data-driven insights to improve learning results and teaching quality. In this analysis, I counted on using slicers as the filters and I edited the interaction between the visuals, so they are interactive but don't affect each other as I want filtering to be done using the slicers and I colored the filter pane with different color for the page that I am using special filters for its visuals.
4U Report Challenges
Participate in data challenges, build and submit reports to get free template downloads.
Join CommunityMobile view allows you to interact with the report. To Download the template please switch to desktop view.
Was this helpful? Thank you for your feedback!
Sorry about that.
How can we improve it?