1697
Sweet Success - Unwrapping Candy Market Trends
Sweet Success - Unwrapping Candy Market Trends
More Report pages
Report Author: Jason Carl Martin Tupas
1697
Share template with others
Report submitted for the FP20 Analytics ZoomCharts Challenge, November 2024. The report was built using the Candy Market Share dataset and includes ZoomCharts custom Drill Down PRO visuals for Power BI.
Author's description:
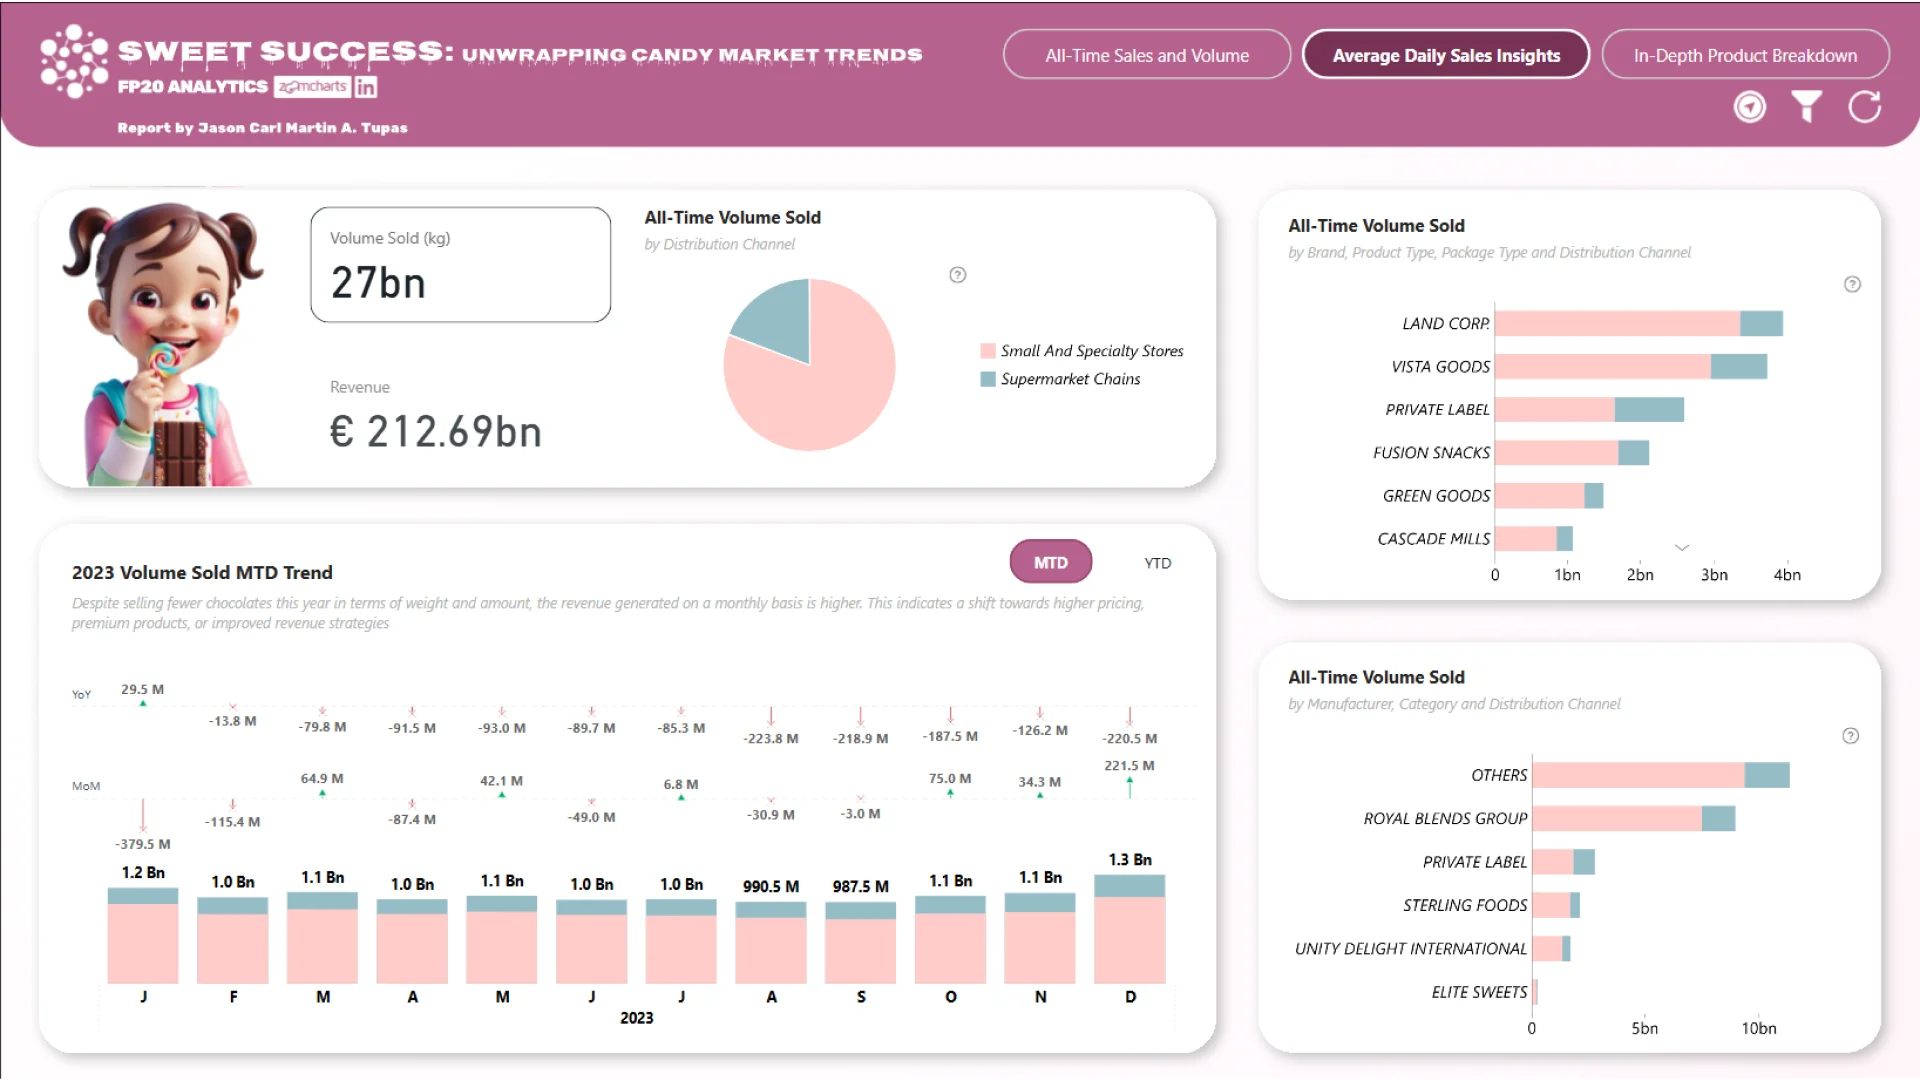
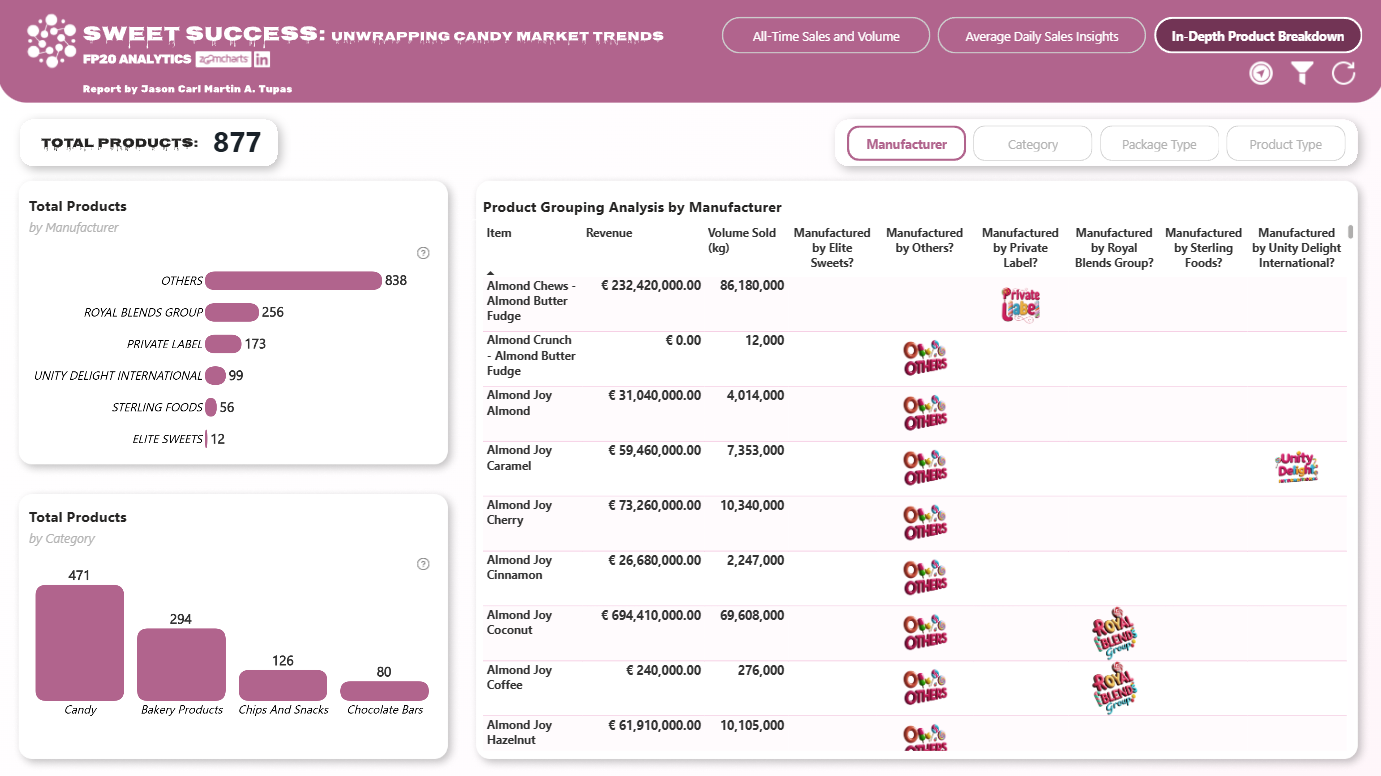
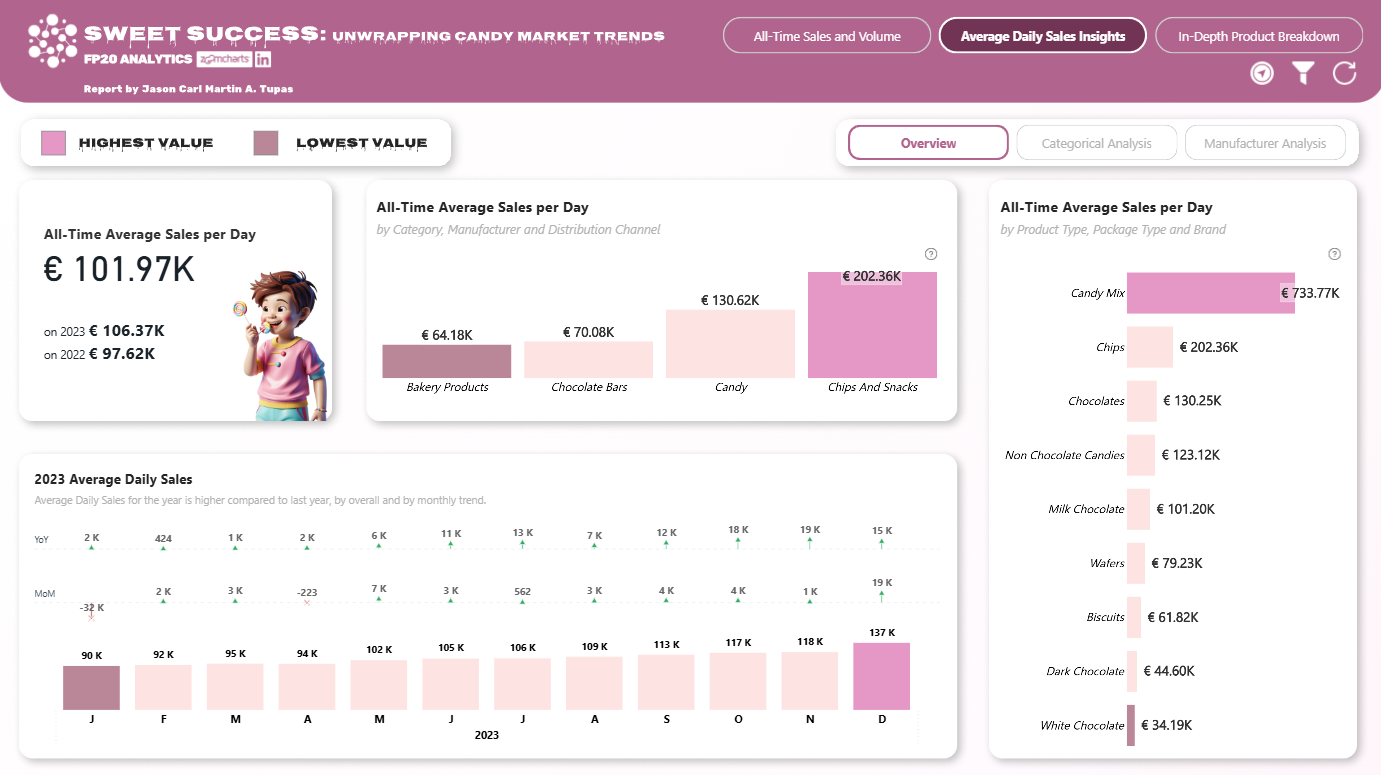
Hi #datafam! I am participating in FP20 Analytics Challenge 20! And I am submitting it on NovyPro's Project of the Month Competition! The challenge was as exciting as it was insightful—analyzing data that showcased market share dynamics, category-level trends, and consumption volumes for major manufacturers, brands, and packaging. My report features:
🔹 All-Time Sales and Volume
🔹 Average Daily Sales Insights
🔹 In-Depth Product Breakdown
Through this report, I transformed raw data into actionable insights, helping company researchers make strategic decisions in this competitive and delicious industry! From uncovering hidden trends to creating visually appealing dashboards, this project tested both my analytical and creative skills. With a clean layout and intuitive navigation, the report includes:
✅ A guided report tour to highlight key features
✅ A smart filter pane for seamless data exploration
✅ A remove filter across all pages


4U Report Challenges
Participate in data challenges, build and submit reports to get free template downloads.
Join CommunityMobile view allows you to interact with the report. To Download the template please switch to desktop view.
How to use a PBIX template
Preview the interactive report, download the PBIX file, open it in Power BI Desktop, and replace the same data connection with your own dataset.
Preview and download
Explore the report online and download the PBIX template file.
Open in Power BI Desktop
Open the downloaded PBIX file in Power BI Desktop.
Connect your data
Replace the sample data source with your own dataset.
Refresh and adjust
Refresh the model and update fields or visual were needed.
Save and share
Save your report and publish it for your audience.


