About the FP20 Analytics ZoomCharts Data Challenge
Dive into the dataset, build a Power BI report, practice your data visualization skills, and compete for prizes.
🏆 Main Prize: $300 Amazon Gift Card
Want to build professional Power BI reports and grow your portfolio?
This challenge helps you level up with expert feedback, hands-on workshops, webinars with MVPs, and visibility in our public results showcase. It’s a great way to learn, gain recognition, and connect with a supportive data community.
The challenge is hosted in partnership with FP20 Analytics - a LinkedIn community that brings together 20k+ passionate data professionals and helps new analysts improve their craft. It’s a welcoming space where you can practice, learn, and share your work with others. Learn more about the FP20 Analytics challenge on their website.
Benefits of joining the challenge
➤ Live Workshops & 1:1 Mentoring
Learn directly from experienced Power BI professionals. Enjoy practical workshops on report-building techniques and book a one-on-one mentoring session to receive tailored advice on your submission.
➤ Personalized Feedback
Every participant receives detailed, constructive feedback on their report. It’s a valuable opportunity to improve your skills with real insights from seasoned analysts.
➤ Free ZoomCharts Custom Visuals License
All participants receive a ZoomCharts Developer License, giving you full access to the Drill Down PRO visuals library.
➤ Free Report Downloads
Each challenge participant with a validated report will receive 5 free downloads from the Power BI Report Gallery.
Prizes 🏆
- The best report using ZoomCharts visuals will receive a $300 Amazon Gift Card.
- Being selected in the Top 5 will grant you +10 free downloads from the Power BI Report Gallery.
- All participants of the FP20 Analytics challenge also compete for amazing prizes from Skillwave, The Data Vis Force, and Enterprise DNA
The winners will be announced during a special live webinar on April 16. Join the live winner announcement and top submissions review here.
Webinar recordings
How to Participate in the FP20 Analytics & ZoomCharts Challenge
1. Register for the Challenge
-
Register using the form above on this page.
-
Download the dataset using the "Get the Dataset" button on this page.
-
Read the challenge brief in the "The Brief" section to understand the data and requirements.
-
Activate your free Drill Down Visuals Developer License for Power BI. (watch the setup video or follow the step-by-step instructions).
2. Build Your Report in Power BI
-
Add your ZoomCharts Developers license to Power BI Desktop.
-
Add ZoomCharts visuals from the Power BI visuals library or Microsoft Marketplace.
-
Build your report using the challenge dataset.
-
Recommended report format:
3. Improve Your Report and Learn New Skills
-
Join the challenge workshop to learn how to use the dataset
-
If you need help, book a free 1-on-1 consultation with the ZoomCharts team to discuss your report
-
Look at previous challenge submissions for ideas and inspiration in the report gallery.
4. Submit Your Challenge Entry
Validation timeline:
-
Your report will be reviewed within 1–2 business days.
-
Once validated, you will receive a Publish to Web link that you can use in your portfolio or share online.
-
You will also receive personalized feedback within 1–2 business days to help you improve your report.
Note:
You may resubmit your entry as many times as needed before the challenge deadline.
5. Finalize Your Participation to Compete for the ZoomCharts Grand Prize
To be eligible for all prizes, complete these steps:
-
Post the final version of your report (PDF) on your LinkedIn profile.
-
Use this caption:
"I am participating in FP20 Analytics ZoomCharts Challenge 36"
-
Include a short summary of your report and the Publish to Web link (if you have one).
-
Use the hashtags #FP20Analytics and #builtwithzoomcharts and tag @Federico Pastor and @ZoomCharts.
-
Obligatory! Share your report also in the FP20 Analytics LinkedIn Community group.
-
Follow ZoomCharts on LinkedIn.
- Rate ZoomCharts visuals at Microsoft Marketplace.
6. Attend the Live Closing Webinar
-
The ZoomCharts team reviews and analyzes the Top 5 challenge submissions during the live webinar.
-
You will learn best practices, visualization tips, and new Power BI skills.
-
The winner of the best report receives a $300 Amazon gift card from ZoomCharts.
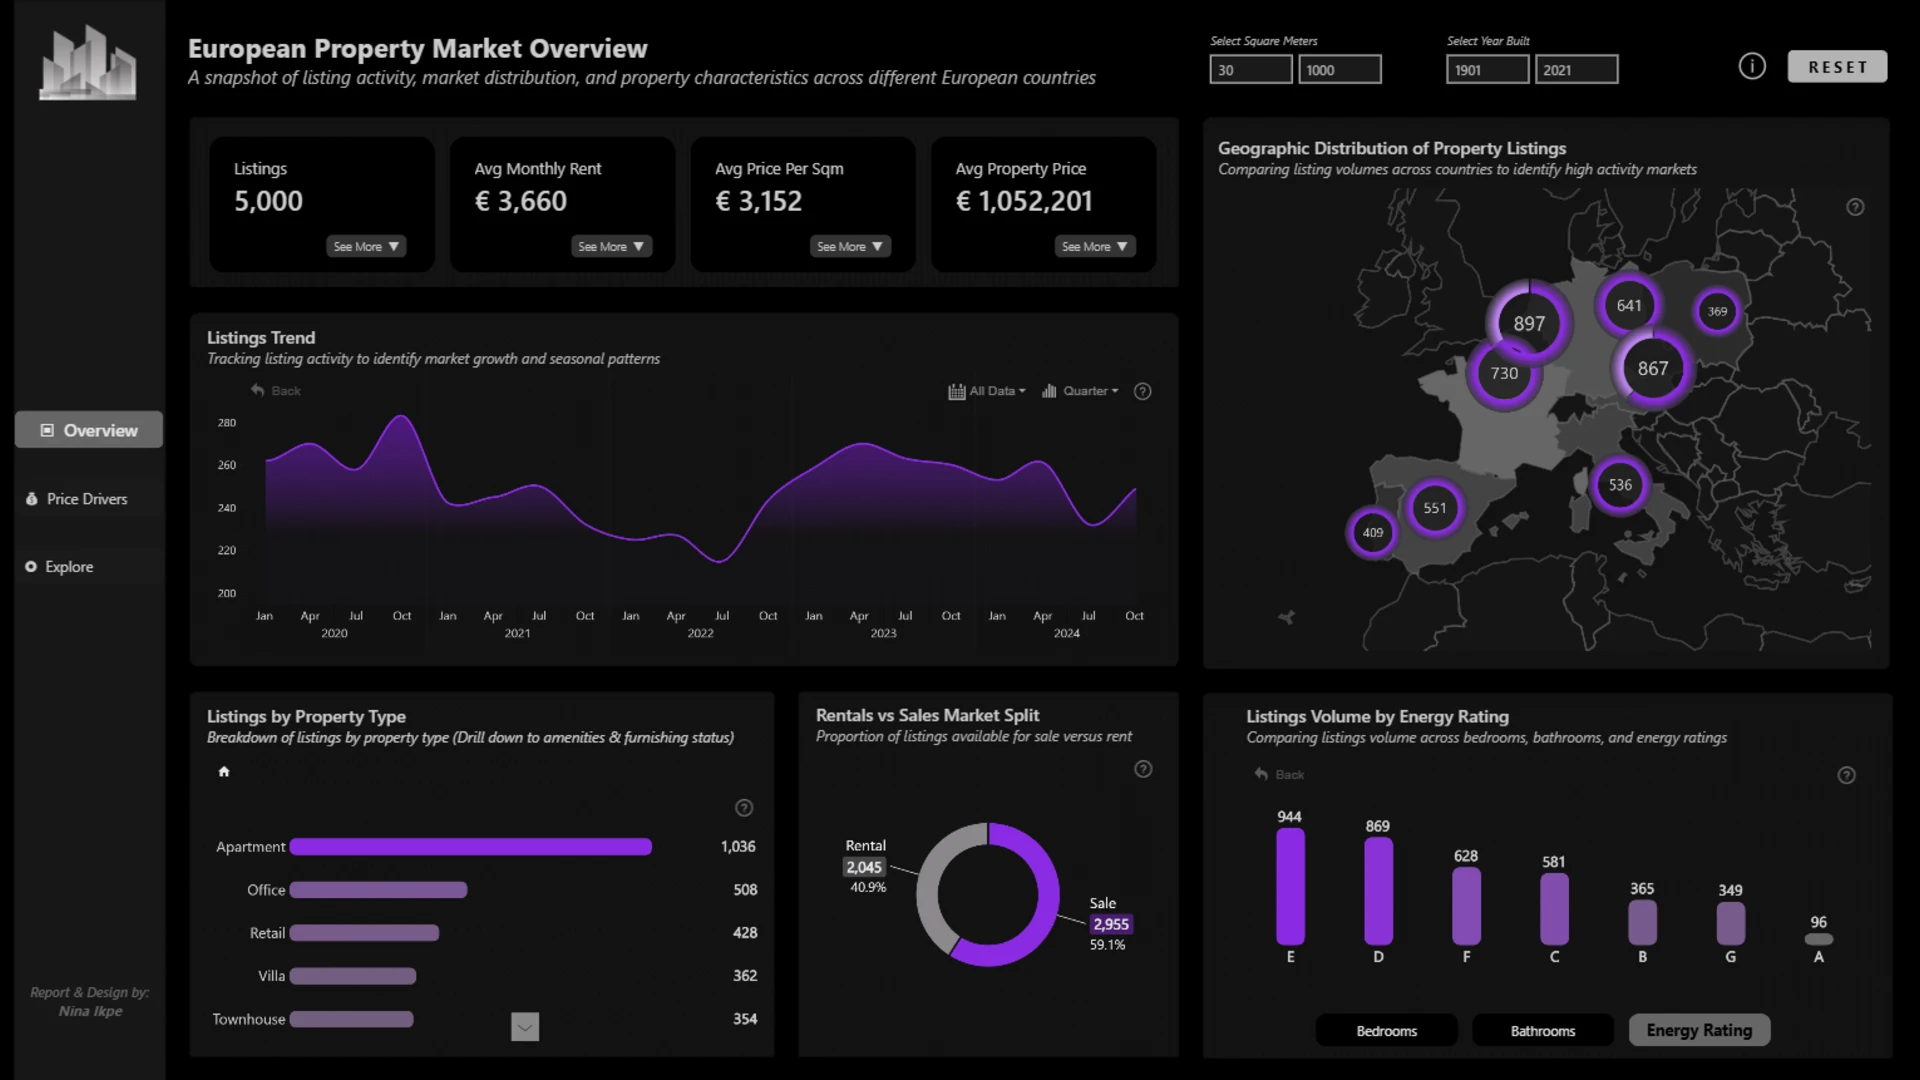
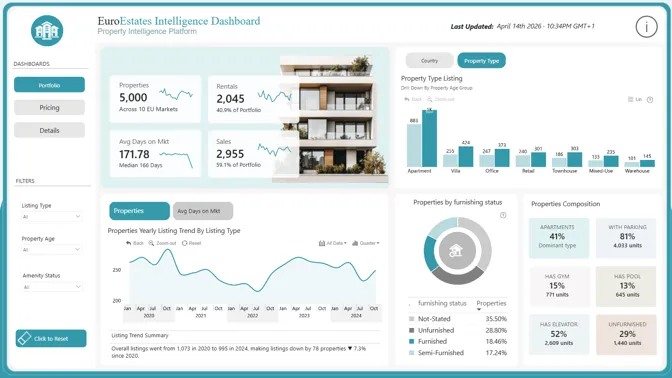
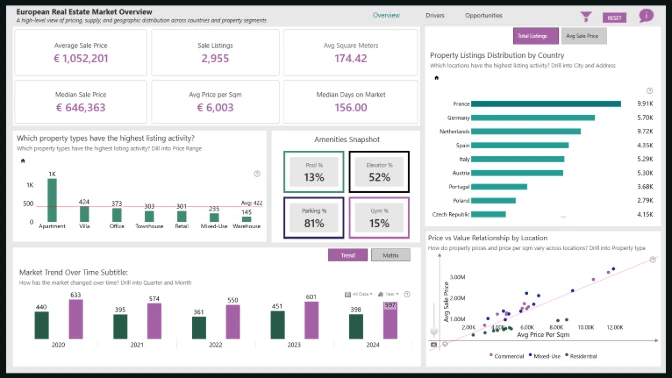
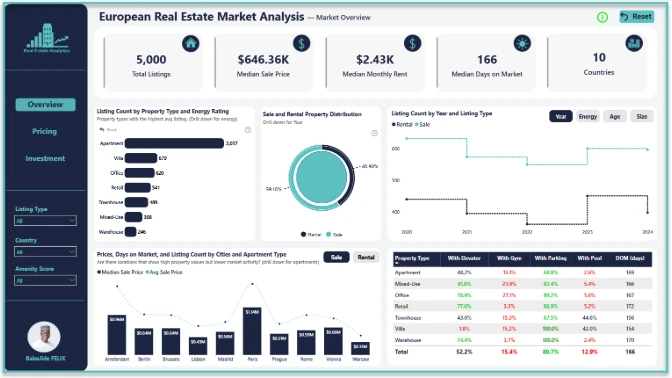
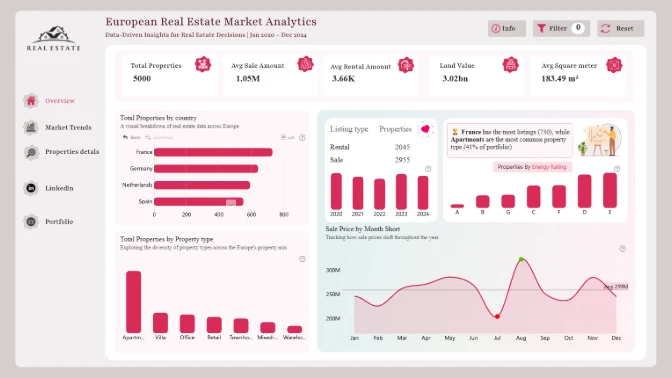
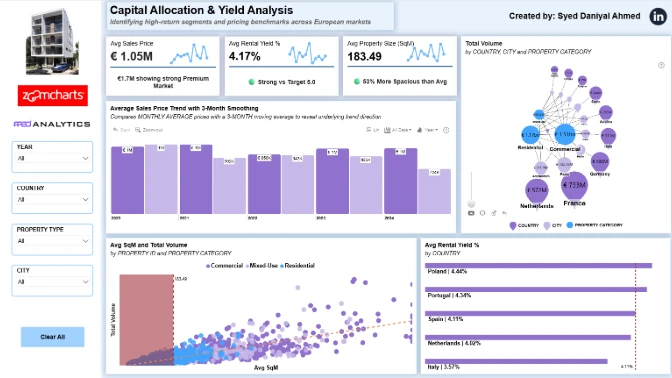
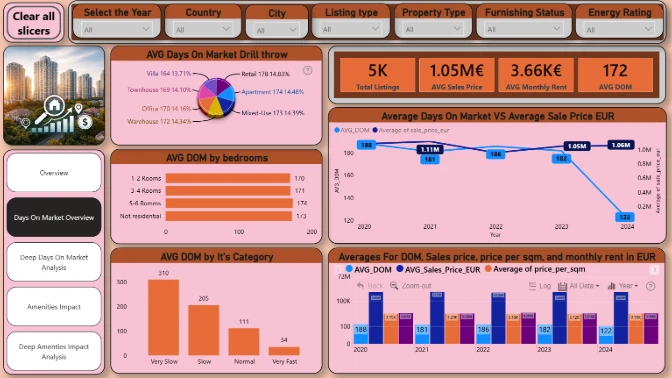
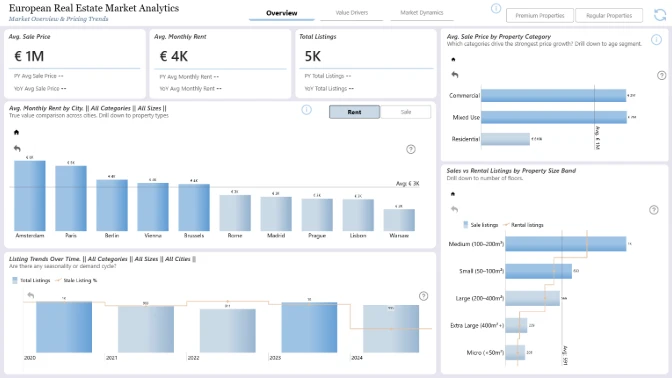
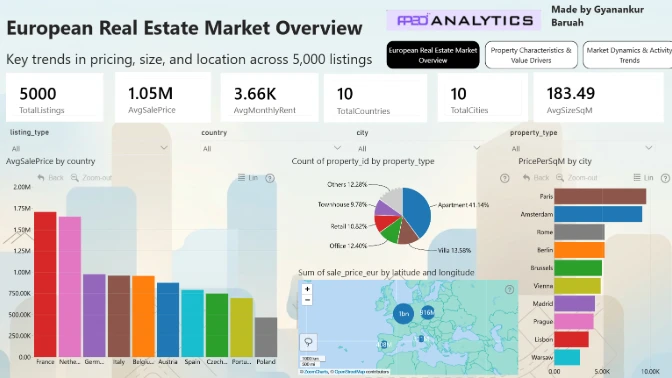
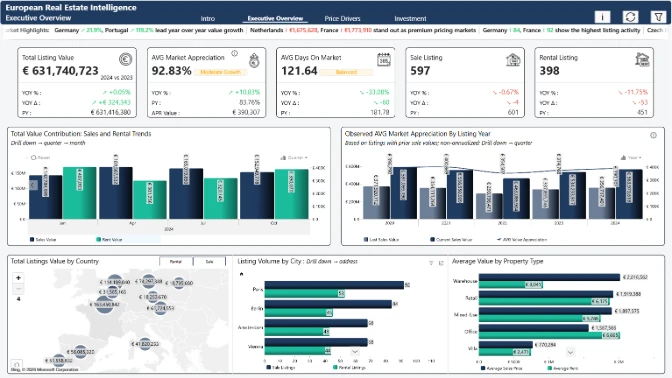
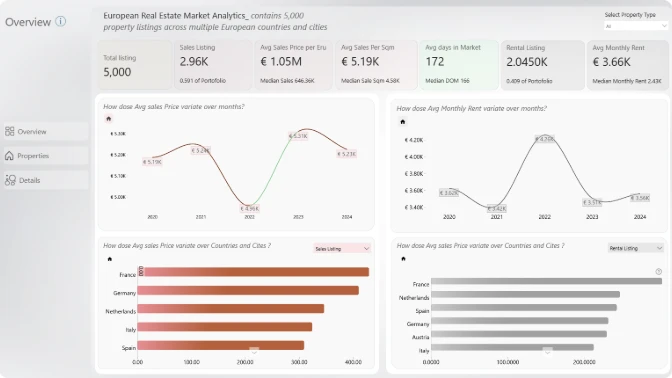
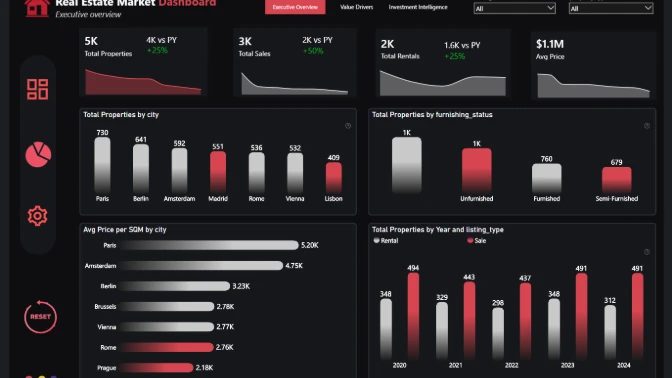
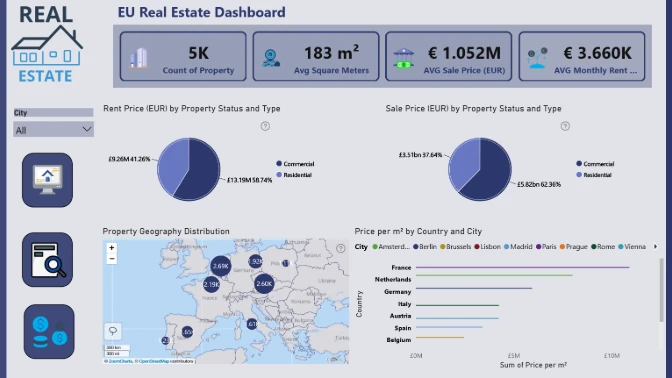
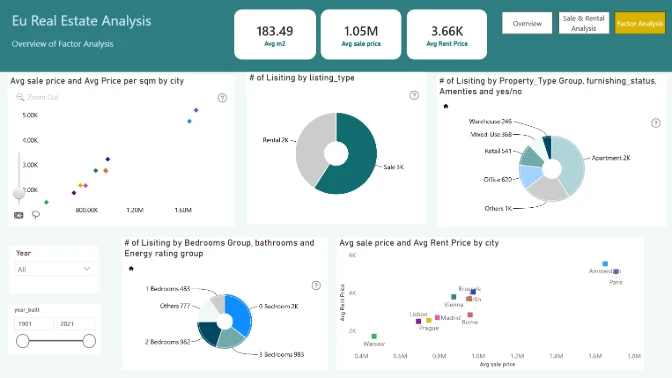
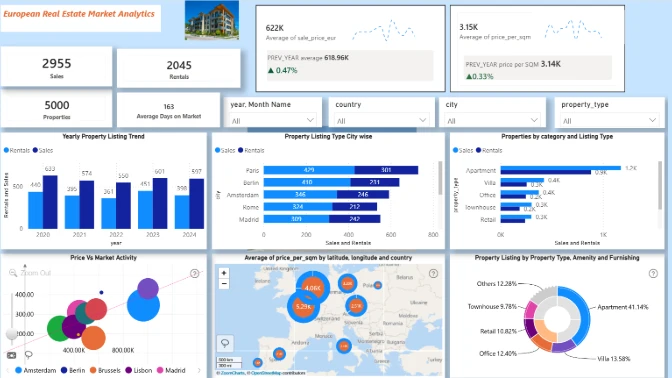
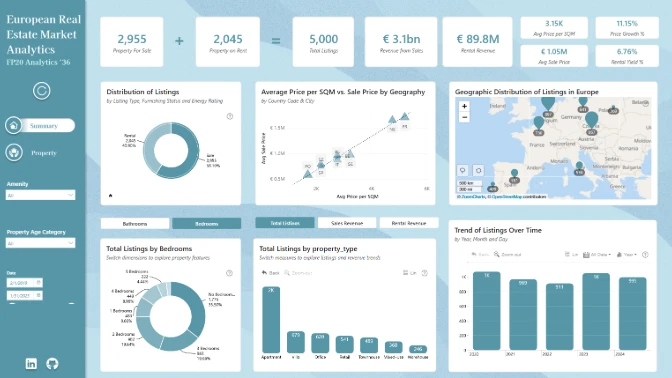
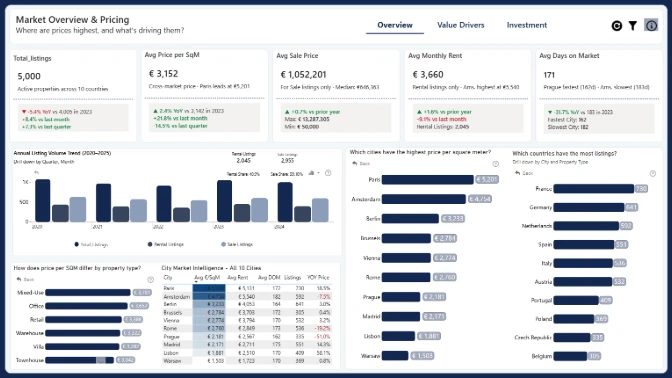
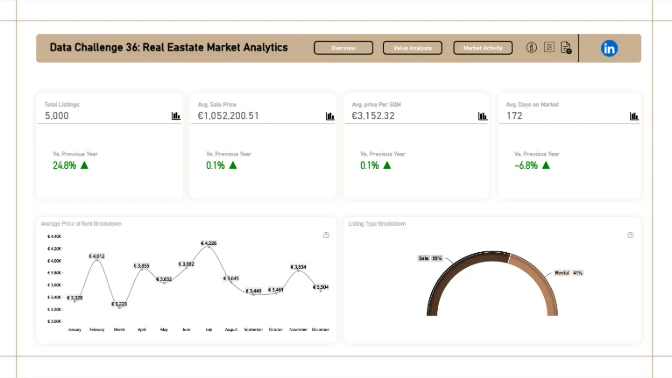
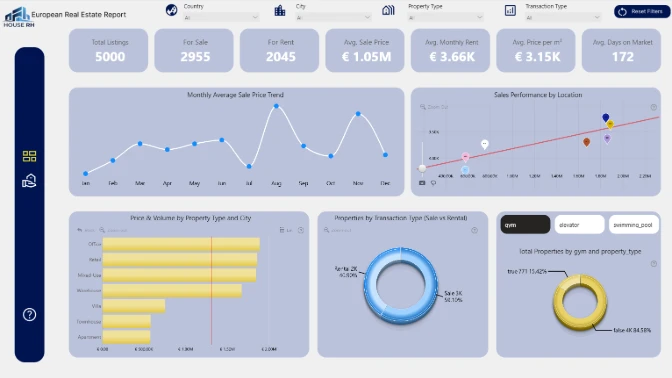
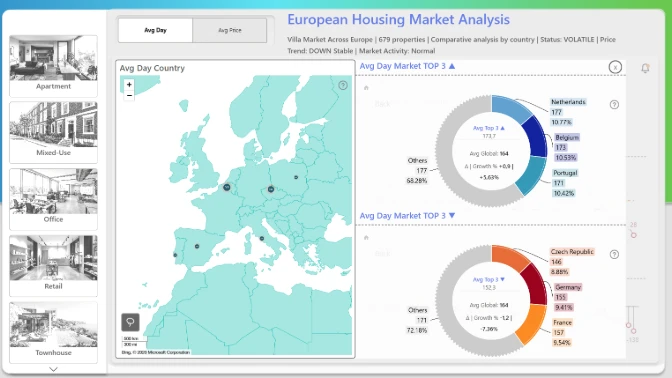
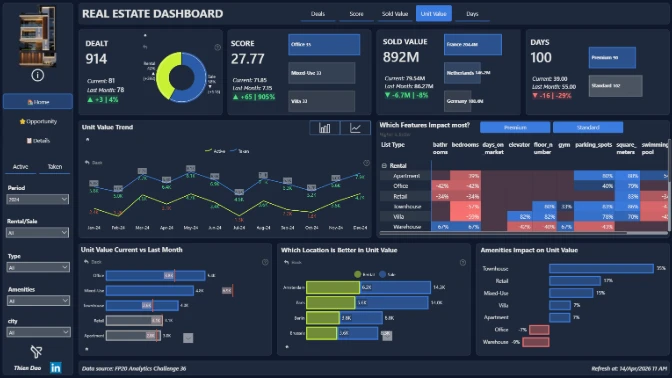
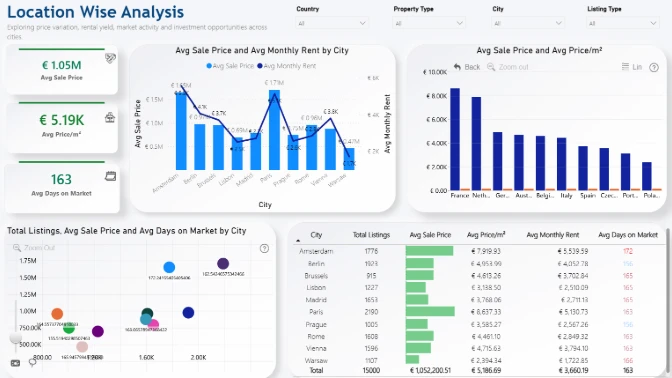
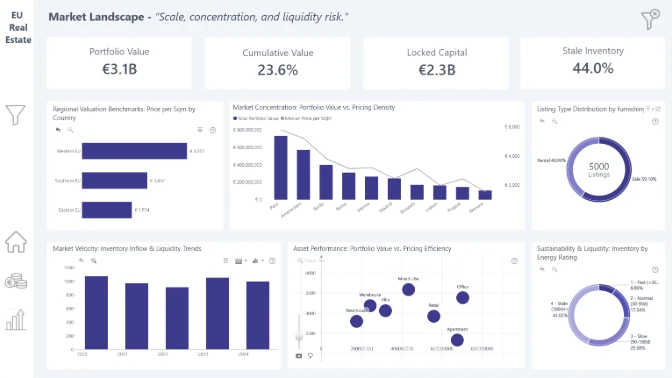
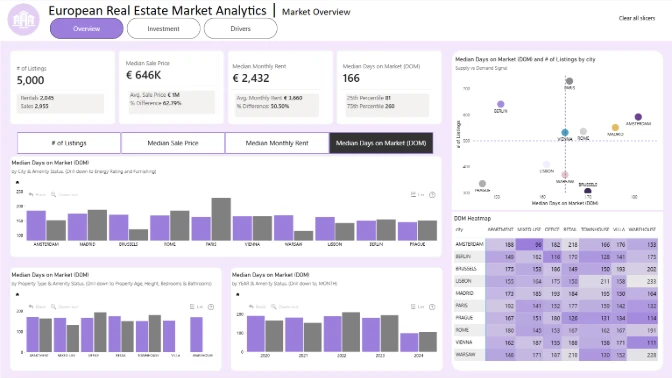
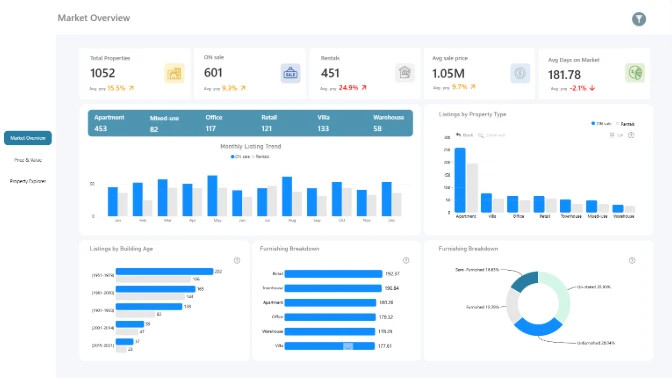
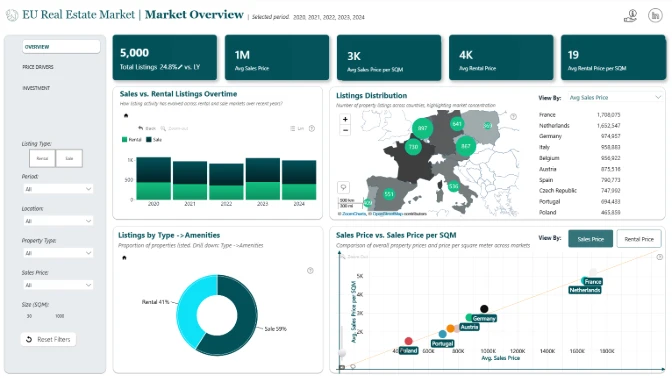
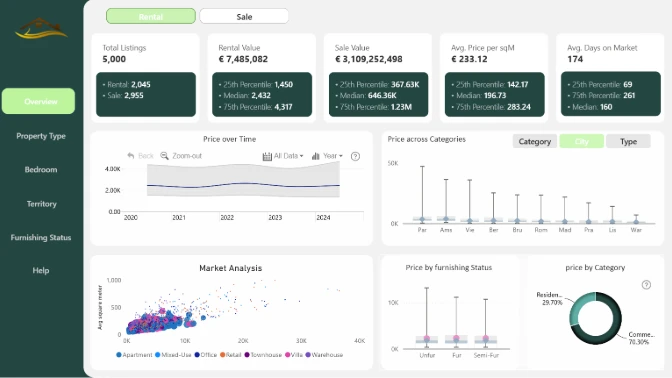
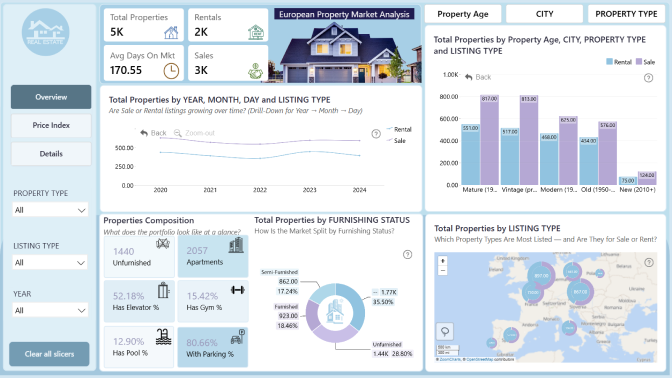
European Real Estate Market Analytics
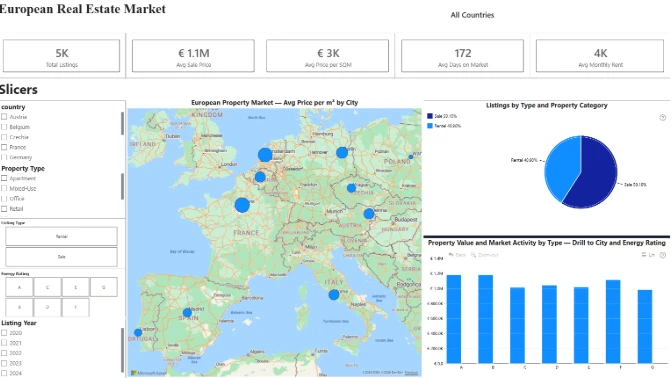
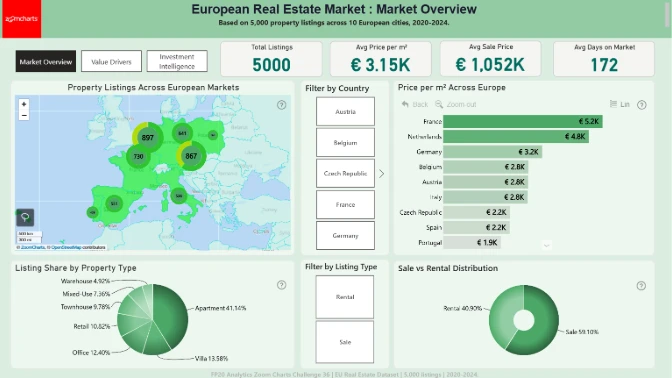
In this challenge, you will work with a realistic real estate marketplace dataset representing a European property listing platform. The dataset contains 5,000 property listings across multiple European countries and cities, including detailed information about property characteristics, pricing, amenities, and listing activity.
Your task is to build an interactive Power BI report that real estate analysts, property investors, and marketplace product teams can use as a decision-making tool for understanding market trends, comparing locations, and evaluating property value drivers.
Key Questions to Explore
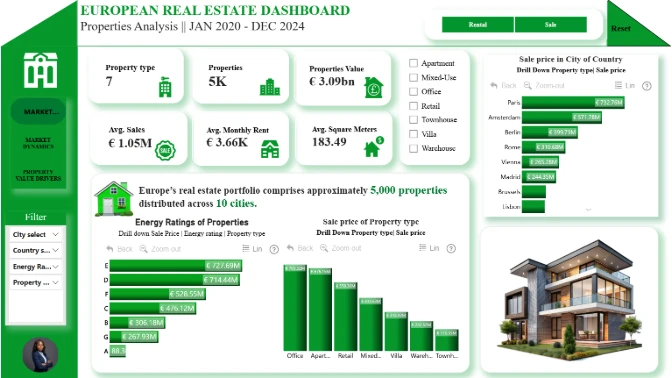
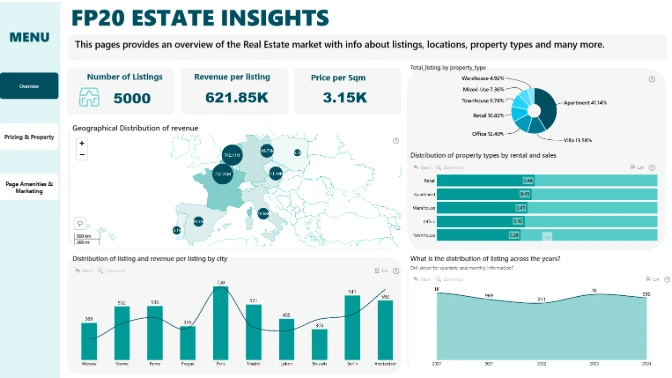
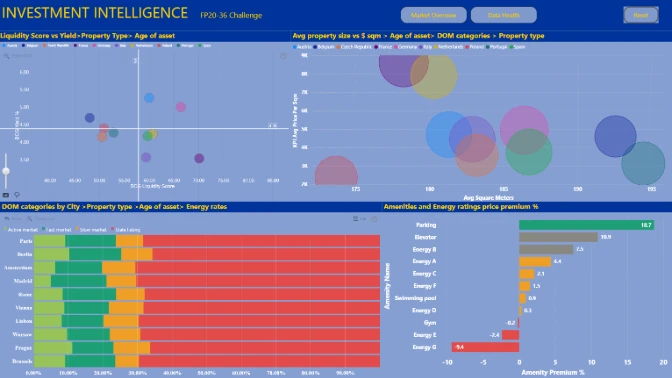
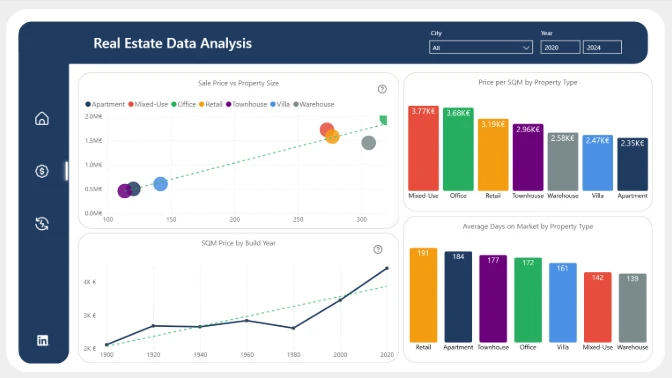
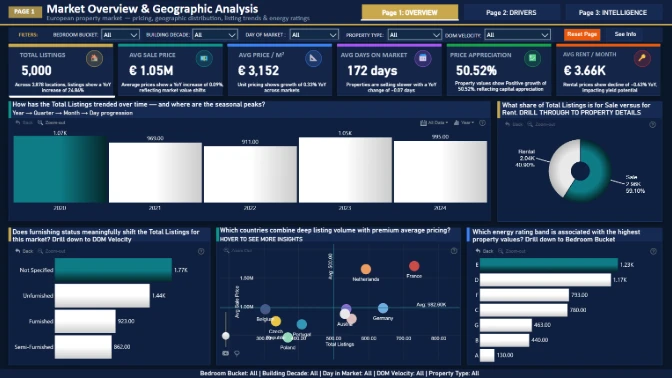
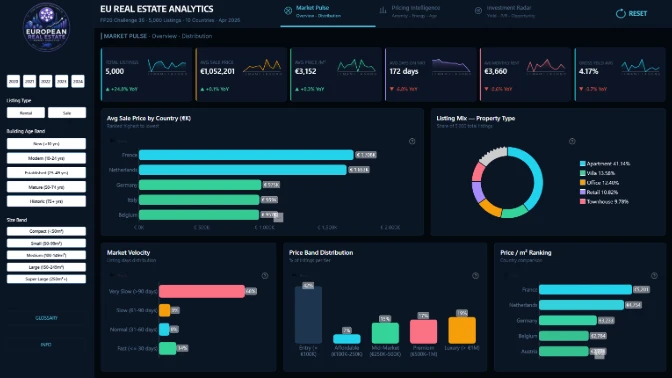
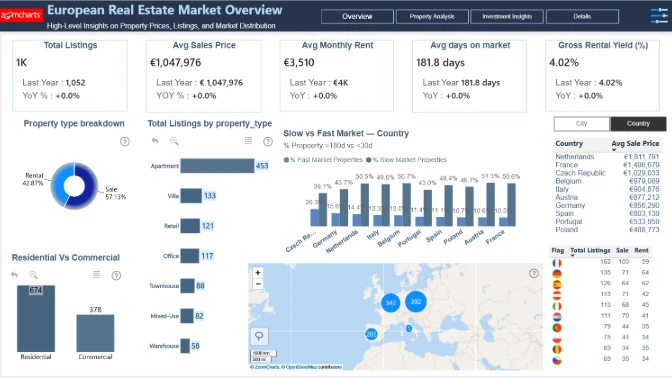
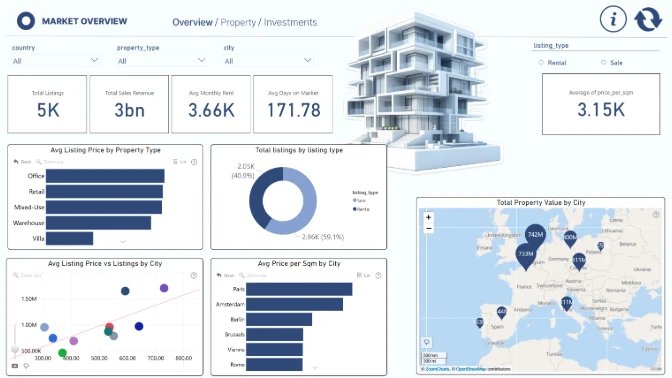
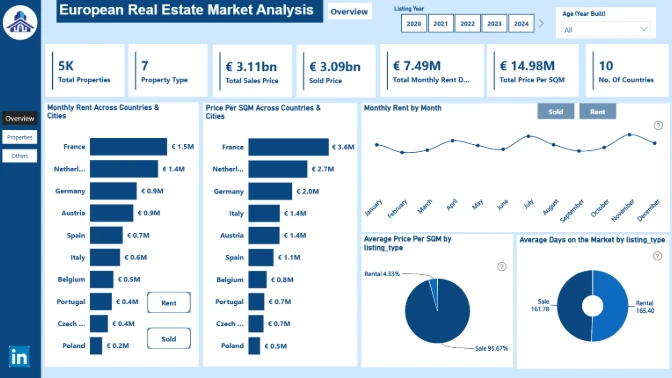
- How do property prices and price per square meter vary across countries and cities?
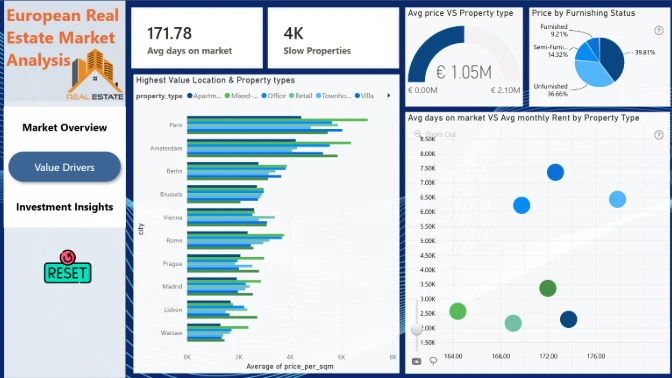
- Which locations and property types have the highest average listing values?
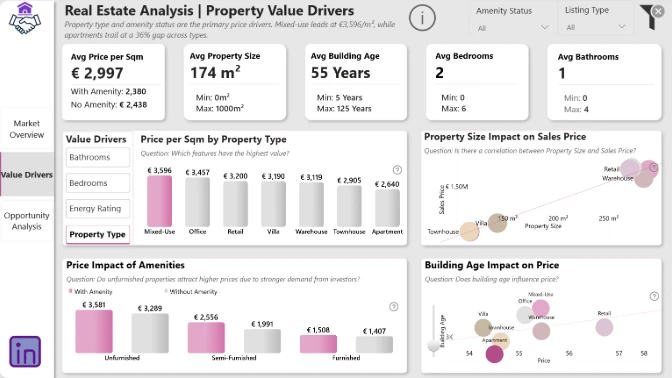
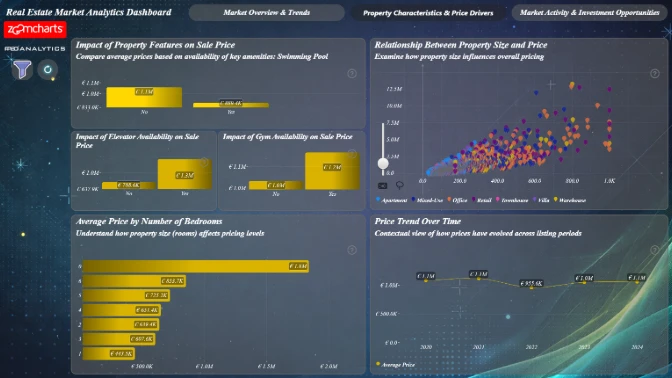
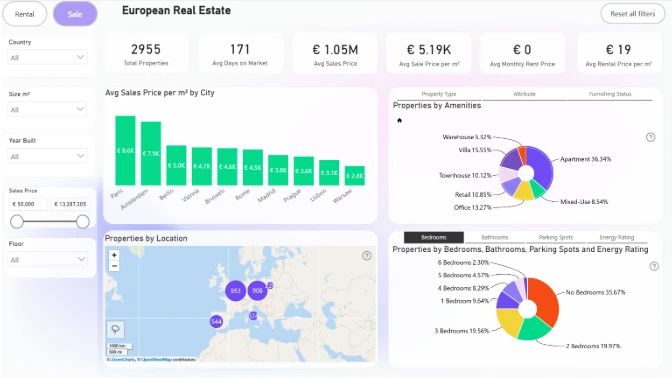
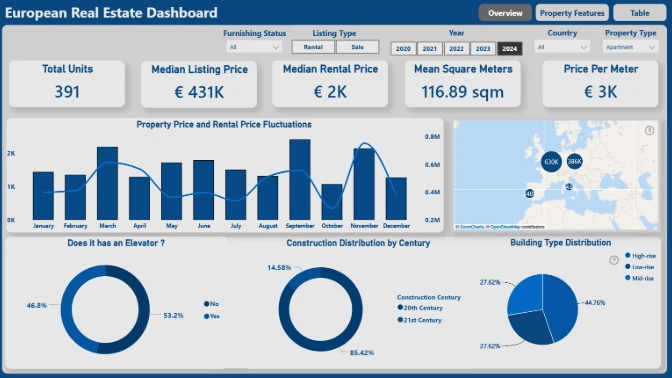
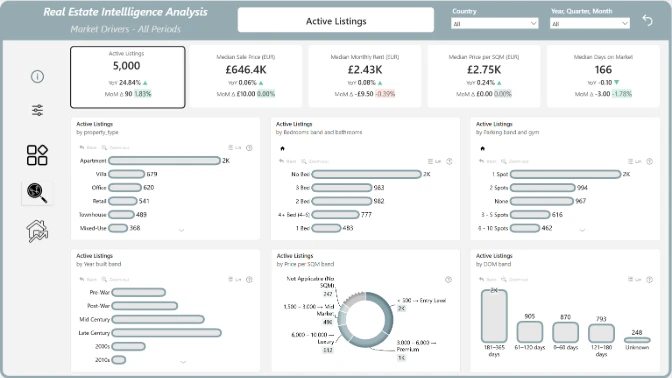
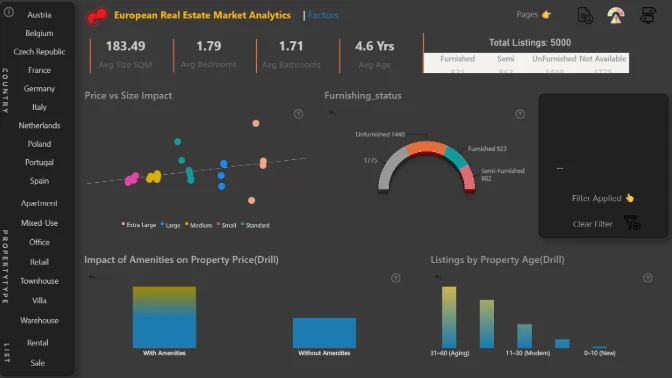
- How do property characteristics such as size, bedrooms, bathrooms, and building age influence pricing?
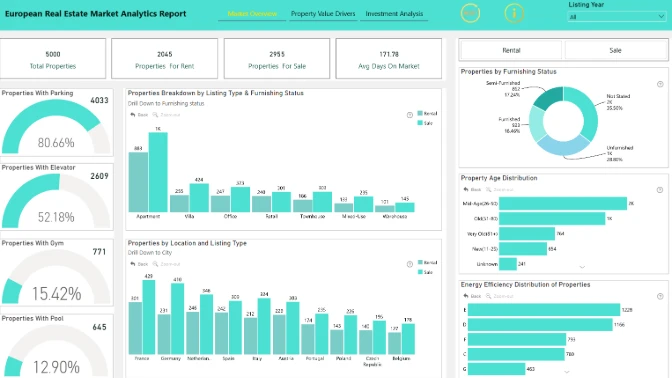
- Do properties with premium amenities (parking, elevators, gyms, pools) command higher prices?
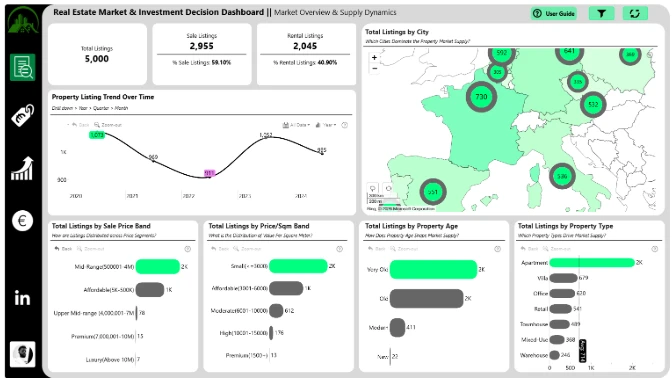
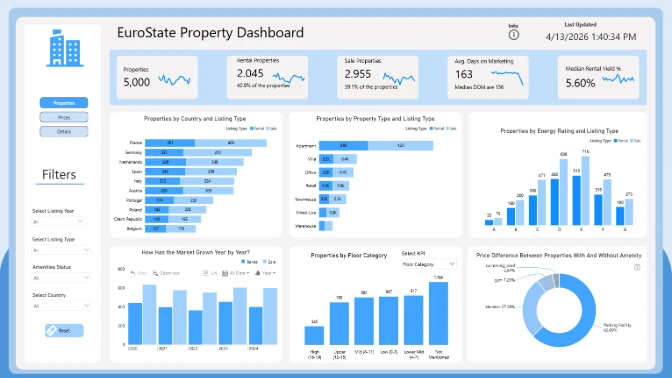
- Which properties stay longest on the market, and what factors might explain it?
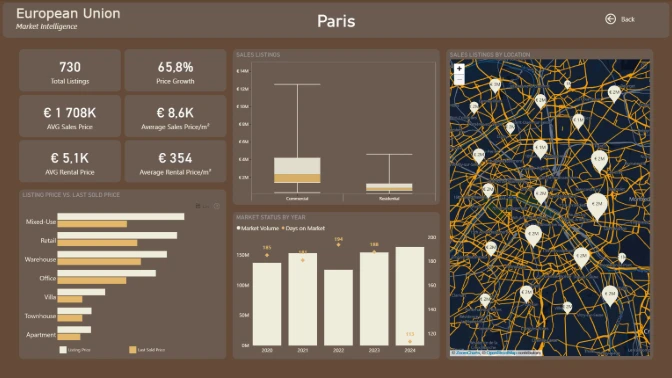
- Are there locations that show high property values but lower market activity?
- Which cities might present the most attractive opportunities for real estate investors?
✨ Note: These questions are only suggestions. Feel free to explore the dataset creatively and uncover insights that could help investors, agencies, and buyers better understand the European property market.
Your Objective
Create a Power BI report that helps analyze the European real estate listings dataset. The report should allow users to compare property prices across locations, understand differences between property types, and explore how property characteristics relate to pricing and listing activity.
Use clear visuals and filters and drill downs to help users explore the data and identify patterns in the housing market.
Judging criteria
Business users use reports to make data-driven decisions. That’s why reports are called effective if they enable users to drill down and filter data quickly and intuitively to find answers to any question they might have, and analyse data in all possible directions and dimensions.
Each report is evaluated based on three main criteria: intuitiveness, insightfulness, and interactivity. These factors ensure that the reports are not only accurate and functional, but also meet the target audience's needs and are ready to be presented to the end-users.
- Intuitive: How clear and easy it is to understand the report at a glance? (max 15 points)
- Is the report visually appealing?
- Choice of charts and visual elements
- Does the report tell a story?
- Is it not overwhelming to the user?
- Choice of tooltips, titles, and legends
- Interactive: How engaging and seamless is the report exploration and interaction with data? (max 15 points)
- Clear navigation that allows user to explore the report
- Use of slicers and other interactive elements
- Smooth cross-chart integration
- Is report optimized for touch devices?
- Are tutorials and guiding elements helpful to the user?
- Insightful: How accurate, complete, and meaningful is the data in driving decisions? (max 15 points)
- Depth of analysis
- Data cleaning and preparation
- Does data show up accurately in the report?
- Is report optimized for quicker loading time?
- Does the report provide deeper exploration of data (drill-down)?