709
Real Estate Investment Insights Dashboard 2
Real Estate Investment Insights Dashboard 2
Report Author: Lakshi Weerakkodige
709
Share template with others
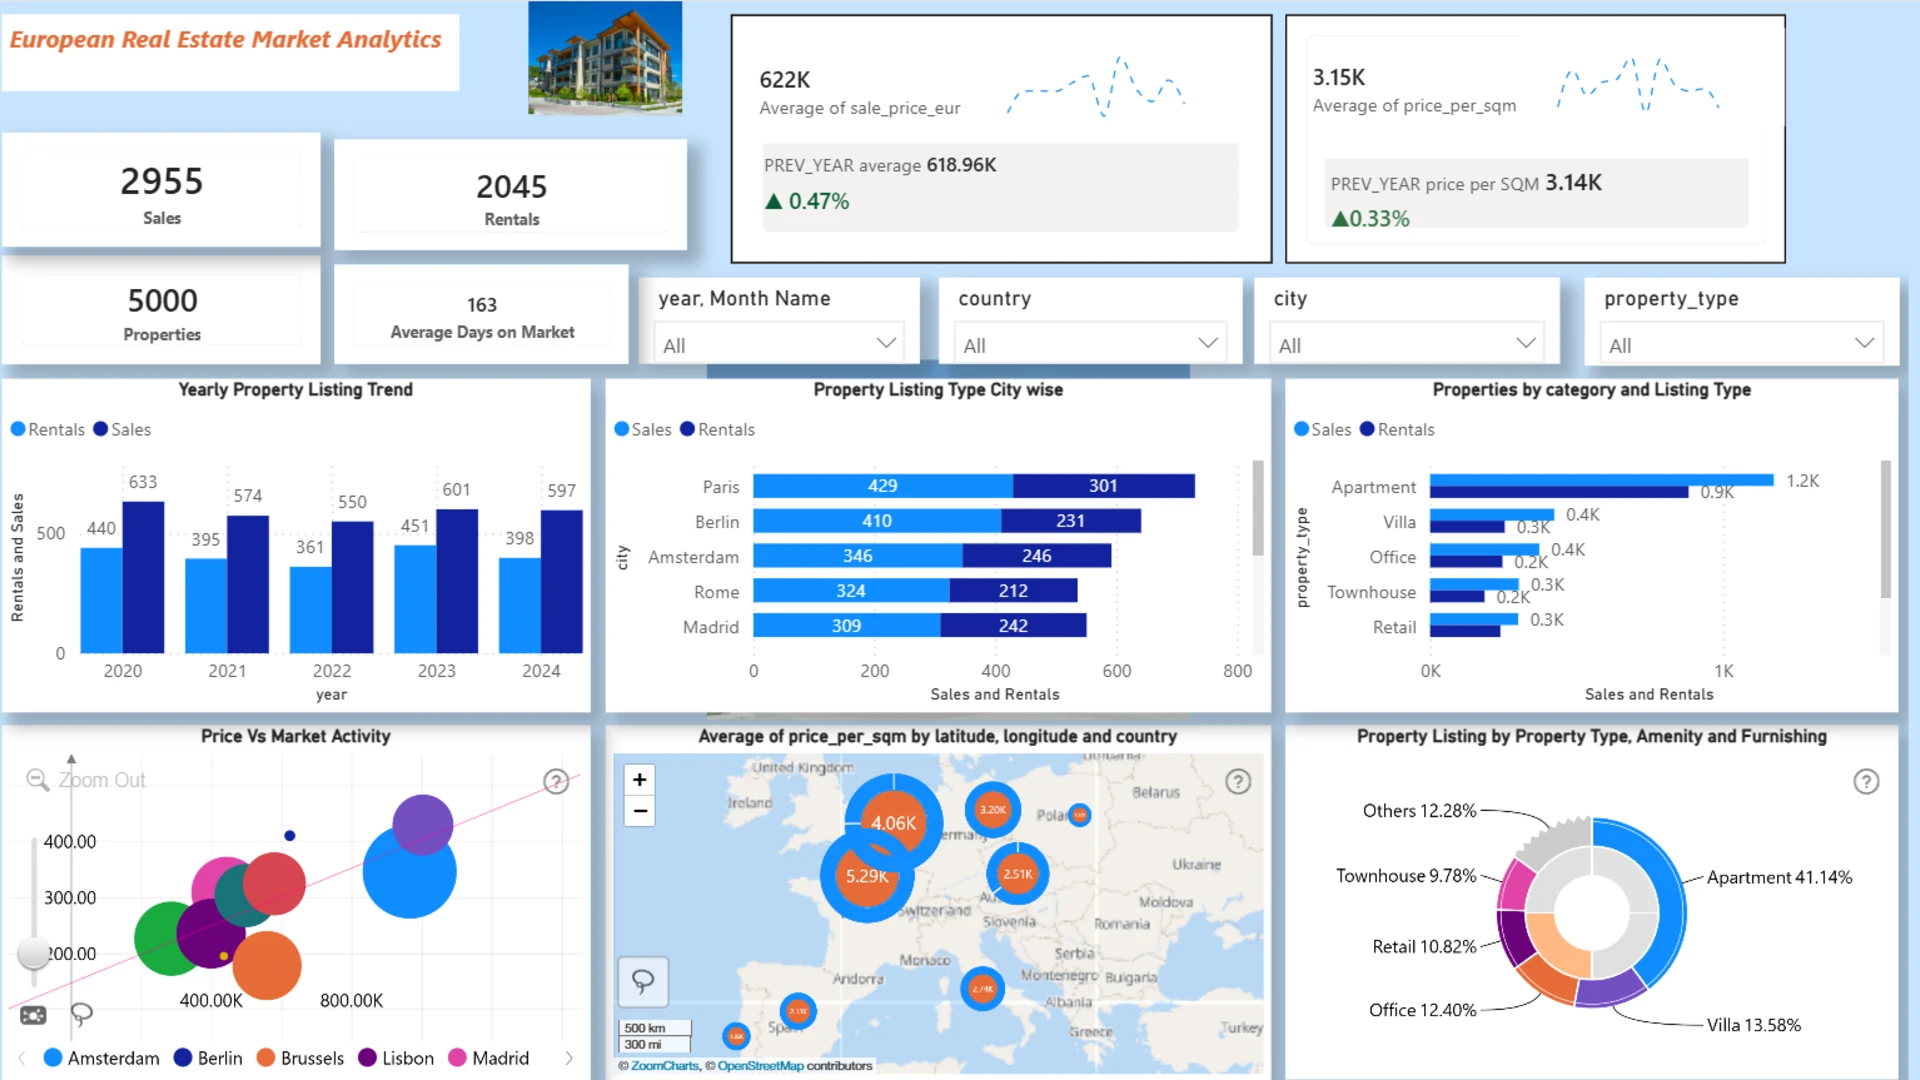
This interactive Power BI report explores the European Real Estate Market Analytics dataset using ZoomCharts Drill Down custom visuals for Power BI. It highlights property prices, price per square meter, listing activity, and property characteristics across countries and cities, helping users identify market trends, compare locations, and evaluate investment opportunities.
The report was submitted to the FP20 Analytics ZoomCharts Data Challenge #36 (March – April 2026).
Author’s Description:
Developed a Power BI report analyzing 5,000 European property listings, comparing prices, amenities, market activity, and investment potential across cities. The report helps users explore value by location, price variations by property type, key pricing drivers, and market liquidity.
The analysis reveals clear regional patterns, with France and the Netherlands showing the highest property values, while Belgium stands out for strong capital growth. Amenities such as gyms, pools, parking, and elevators consistently contribute to higher prices.
All visuals were built using ZoomCharts Drill Down PRO, including Map PRO, Combo PRO, and Scatter PRO.
ZoomCharts visuals used
4U Report Challenges
Participate in data challenges, build and submit reports to get free template downloads.
Join CommunityMobile view allows you to interact with the report. To Download the template please switch to desktop view.


Was this helpful? Thank you for your feedback!
Sorry about that.
How can we improve it?