1705
Real Estate Analytics Power BI Dashboard for Property Listings
Real Estate Analytics Power BI Dashboard for Property Listings
More Report pages
Report Author: Crystal Andrea Dsouza
1705
Share template with others
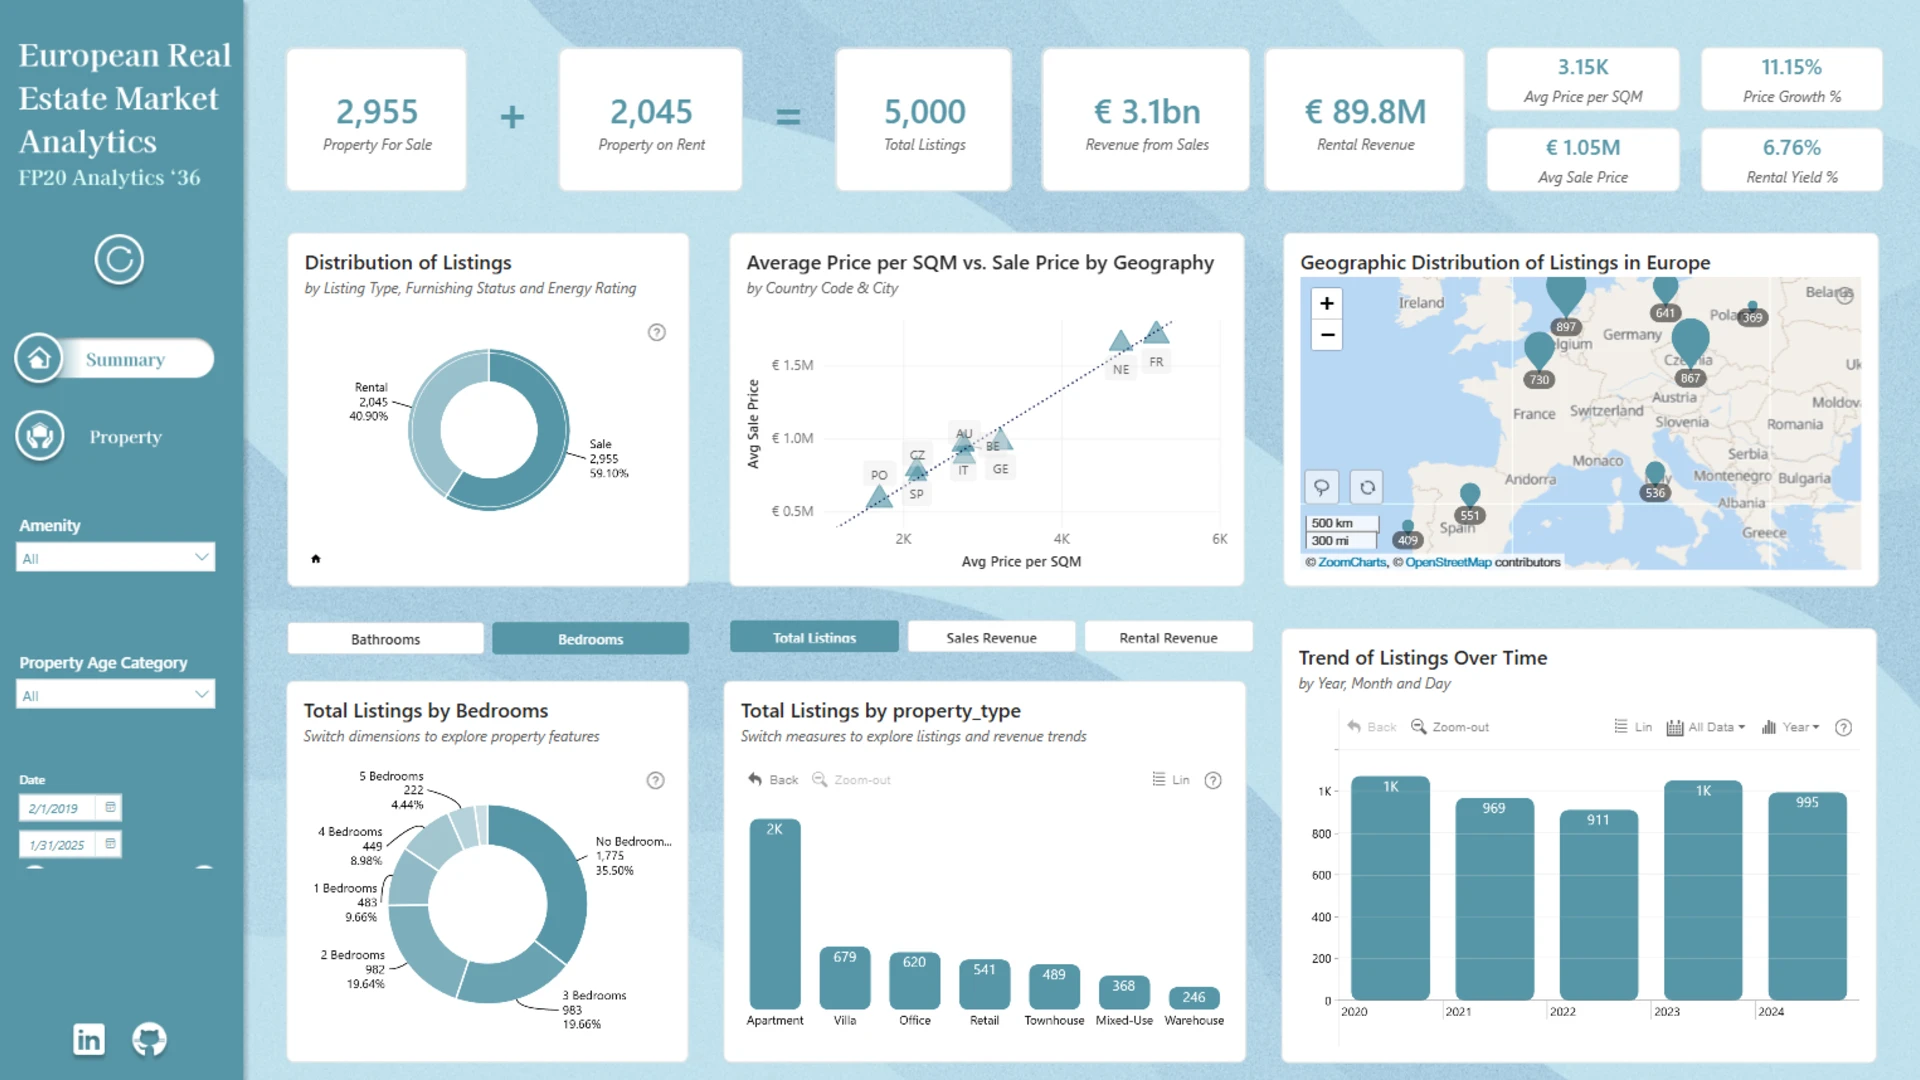
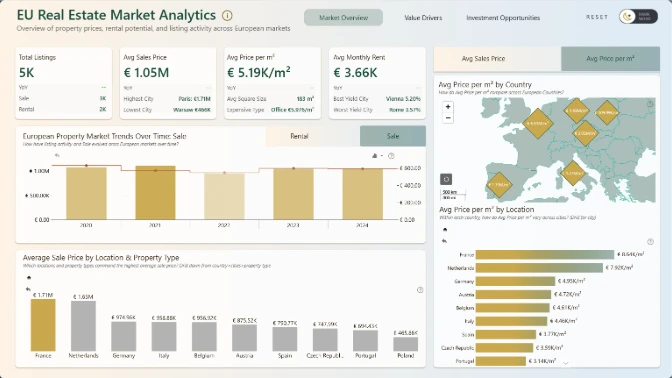
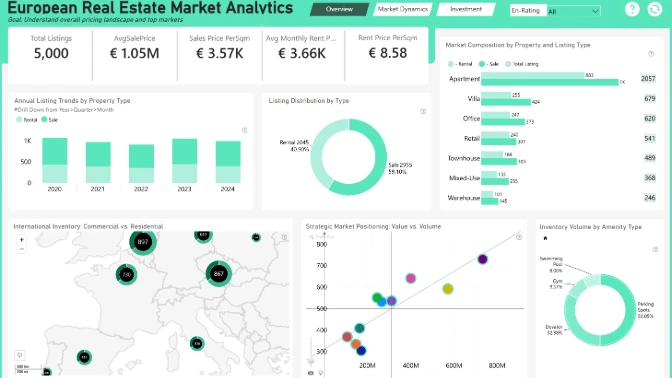
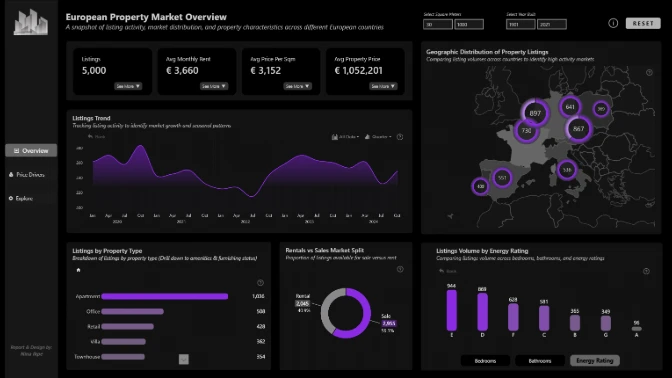
This interactive Power BI report explores the European Real Estate Market Analytics dataset using ZoomCharts Drill Down custom visuals for Power BI. It highlights property prices, price per square meter, listing activity, and property characteristics across countries and cities, helping users identify market trends, compare locations, and evaluate investment opportunities.
The report was submitted to the FP20 Analytics ZoomCharts Data Challenge #36 (March – April 2026).
Use this Power BI real estate dashboard to:
- Track total listings, properties for sale, and rental listings
- Monitor sales revenue, rental revenue, and pricing performance
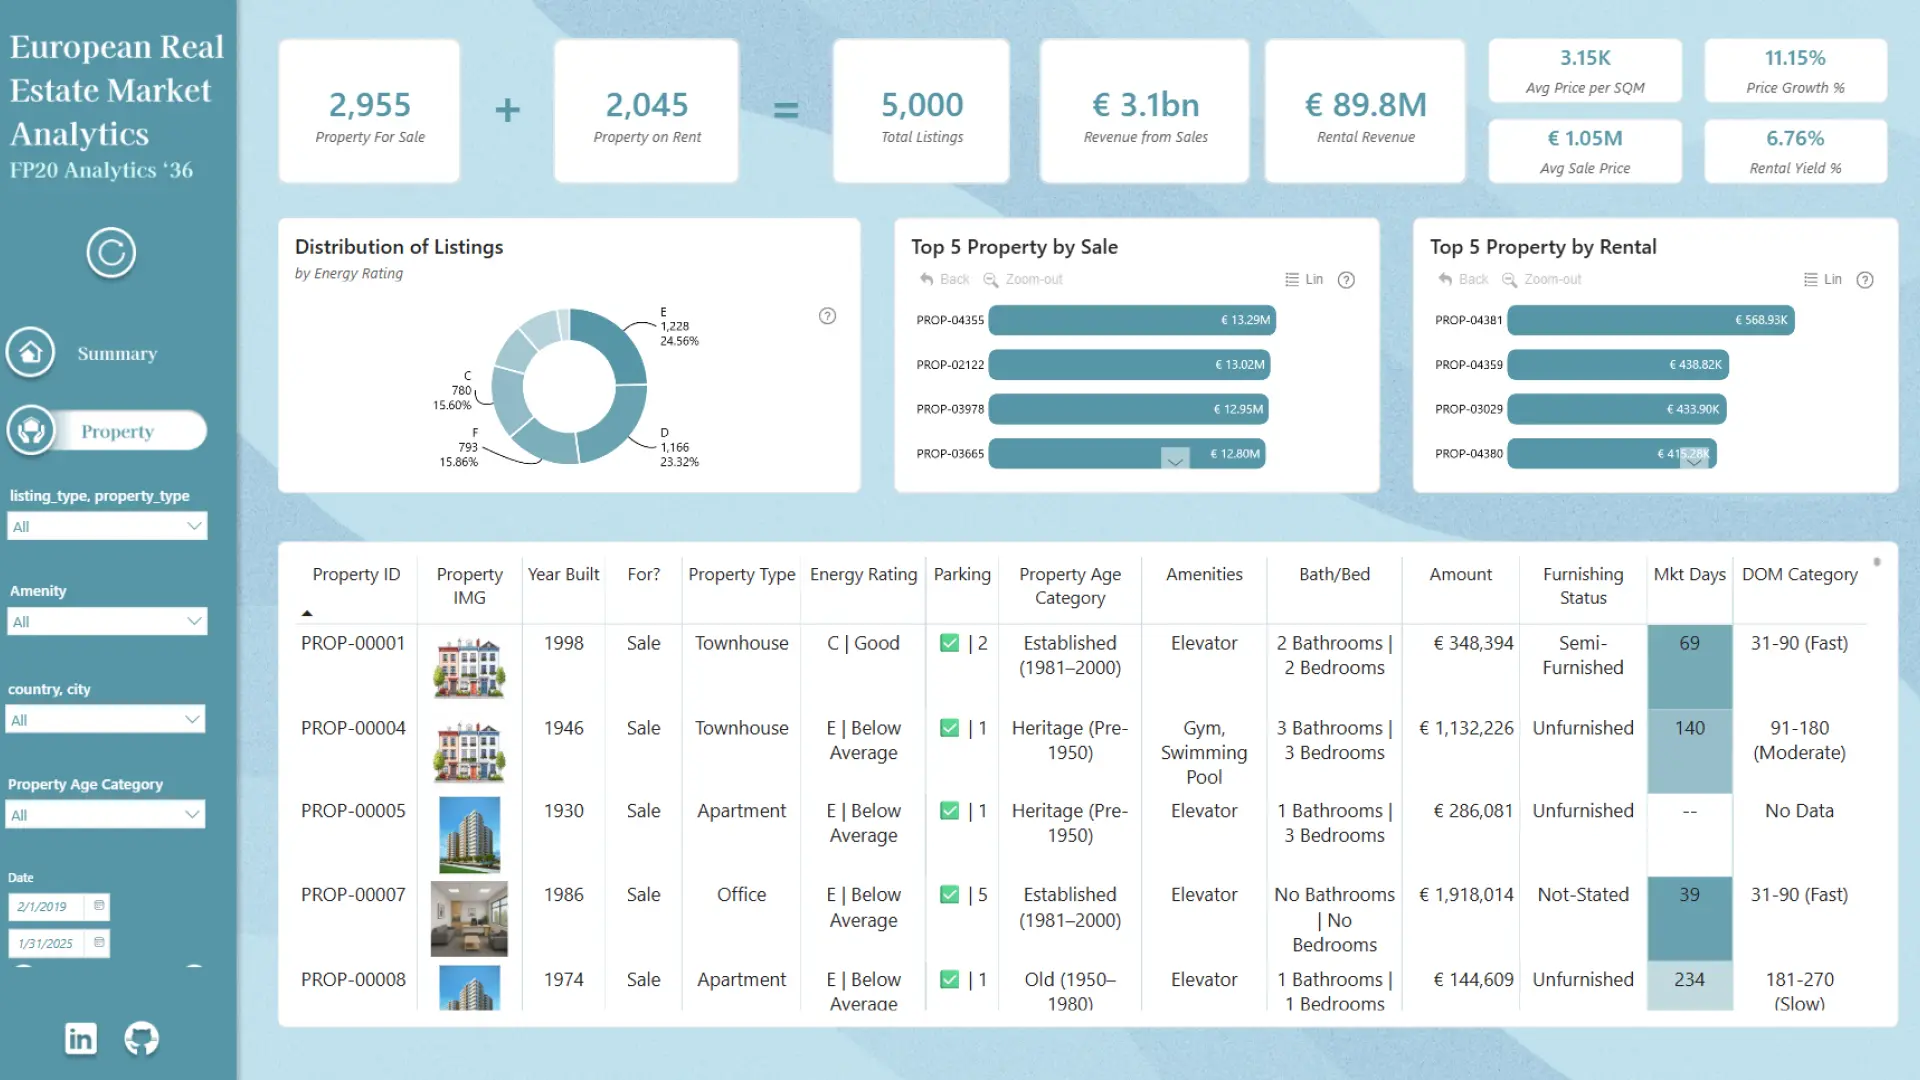
- Identify top-performing properties by sales and rental income
- Analyze property distribution by type, energy rating, and amenities
- Compare listings across countries, cities, and regions
- Explore detailed property-level data including price, size, features, and days on market
- Understand how property age, furnishing status, and amenities impact value
- Identify market trends and high-value investment opportunities
Key pages and insights included:
- Portfolio Overview with KPI cards for listings, revenue, average prices, and price per square meter
- Distribution of listings by energy rating and property characteristics
- Top properties by sales and rental revenue for performance benchmarking
- Geographic distribution map for analyzing listings across markets
- Listings trend analysis over time to track market activity and growth
- Detailed property explorer table with listing ID, pricing, features, and market duration
Real estate KPIs included:
- Total listings
- Properties for sale and for rent
- Sales revenue and rental revenue
- Average sale price
- Average rental price
- Price per square meter
- Price growth % and rental yield %
- Listings by property type
- Listings by energy rating
- Days on market (DOM)
- Property age category
- Property features (bedrooms, bathrooms, amenities, parking)
Interactive Power BI features:
- Drill-down from portfolio KPIs to individual property-level details
- Cross-filtering across location, property type, amenities, and listing type
- Interactive map for analyzing geographic distribution of listings
- Dynamic filtering by date, property age, amenities, and location
- Ability to switch between sales and rental performance views
Who this report is for:
- Real estate agencies and brokerages
- Property listing and proptech platforms
- Real estate investors and portfolio managers
- Housing market analysts and researchers
- Sales and rental performance teams
- Power BI developers building real estate dashboards
This Power BI real estate dashboard template is fully customizable in Power BI Desktop and can be adapted to property marketplace data, brokerage systems, and rental platforms.
By using this report, you can build advanced real estate dashboards faster and easier, saving development time while delivering a highly interactive, professional analytics experience with minimal effort.
ZoomCharts visuals used





4U Report Challenges
Participate in data challenges, build and submit reports to get free template downloads.
Join CommunityMobile view allows you to interact with the report. To Download the template please switch to desktop view.
How to use a PBIX template
Preview the interactive report, download the PBIX file, open it in Power BI Desktop, and replace the same data connection with your own dataset.
Preview and download
Explore the report online and download the PBIX template file.
Open in Power BI Desktop
Open the downloaded PBIX file in Power BI Desktop.
Connect your data
Replace the sample data source with your own dataset.
Refresh and adjust
Refresh the model and update fields or visual were needed.
Save and share
Save your report and publish it for your audience.


