This interactive Power BI report explores the European Real Estate Market Analytics dataset using ZoomCharts Drill Down custom visuals for Power BI. It highlights property prices, price per square meter, listing activity, and property characteristics across countries and cities, helping users identify market trends, compare locations, and evaluate investment opportunities.
The report was submitted to the FP20 Analytics ZoomCharts Data Challenge #36 (March – April 2026).
Author’s Description:
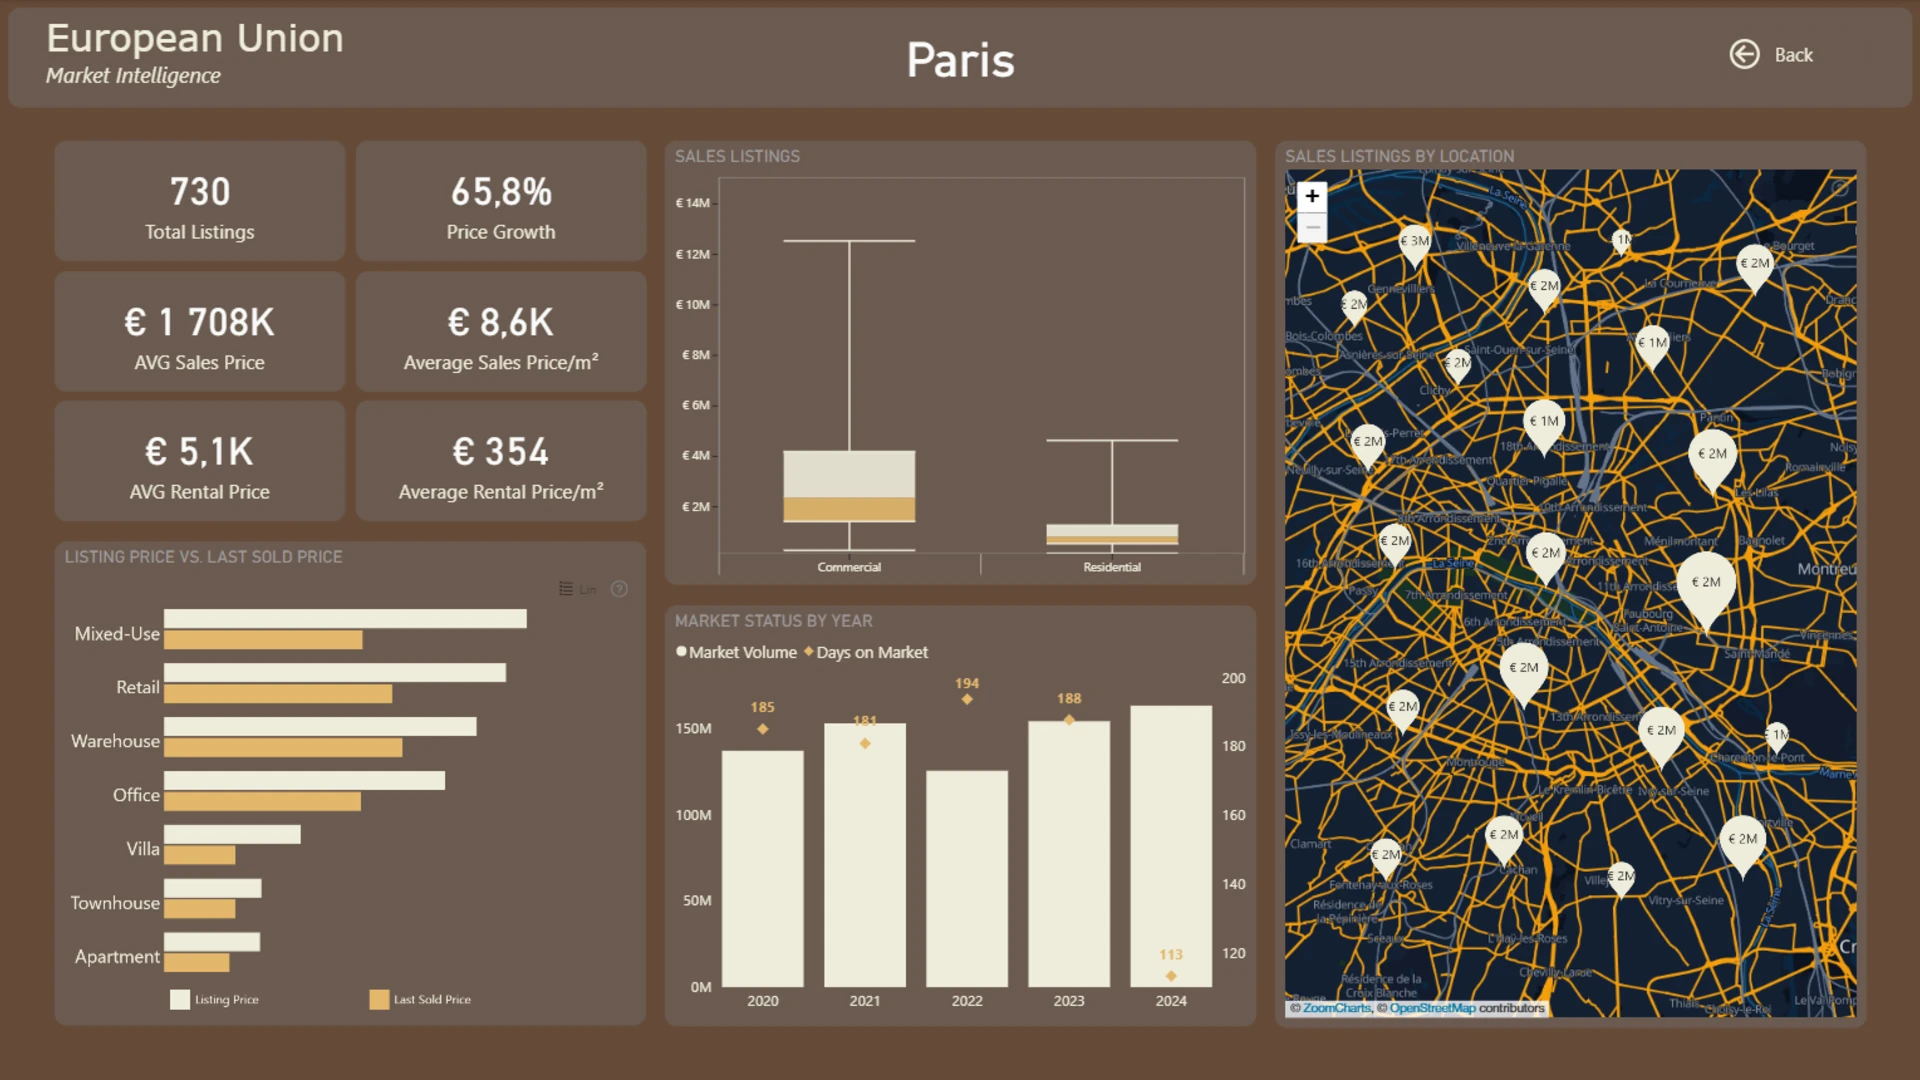
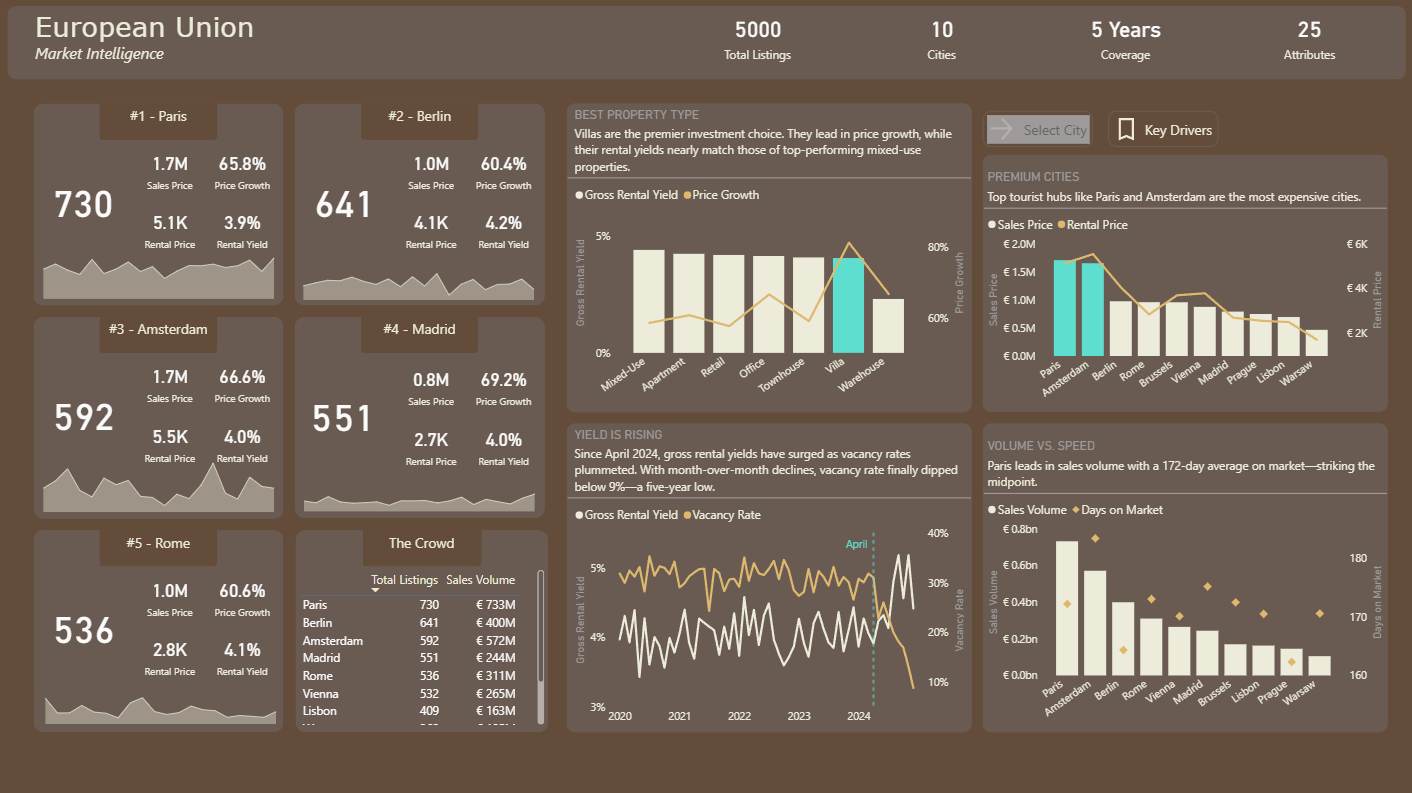
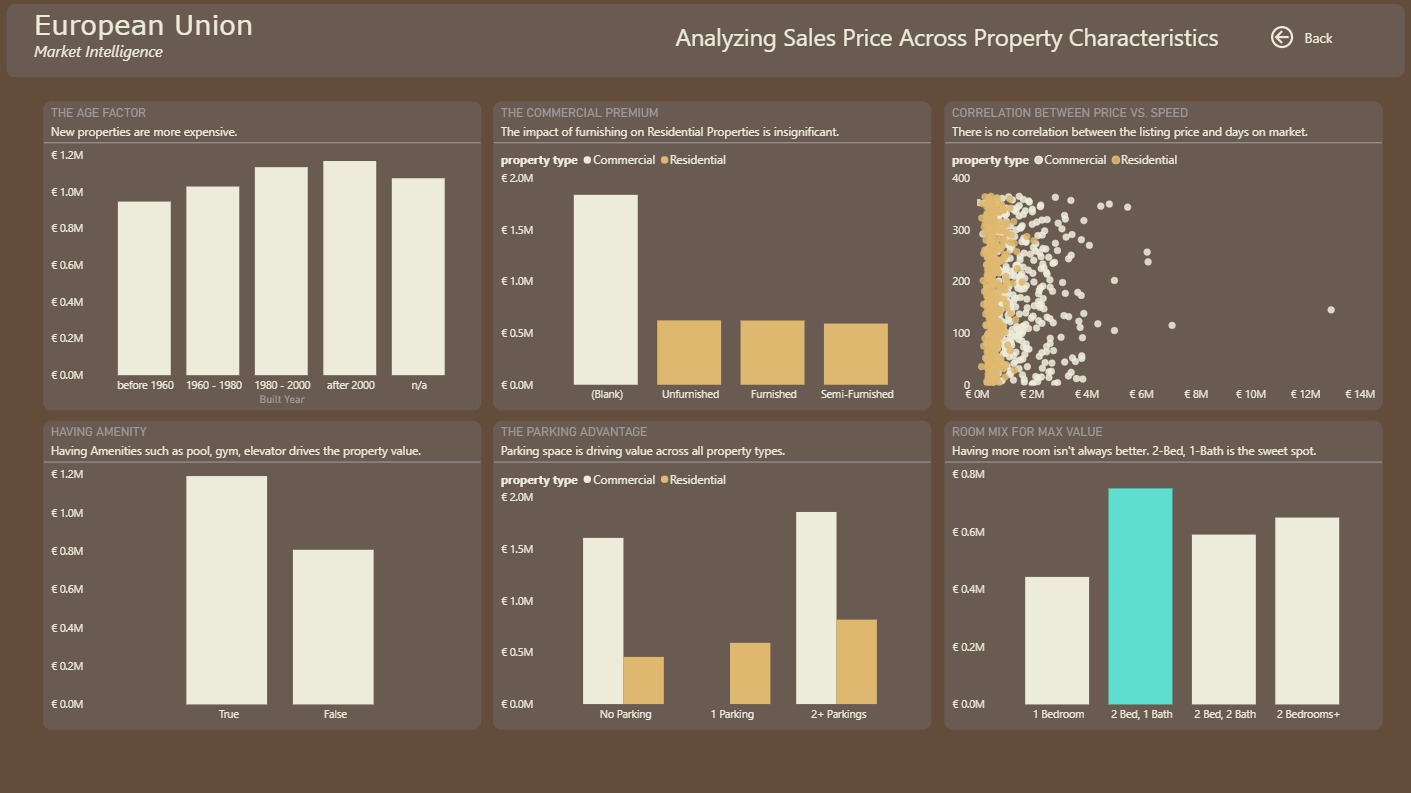
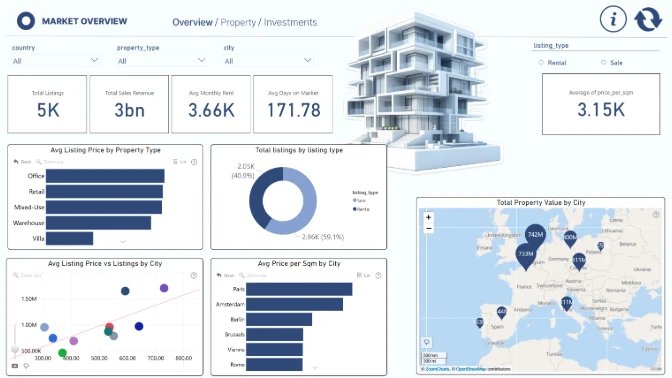
The dashboard provides a comprehensive market analysis, visualizing total listings, rental yields, and market volume, with a deeper dive into city-level pricing and premium areas. It also examines key value drivers, showing how factors such as building age, furnishing status, and amenities impact property prices.
Key insights reveal that Paris leads in listings and sales volume, while rental yields remain relatively stable across most property types. The analysis also highlights strong demand for 2-bedroom, 1-bathroom properties and confirms that modern buildings with premium amenities command higher values.