574
Property Market Trends & Valuation Analysis 5
Property Market Trends & Valuation Analysis 5
Report Author: Emilia Lapczynska
574
Share template with others
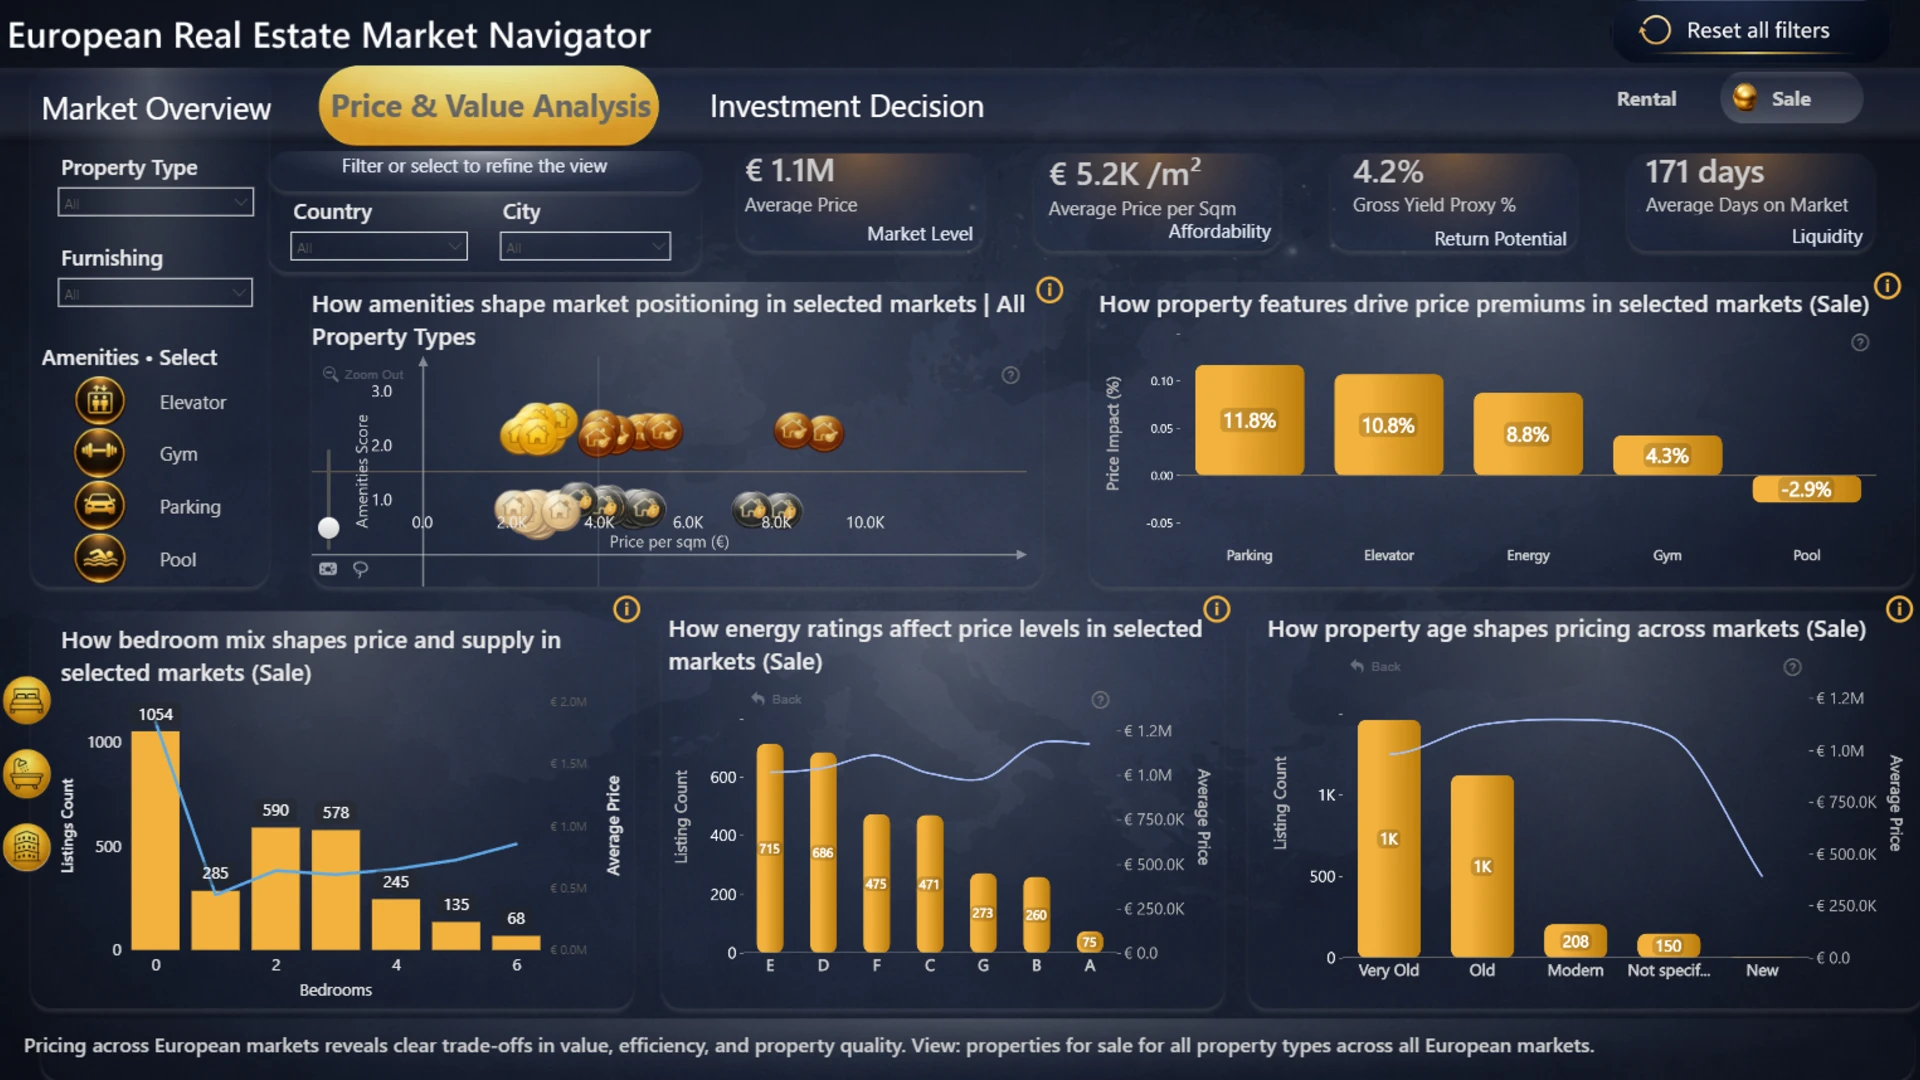
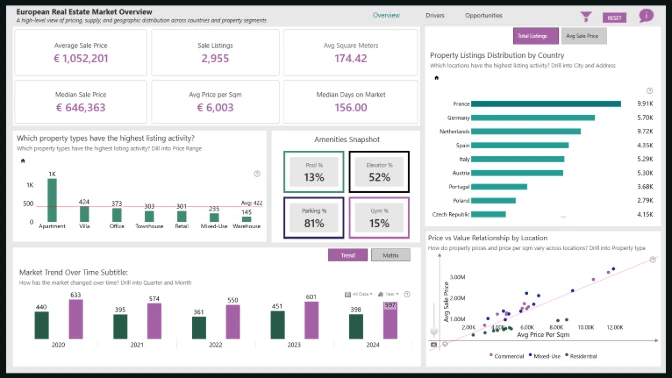
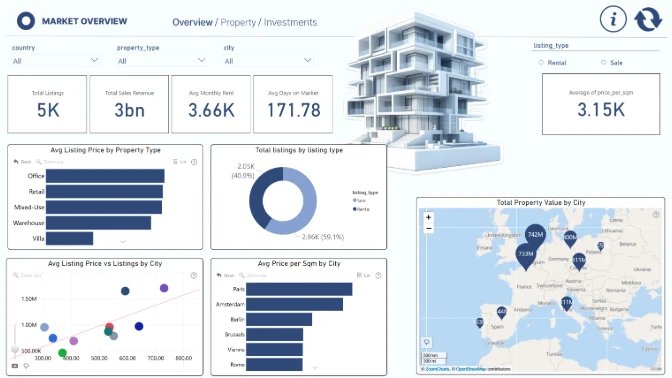
This interactive Power BI report explores the European Real Estate Market Analytics dataset using ZoomCharts Drill Down custom visuals for Power BI. It highlights property prices, price per square meter, listing activity, and property characteristics across countries and cities, helping users identify market trends, compare locations, and evaluate investment opportunities.
The report was submitted to the FP20 Analytics ZoomCharts Data Challenge #36 (March – April 2026).
Author’s Description:
This report is designed as a decision-support tool for real estate investment analysis across European cities. It combines pricing, market liquidity, and return drivers into a single Investment Score (0–100), helping users quickly identify the most attractive locations based on their strategy (sale vs. rental). The report focuses on translating data into actionable insights, guiding users through analysis using UX and storytelling, and reducing on-screen complexity while providing deeper insights via tooltips. Users can explore the market from multiple perspectives—from high-level city rankings to property-type analysis-to understand not only where to invest, but also why.
ZoomCharts visuals used
4U Report Challenges
Participate in data challenges, build and submit reports to get free template downloads.
Join CommunityMobile view allows you to interact with the report. To Download the template please switch to desktop view.

Was this helpful? Thank you for your feedback!
Sorry about that.
How can we improve it?