2259
Real Estate Intelligence Power BI Dashboard
Real Estate Intelligence Power BI Dashboard
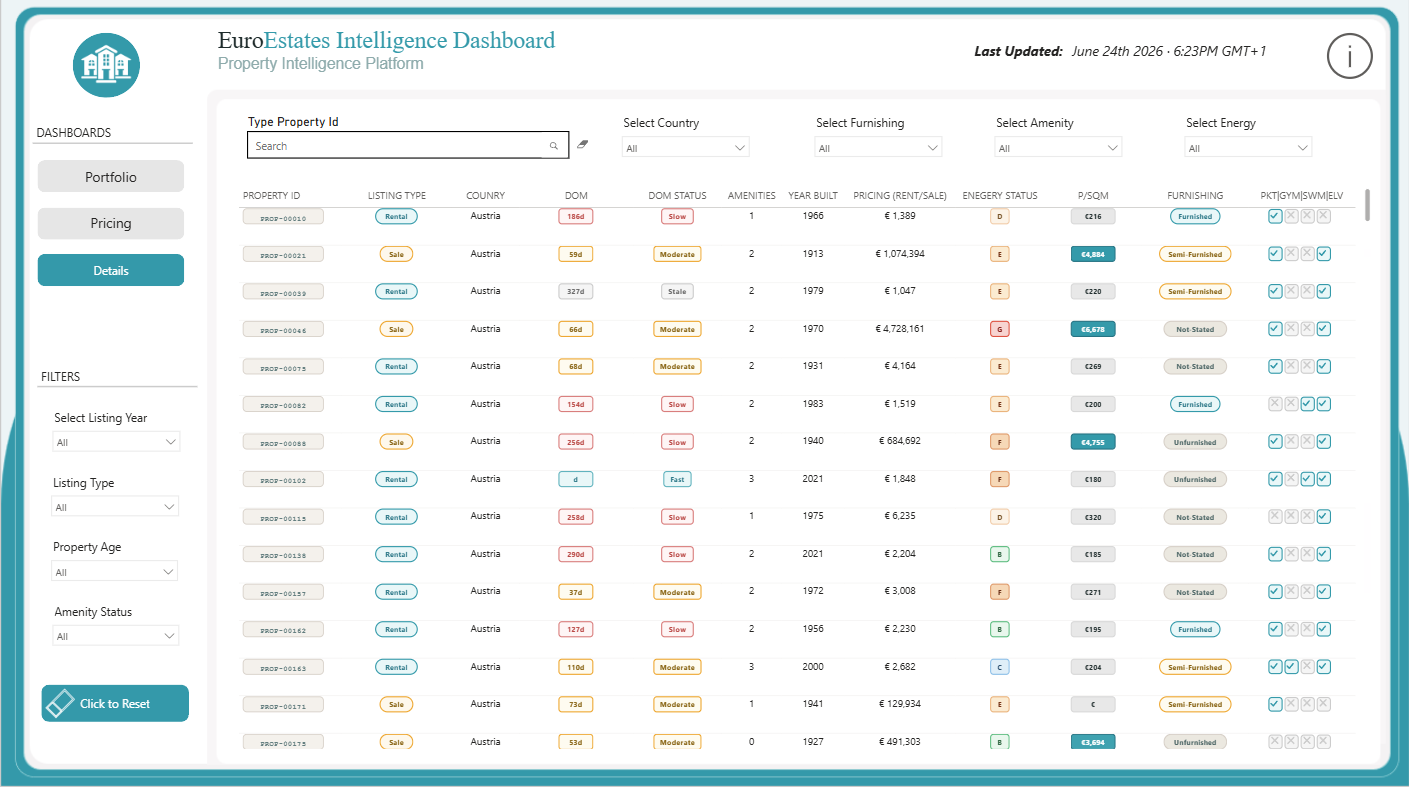
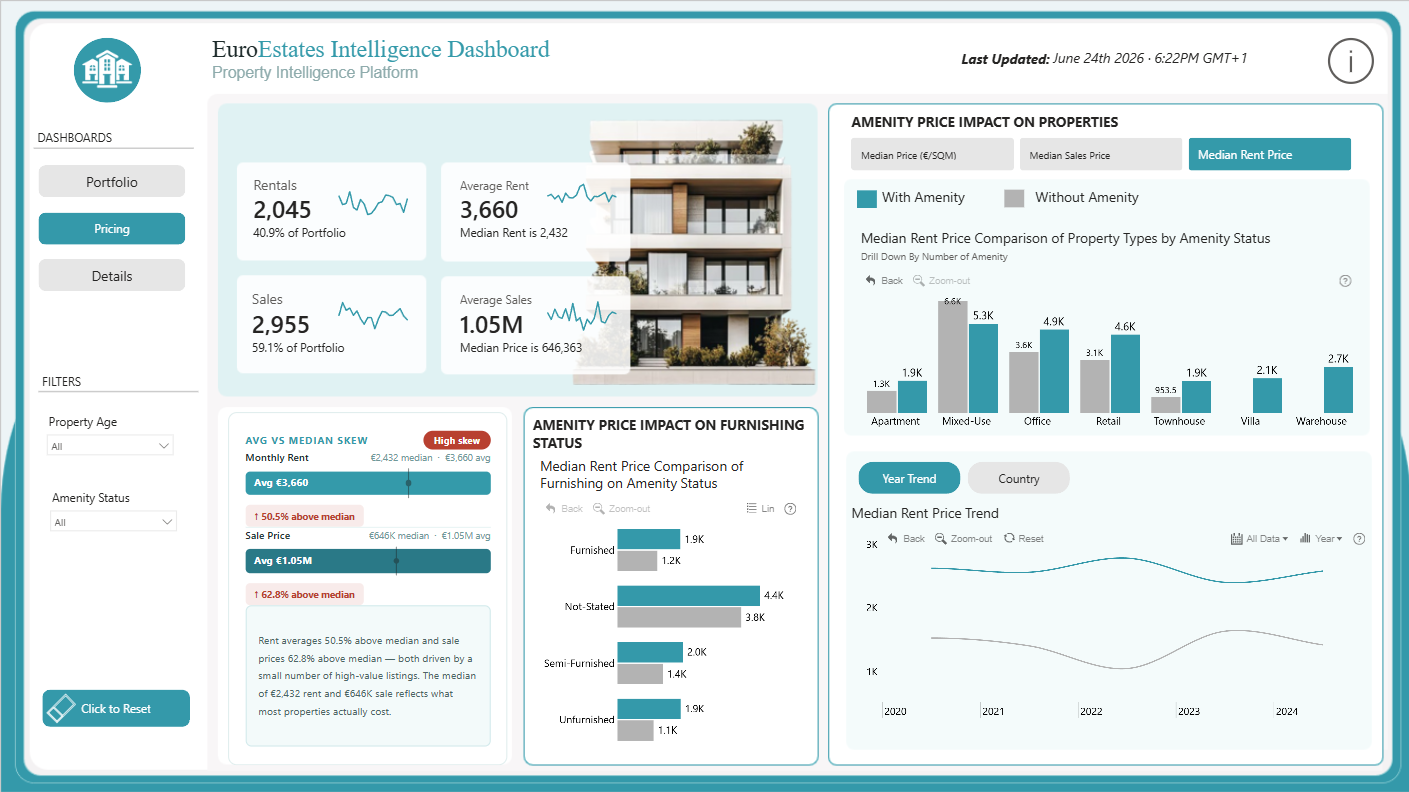
More Report pages
Report Author: Okeh Dono Efasa
2259
Share template with others
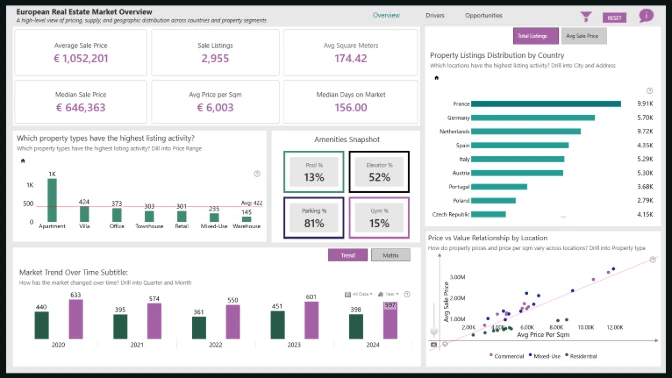
This interactive Power BI report explores the European Real Estate Market Analytics dataset using ZoomCharts Drill Down custom visuals for Power BI. It highlights property prices, price per square meter, listing activity, and property characteristics across countries and cities, helping users identify market trends, compare locations, and evaluate investment opportunities. The report was submitted to the FP20 Analytics ZoomCharts Data Challenge #36 (March – April 2026).
Additional Description
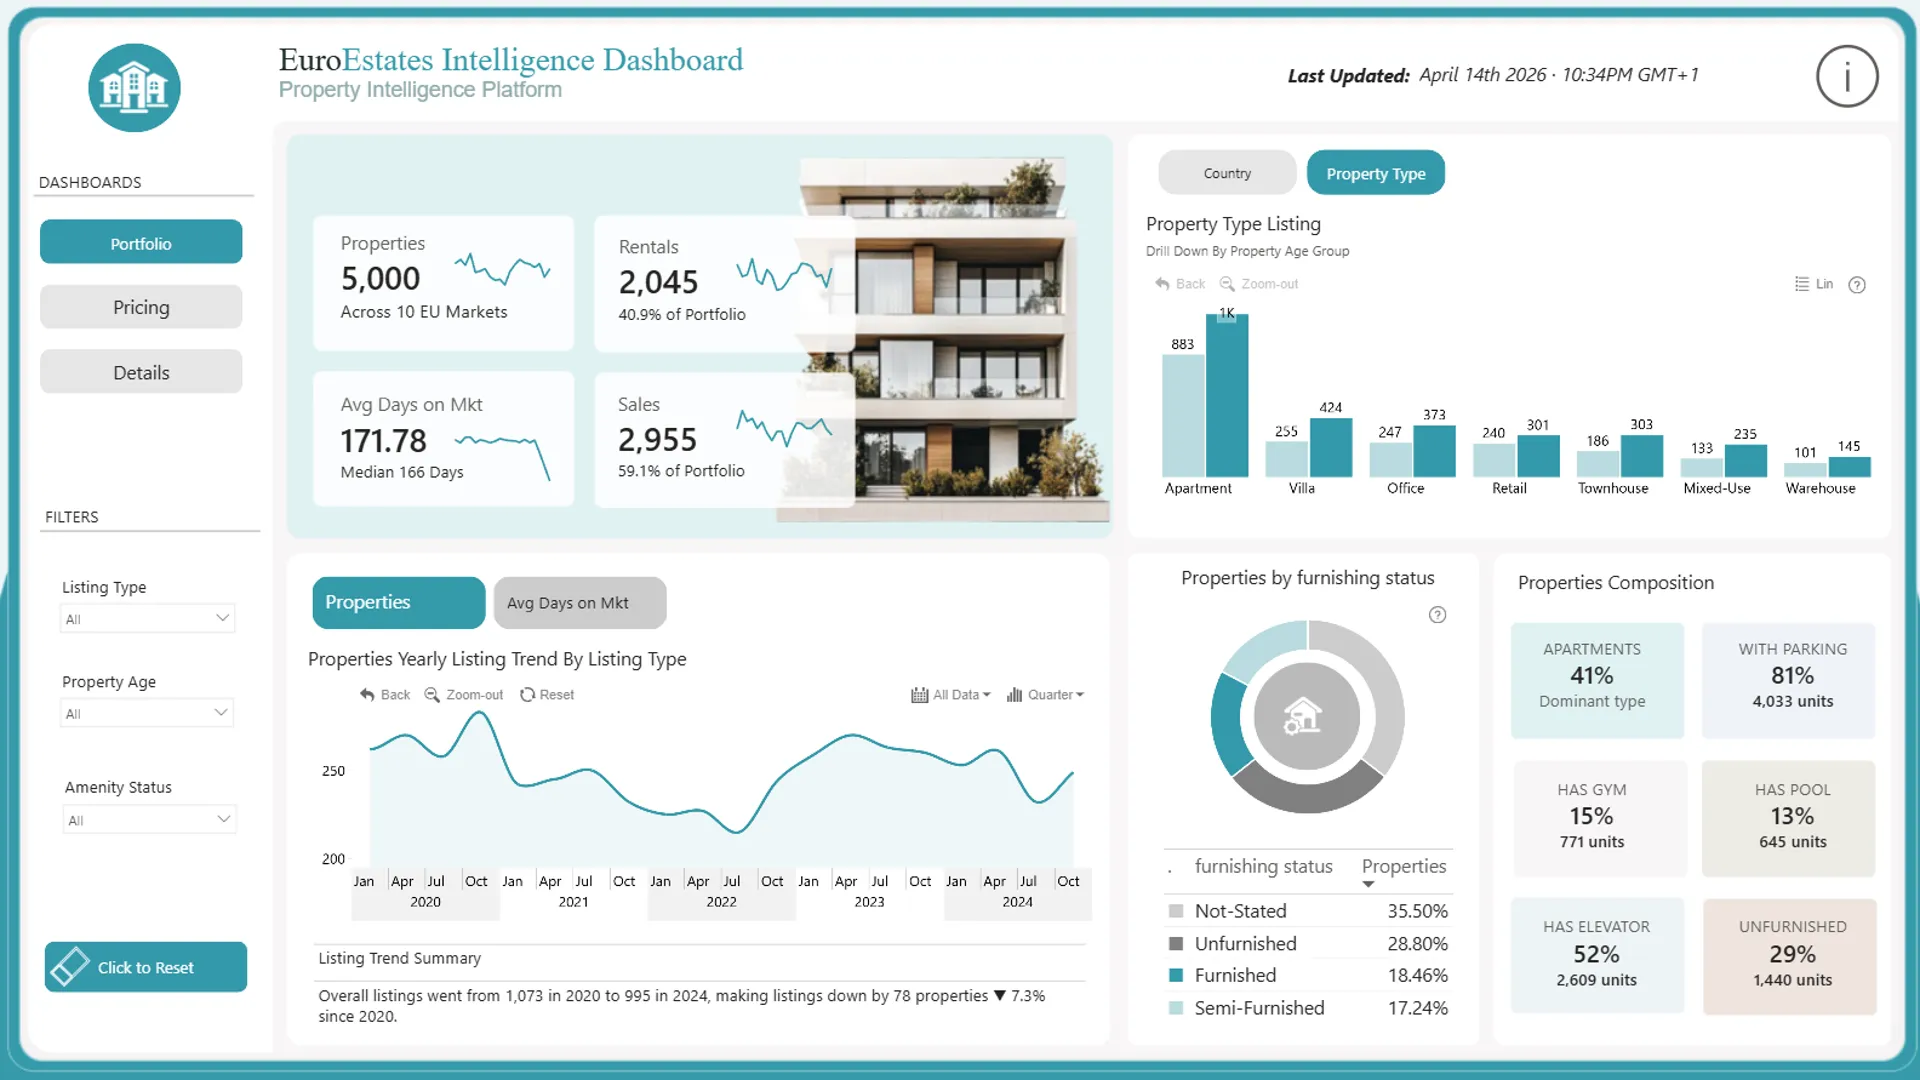
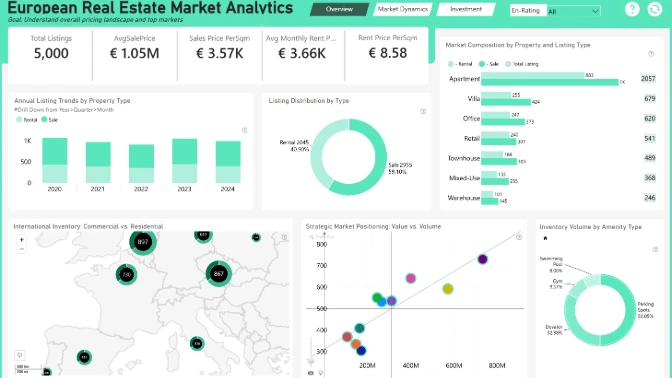
The EuroEstates Intelligence Dashboard is a comprehensive Power BI report designed to provide deep insights into real estate portfolio performance across 10 European markets. It enables users to explore key metrics such as total properties, rental distribution, sales performance, and average days on market, all within a clean and intuitive interface.
Built with a focus on interactive data visualization, the dashboard allows users to drill down into property types, analyze listing trends over time, and understand how different segments of the portfolio perform. Filters for listing type, property age, and amenity status make it easy to customize the analysis and uncover actionable insights.
Key highlights include:
- Portfolio overview KPIs for properties, rentals, sales, and market activity
- Property type analysis with drill-down capabilities for deeper segmentation
- Trend analysis of listings over time to identify market dynamics
- Furnishing status breakdown to understand property readiness and demand
- Portfolio composition insights including amenities like parking, gym, and pool
This report demonstrates best practices in Power BI dashboard design, combining clarity, usability, and advanced interactivity. Enhanced with ZoomCharts-style visuals, it delivers a smooth and engaging analytical experience, helping users quickly move from high-level insights to detailed exploration.
ZoomCharts visuals used




4U Report Challenges
Participate in data challenges, build and submit reports to get free template downloads.
Join CommunityMobile view allows you to interact with the report. To Download the template please switch to desktop view.
How to use a PBIX template
Preview the interactive report, download the PBIX file, open it in Power BI Desktop, and replace the same data connection with your own dataset.
Preview and download
Explore the report online and download the PBIX template file.
Open in Power BI Desktop
Open the downloaded PBIX file in Power BI Desktop.
Connect your data
Replace the sample data source with your own dataset.
Refresh and adjust
Refresh the model and update fields or visual were needed.
Save and share
Save your report and publish it for your audience.


