544
Property Market Trends & Valuation Analysis 4
Property Market Trends & Valuation Analysis 4
More Report pages
Report Author: Waleed Javed
544
Share template with others
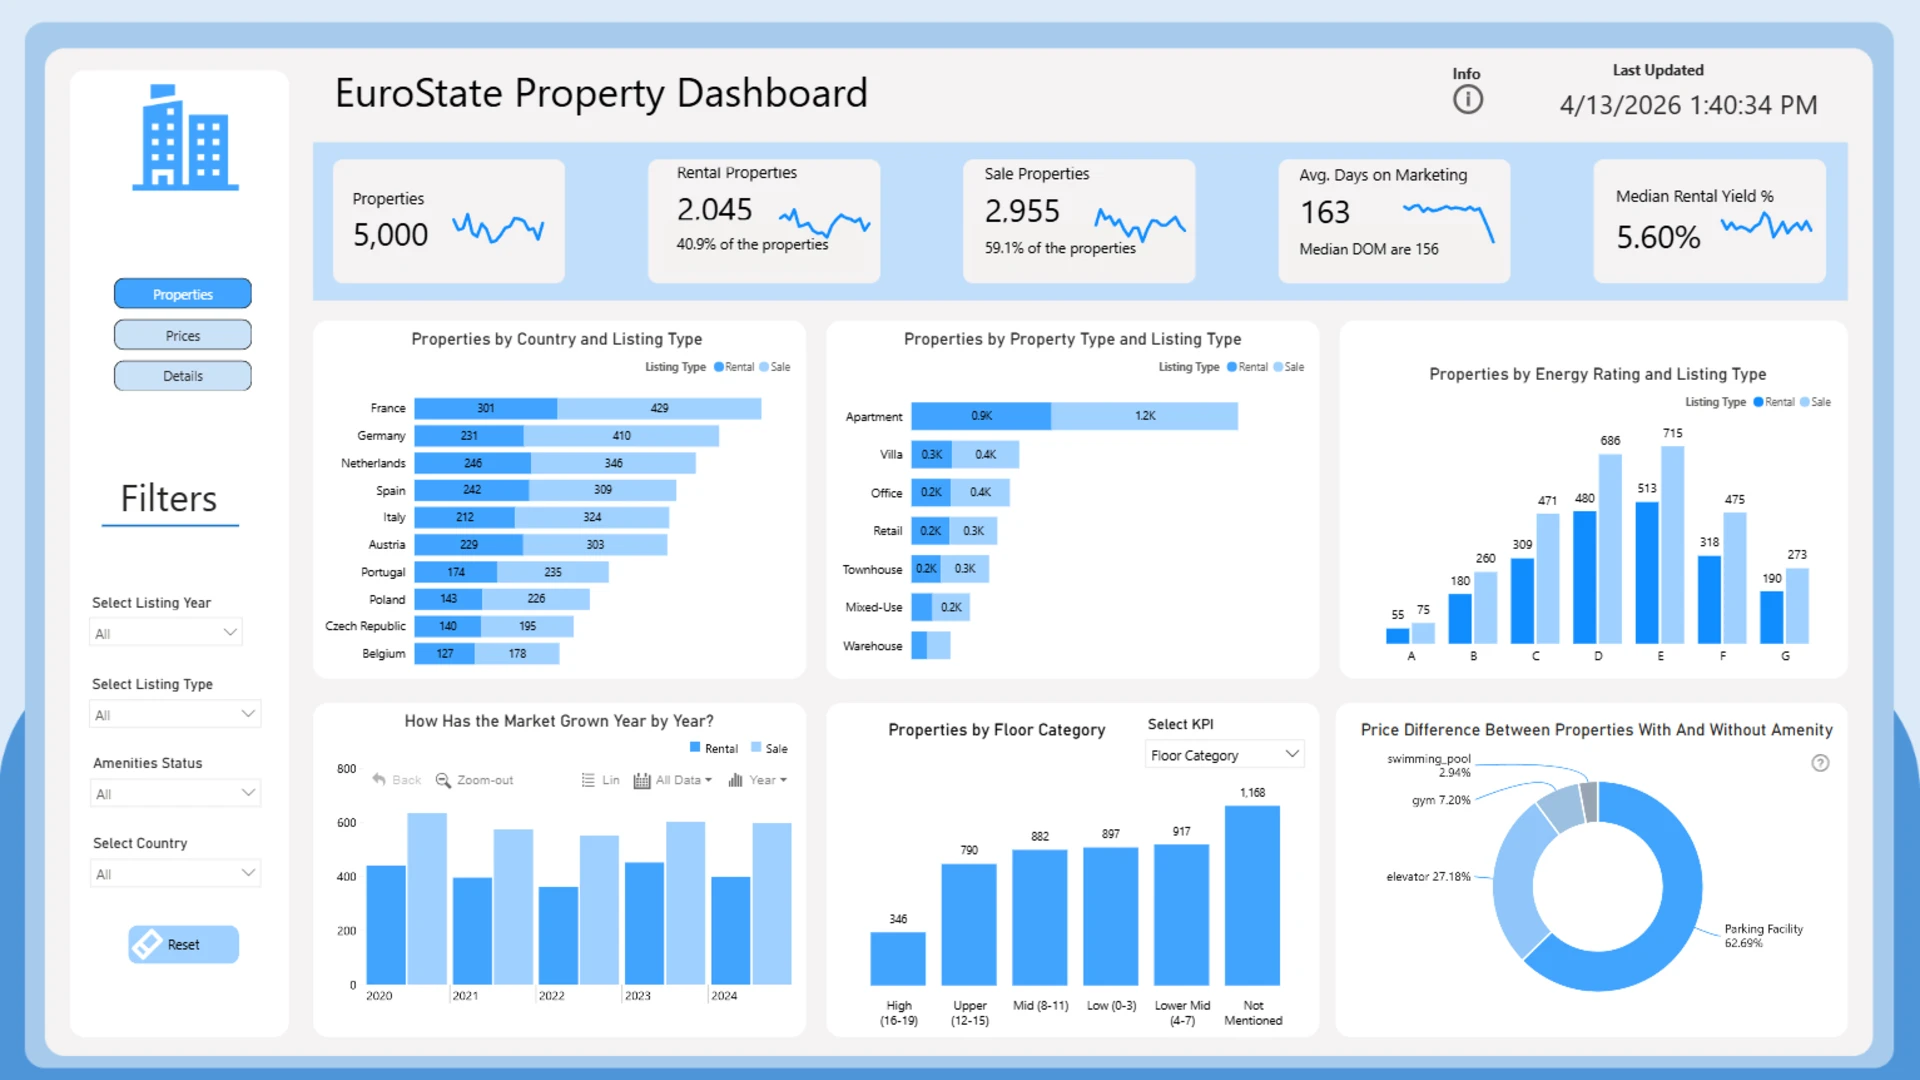
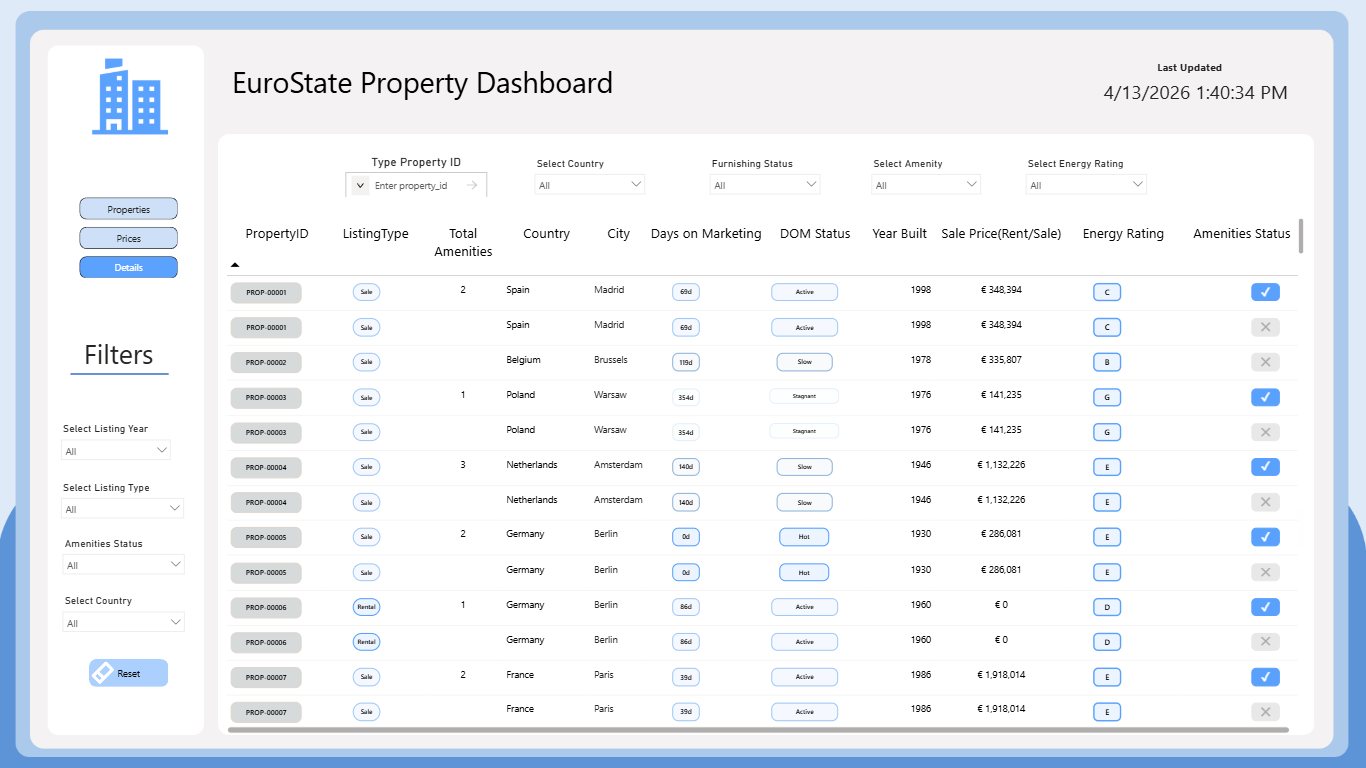
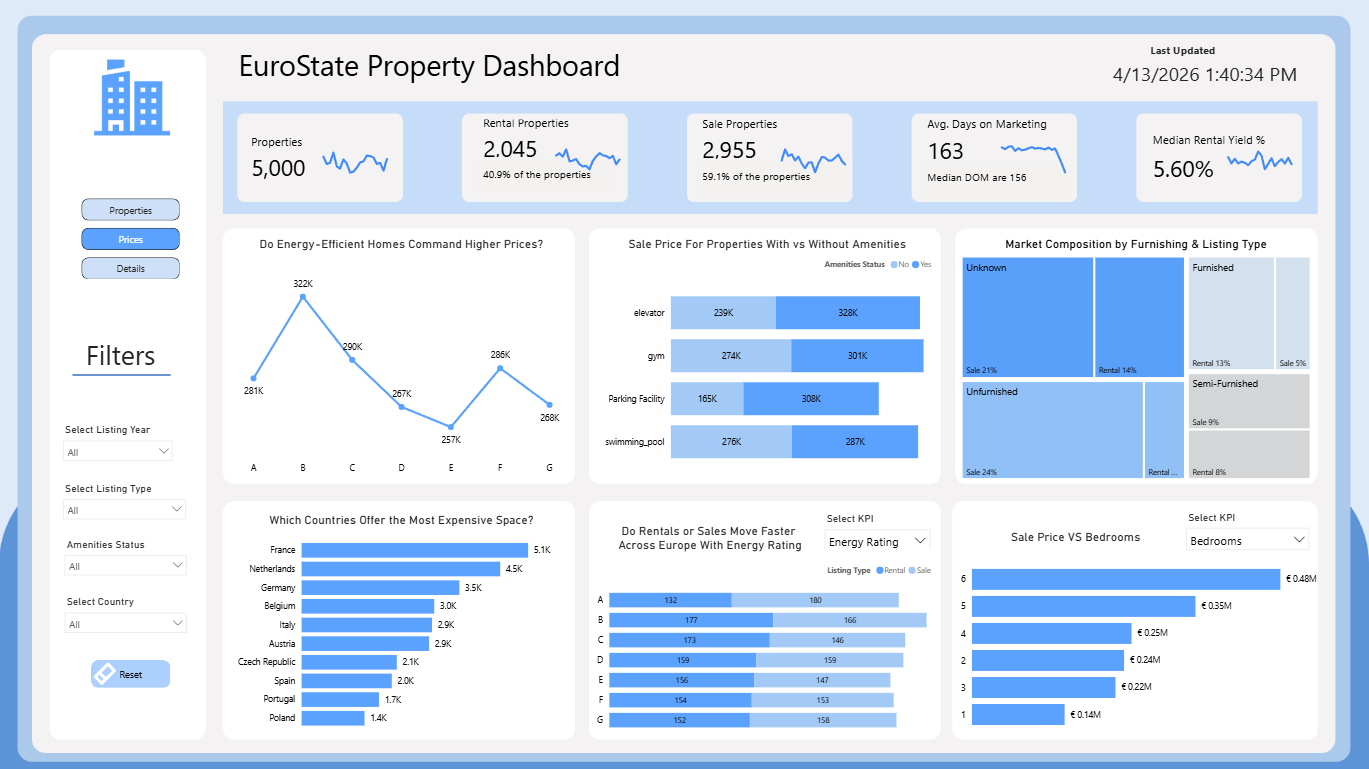
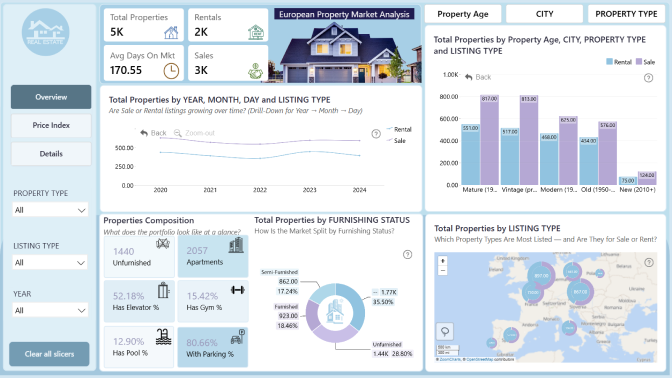
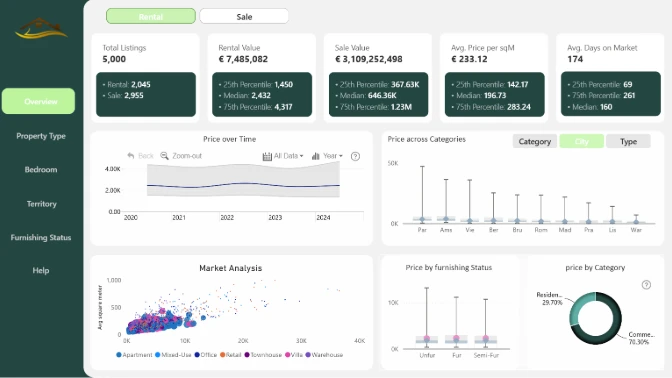
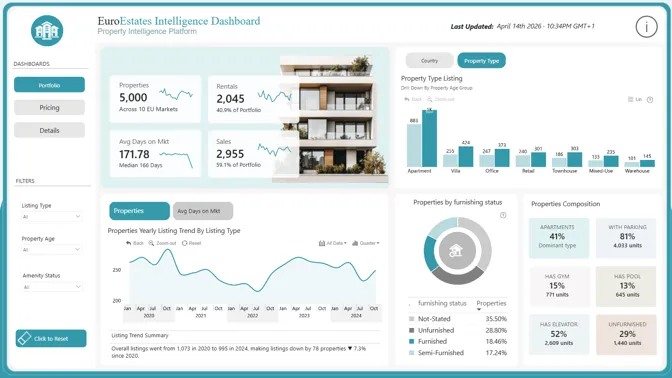
This interactive Power BI report explores the European Real Estate Market Analytics dataset using ZoomCharts Drill Down custom visuals for Power BI. It highlights property prices, price per square meter, listing activity, and property characteristics across countries and cities, helping users identify market trends, compare locations, and evaluate investment opportunities.
The report was submitted to the FP20 Analytics ZoomCharts Data Challenge #36 (March – April 2026).
Author’s Description:
Eurostate Property Dashboard gives you a clear, data-driven view of the real estate market. Monitor sale prices, rental rates, and market pace, filtered by location, property type, and size. Built on median-based metrics, every insight reflects what buyers and sellers actually experience-not what outliers distort.
If you want, I can also make it sound more marketing-heavy, simpler, or more technical.
4U Report Challenges
Participate in data challenges, build and submit reports to get free template downloads.
Join CommunityMobile view allows you to interact with the report. To Download the template please switch to desktop view.
Was this helpful? Thank you for your feedback!
Sorry about that.
How can we improve it?