Sep 26, 2024
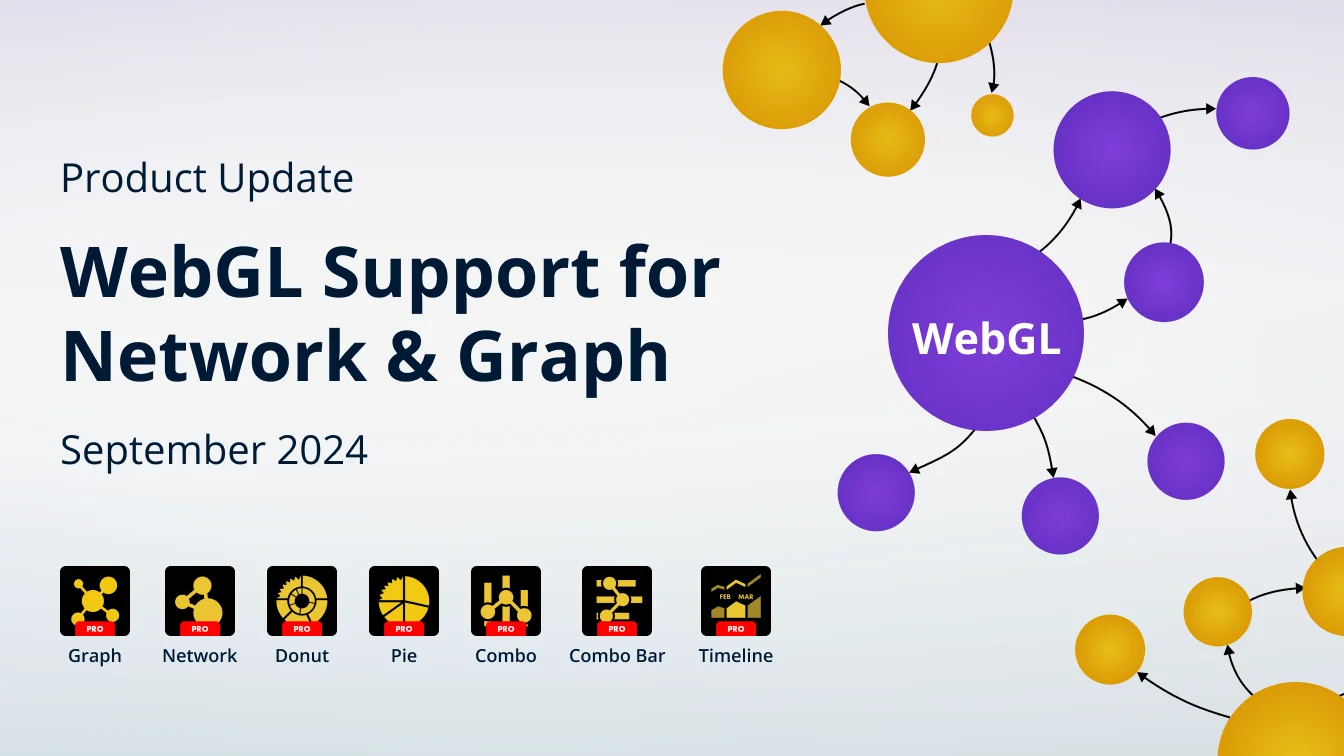
September 2024: New Features & WebGL Support
Our Graph and Network visuals now support WebGL, which will allow visualizing larger datasets. We also added useful customization features to Pie, Donut, Combo, Combo Bar, Timeline and Graph visuals.
Our Graph and Network visuals now support WebGL, which will allow visualizing larger datasets. We also added useful customization features to Pie, Donut, Combo, Combo Bar, Timeline and Graph visuals.
Your visuals should update automatically from AppSource. If your visuals have not received the updates automatically, read this documentation article that explains the manual update process.
Graph: Curved Links
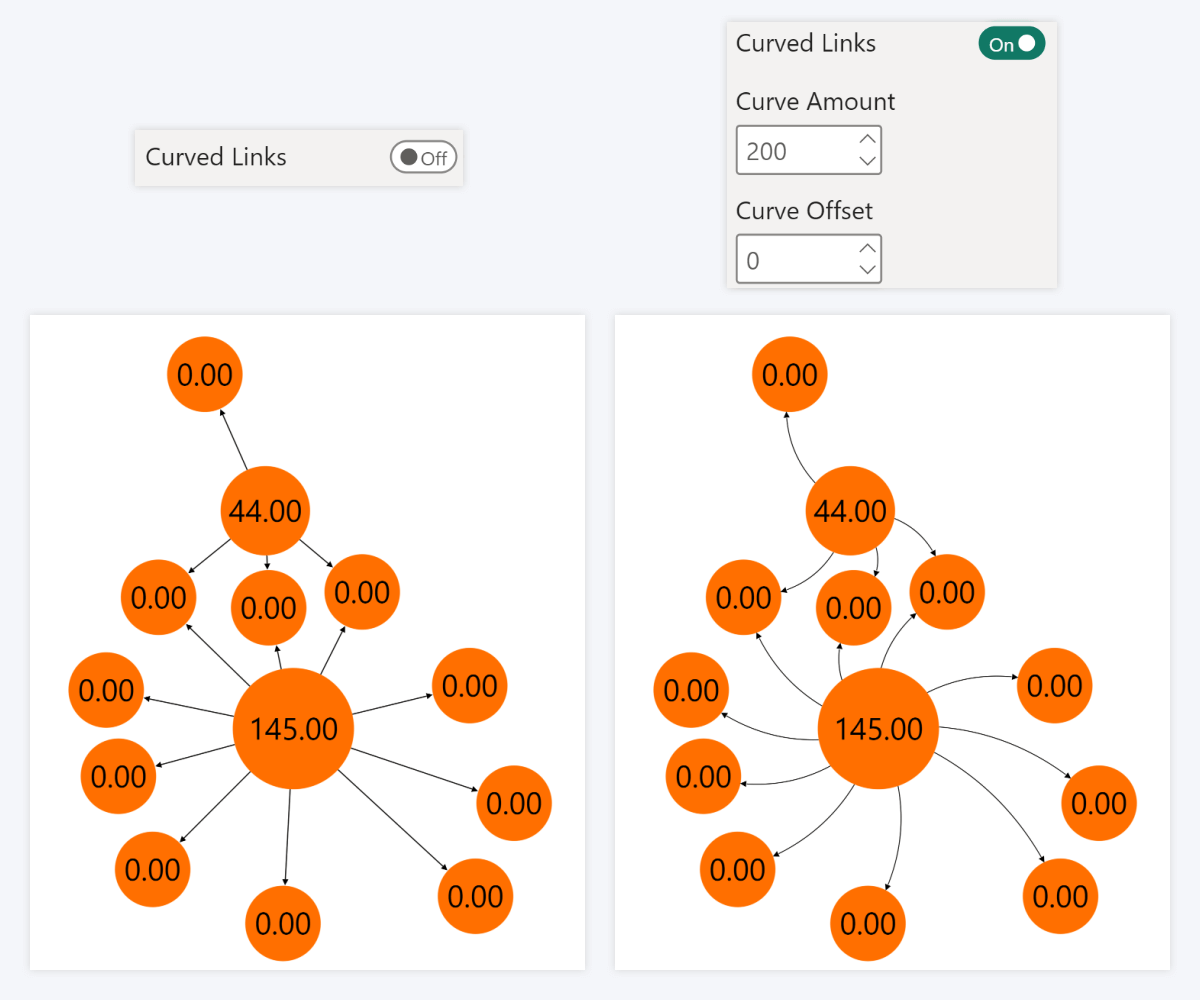
The 1.11.31.0 version of Graph PRO introduces a new customization feature – Curved Links. By default, links that connect nodes are displayed as straight lines, but with this setting, report creators can add a slight curve to the links for appearance and readability purposes.
Once enabled, the curve can be further adjusted with two settings - Curve Amount, which controls the sharpness and direction of the curvature, and Curve Offset, which controls the offset of the curve.
The Curved Links toggle can be found in the Links (Default Category) section; however, if you have set up Link Categories with the Link Category Class field, you can also configure each category separately with Curved Links toggles in their respective Link Category sections.
- For all links: Links (Default Category) -> Curved Links
- For a specific link category: Link Category X -> Curved Links
Pie & Donut: Show Items with Zero Value in Legend
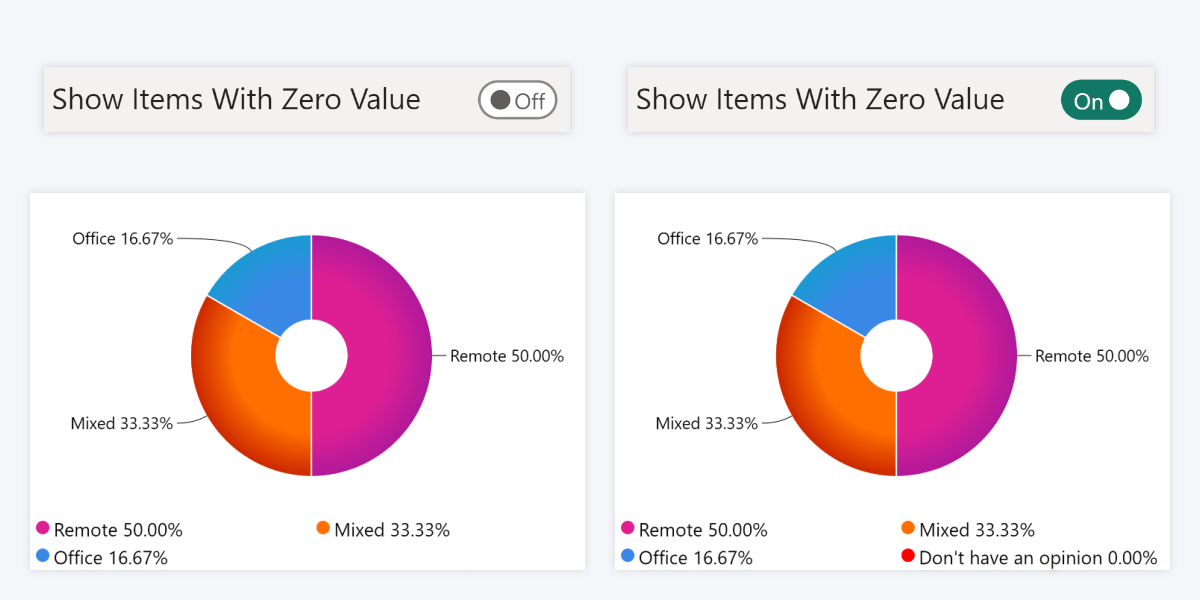
The 1.12.2.0 update for Pie PRO and Donut PRO brings a new toggle – Show Items With Zero Value. If this setting is enabled, the legend will also display categories with 0 value as legend items, despite them not being present as slices on the chart itself. You can find the new setting here:
This setting will be useful in scenarios where it is important to show that a category is present in the data but does not contribute to the total. One such example would be survey data, where all options must be displayed, even if some of them were picked by zero participants.
Keep in mind that this setting will apply to categories that have “0” as their value. Categories with empty values or null will not be affected and they will not be displayed in the legend.
Combo, Combo Bar & Timeline: Value Label Stacking
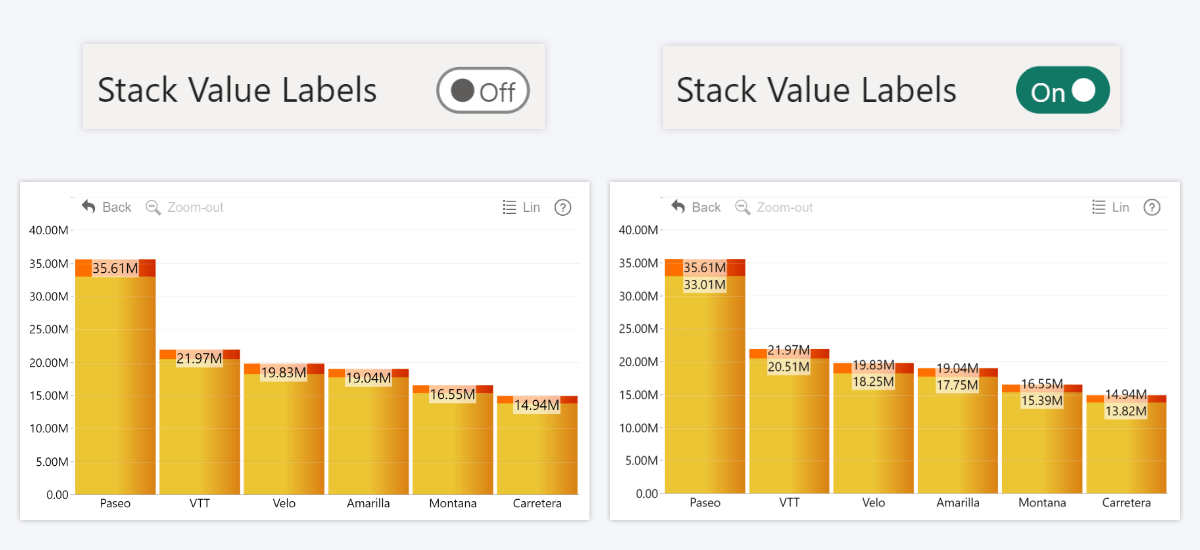
One of the standout features of our Combo, Combo Bar and Timeline PRO visuals is its ability to create stacks from multiple series. However, if two or more series values are close to each other, their value labels may overlap or not display at all (depending on your selected settings).
To avoid this, you can now enable the Stack Value Labels setting which was introduced with the 1.12.3.0 update for Timeline PRO, and 1.12.2.0 for Combo PRO and Combo Bar PRO. If this toggle is enabled, series value labels that overlap will be stacked on top of each other (or side-by-side in Combo Bar) to ensure that they have enough space and are fully displayed.
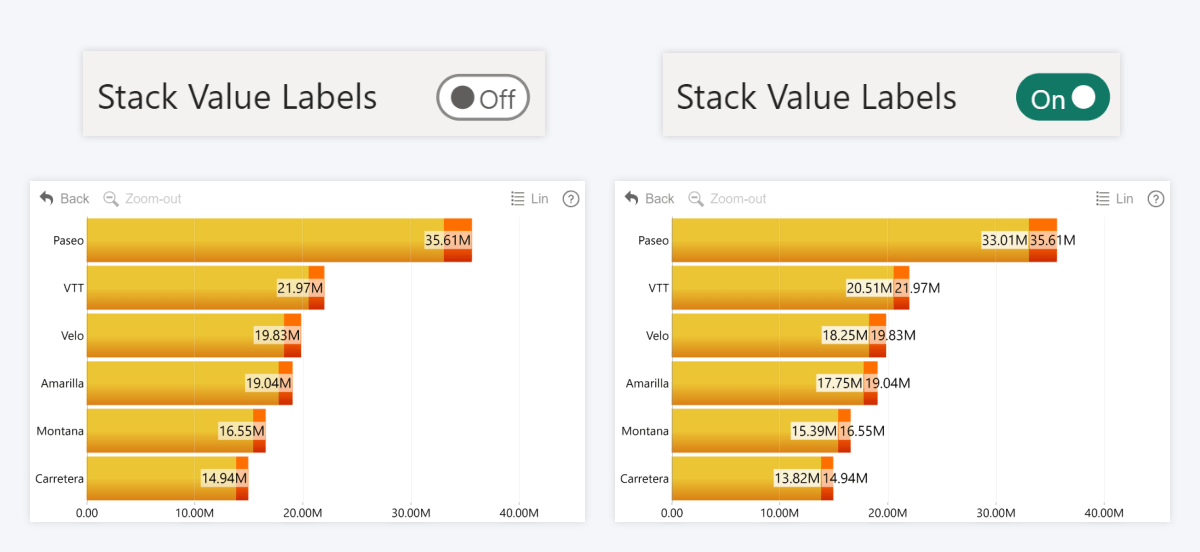
This setting can be applied either as a default for all series, or separately for each series (if the Customize Series Value Labels toggle is enabled for that series). Individual series settings will take priority over the defaults.
- Combo (for all series): Series Value Labels Defaults -> Stack Value Labels
- Combo (for just one series): Series X Value Labels -> Stack Value Labels
- Combo Bar (for all series): Series Value Labels Defaults -> Stack Value Labels
- Combo Bar (for just one series): Series X Value Labels -> Stack Value Labels
- Timeline (for all series): Series Value Labels Defaults -> Stack Value Labels
- Timeline (for just one series): Series X Value Labels -> Stack Value Labels
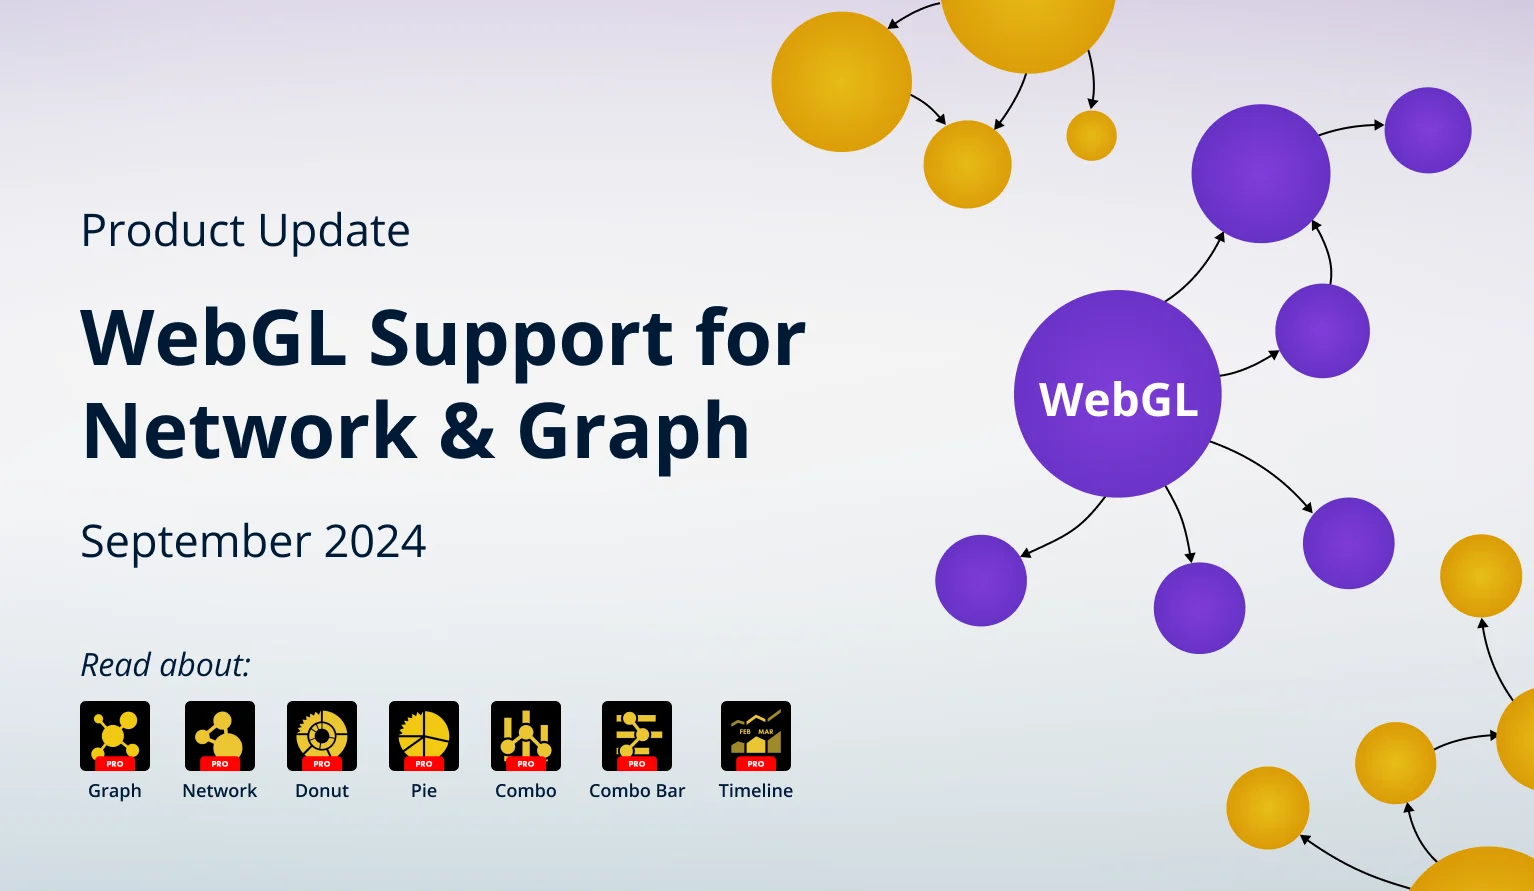
Graph & Network: WebGL Support
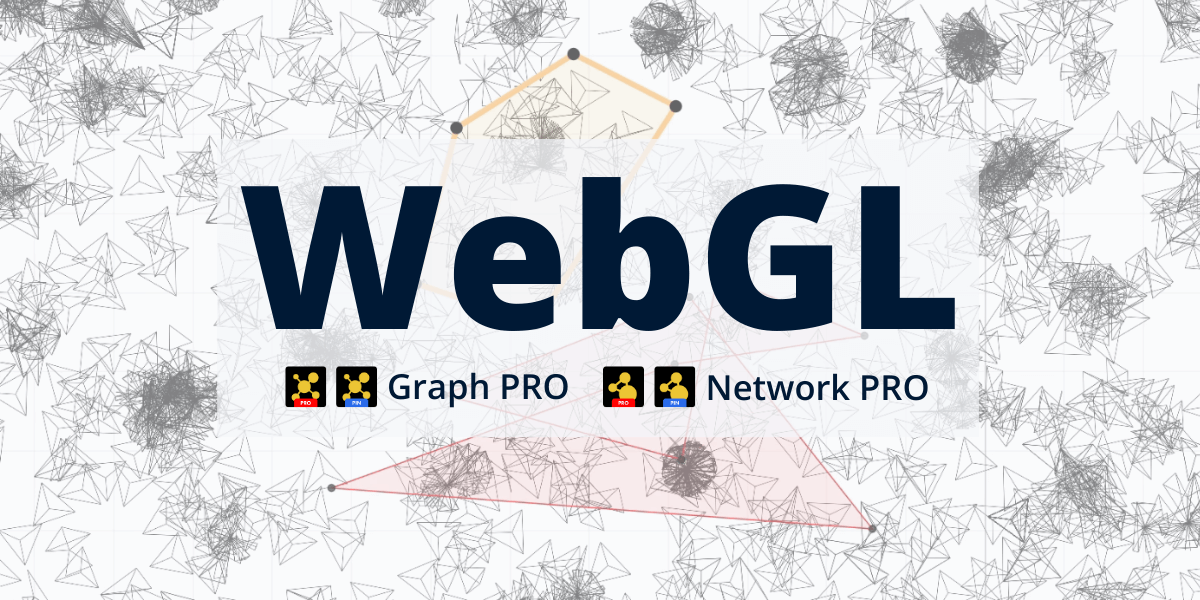
With the 1.11.31.0 versions of Graph PRO and Network PRO, we have made the switch to WebGL, which will enable the visuals to utilize the user’s graphics processor more efficiently. This was done with the intention to improve the visuals’ capability to visualize complex datasets with a large number of nodes and links.
However, report creators are advised to consider data readability and performance when creating visualizations, as higher node counts will require more resources to work smoothly. We recommend selecting a node limit that's appropriate for your intended use case and user requirements using the Advanced Settings -> Node Count Limit setting in Graph PRO.
Get Started with ZoomCharts
Be sure to download the latest version of ZoomCharts Visuals to enjoy these new additions, along with hundreds of other features! With a free trial available, you can see for yourself how these powerful visuals can take your Power BI reports to the next level.

Want more info like this?
Subscribe to our newsletter and be the first to read our latest articles and expert data visualization tips!