logo
For Power BI
  • Products
    • Drill Down Donut Pro Drill Down Donut PRO
    • Drill Down Pie Pro Drill Down Pie PRO
    • Drill TimeSeries Pro Drill Down TimeSeries PRO
    • Drill Combo Pro Drill Down Combo PRO
    • Drill Map Pro Drill Down Map PRO
    • Drill Scatter Pro Drill Down Scatter PRO
    • Drill Down Network Pro Drill Down Network PRO
    • Drill Down Waterfall Pro Drill Down Waterfall PRO
    • Drill Down Graph Pro Drill Down Graph PRO
    • Drill Down Timeline Pro Drill Down Timeline PRO
    • Drill Down Combo Bar PRO Drill Down Combo Bar PRO

    Video tutorials

    Watch Now

    More than 90 videos on how to enhance Power BI with ZoomCharts

    Learn more
    All visuals
  • Resources

      Resources

    • Documentation
    • Report Examples
    • Blog
    • Webinars
    • Video Tutorials
    • Visuals Gallery

    Support

    • ZoomCharts Assistance
    • Contact Sales
    • Contact Support
    • FAQ

    Challenges

    Challenges

    Improve your report creation skills by participating in free challenges for report creators.

    Learn more
    Start trial
  • Services
    • Power BI Report Development
    • Custom Visual Development
  • Challenges
  • Pricing
Request a quote Start Free Book a Demo Sign in
Get it now
Go back

Contents

Go back

Oct 03, 2024

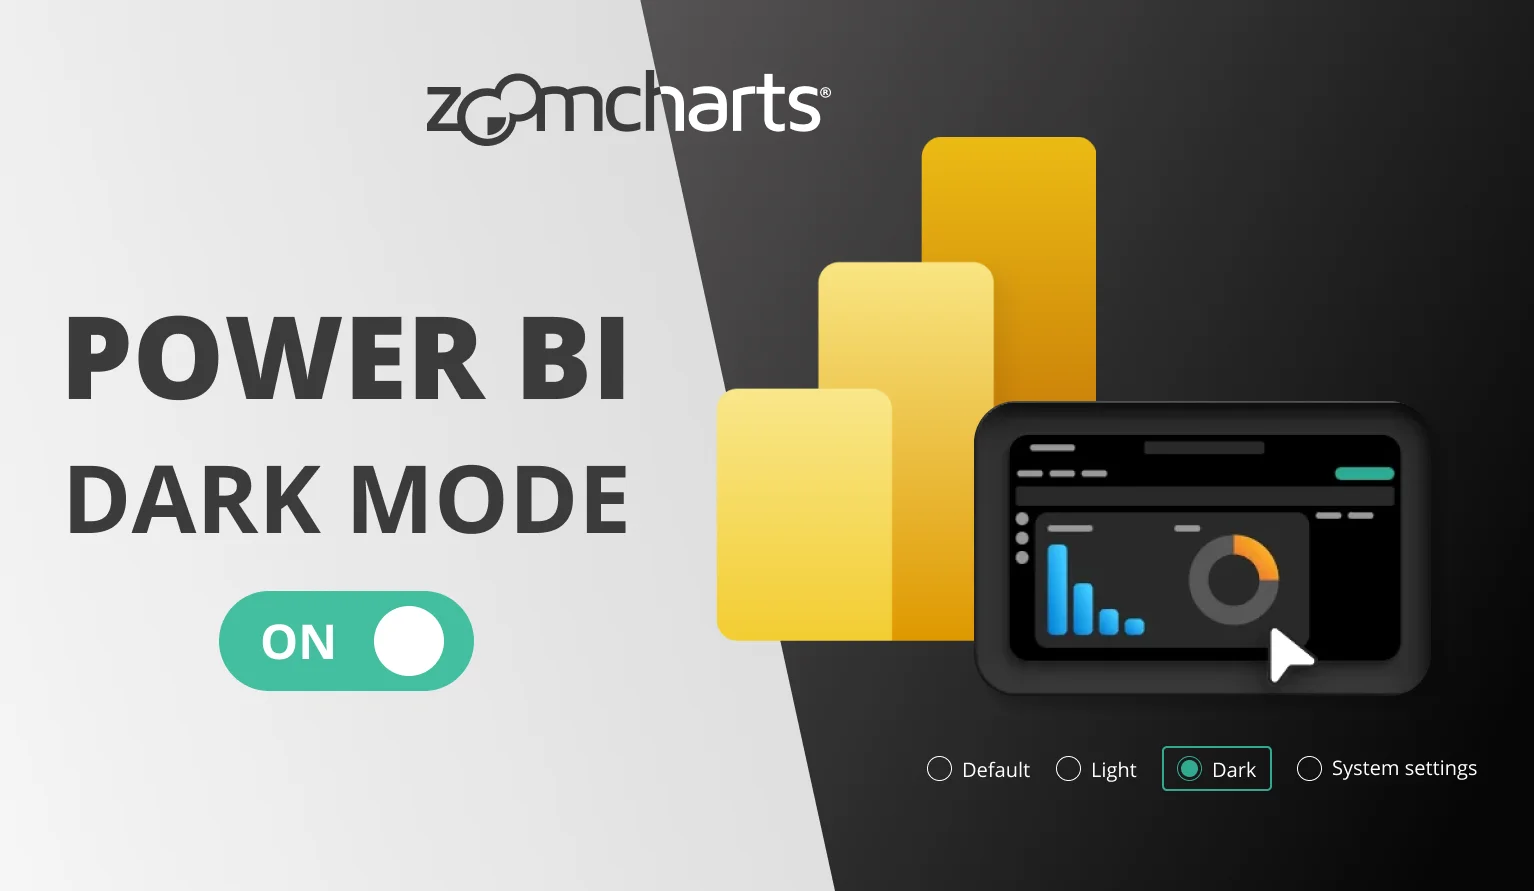
Power BI Dark Mode Is Here

Dark mode has arrived in Power BI! Read how to enable the dark mode in Power BI, plus insights and opinions from our team.

Title image
Title image

Dark mode has arrived in Power BI! Read how to enable the dark mode in Power BI, plus insights and opinions from our team.

Contents

Share this article

What is Power BI Dark Mode?

With the September 2024 update, Microsoft has introduced the much-requested dark mode to Power BI Desktop. Currently, Power BI dark mode is released as a ‘preview’ feature, which means that it could be changed in future updates and users should enable it at their own risk.

Enabling the dark mode will change the appearance of the Power BI workspace (including the ribbon menu, side panes, Table and Model views, and other UI elements) to one that uses darker tones. Power BI dark mode will not affect the report canvas.

Power BI Dark Mode: Report View

Power BI Dark Mode: Model View

This feature brings Power BI Desktop in line with various software products like Windows 11, Microsoft Office, Teams and others that offer dark modes, allowing you to create a workspace that’s most comfortable for you.

Dark modes are a popular choice because they reduce the overall screen brightness, which results in less eye strain when working in dimly lit environments – perfect for us night owls! In addition, dark modes work especially well with OLED displays which can turn the black pixels off entirely.

How To Enable Power BI Dark Mode

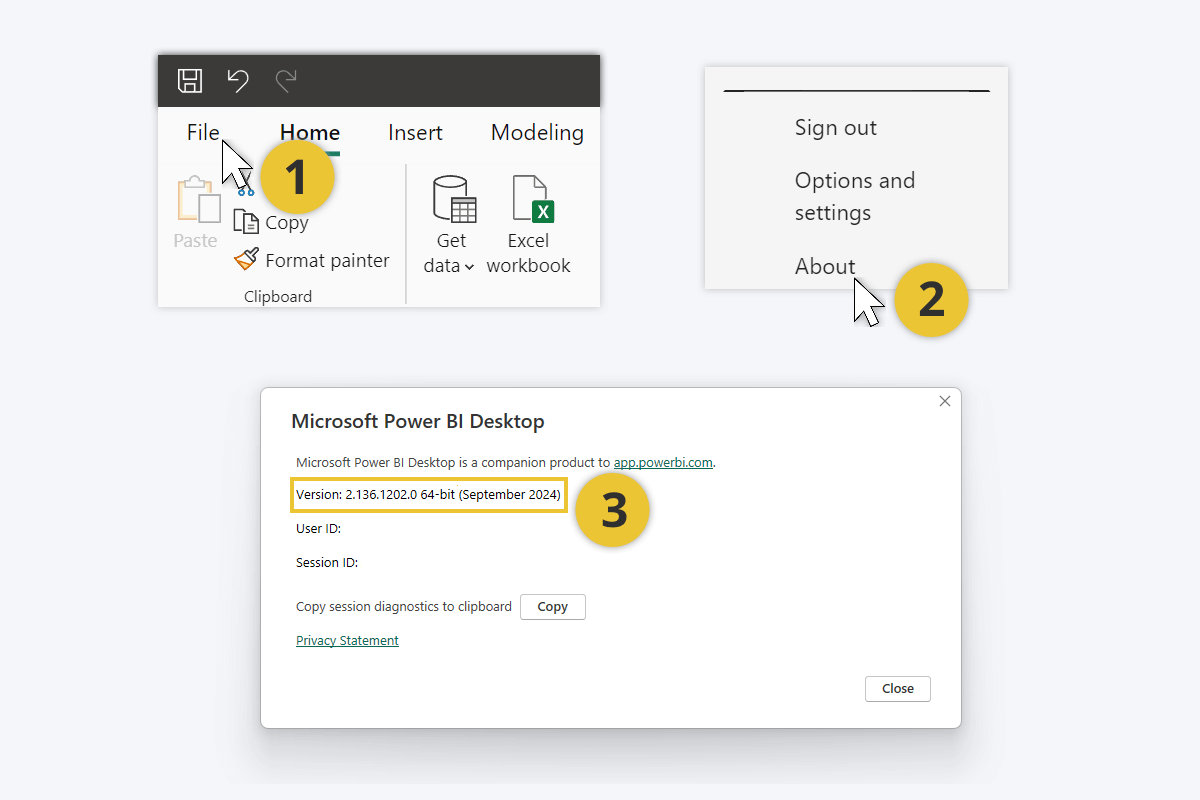
The new personalization setting, which includes dark, light, and legacy themes, is available in the September 2024 version of Power BI Desktop. You should receive the update automatically, but you can check your current Power BI version by selecting the File tab on the top ribbon and pressing About in the bottom left corner.

How To Check Power BI Version Number

If you have the latest version of Power BI Desktop, you can select your theme in the settings.

  1. Head to the File tab in the top ribbon.
  2. Press Options and settings on the bottom left corner.
  3. You will see two items – click on Options to open the settings menu.
  4. In the settings menu, select Report settings under the Global.
  5. Under Personalization, select your preferred theme from the drop-down menu.

How To Enable Dark Mode in Power BI Desktop

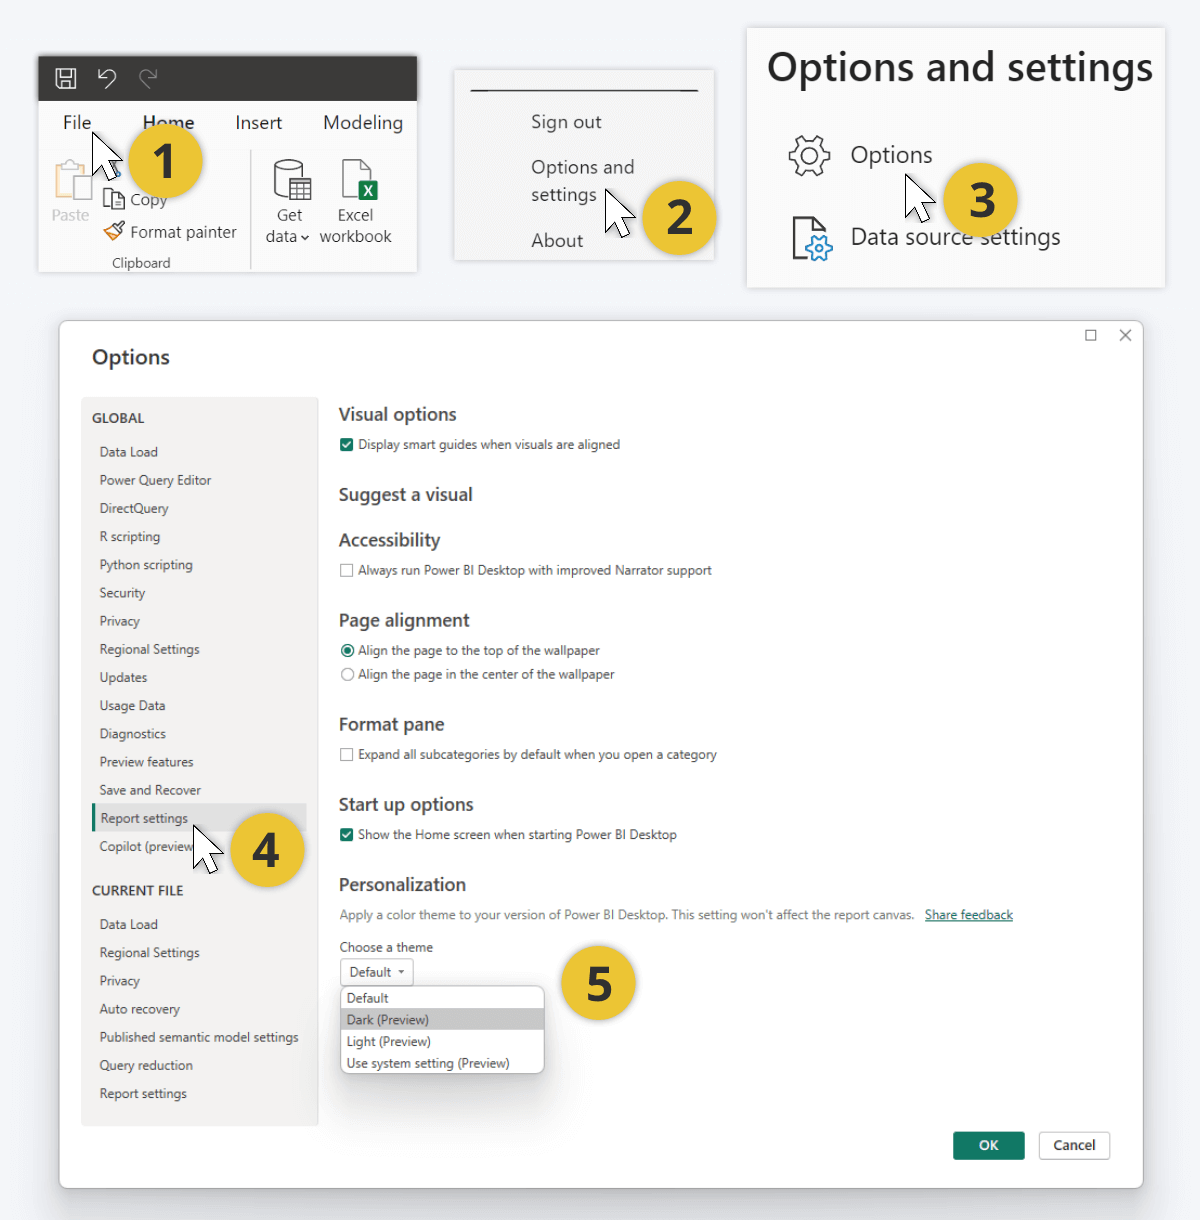
You can choose between four options. The Default theme looks exactly like before, with off-white backgrounds, gray title bar, and dark icon outlines and text. Choose Dark (Preview) if you wish to enable the new Power BI dark mode – the backgrounds and menus will turn black, but the icon outlines and text will become white or light gray.

In addition, the update introduces the new Light (Preview) theme which is similar to the classic theme but with a white title bar. Furthermore, the Use system setting (Preview) option will automatically switch between Power BI dark mode and light mode based on your current Windows system theme.

Power BI Dark Mode vs Light Mode Comparison

What We Think About the Power BI Dark Mode

At ZoomCharts, we develop custom visuals for Power BI and design ZoomCharts Experience Reports for our customers, which means that we spend thousands of hours looking at Power BI Desktop windows. We are keen to try out any new addition to the platform, and the dark mode has been one of the most requested features within the Power BI community.

The dark mode is finally here, but was it worth the wait? Will we use it, what do we like about it and what would we like to see improved? We asked the opinion of our ZoomCharts team to see what they think about the Power BI dark mode.

Aivis Pavlovs (ZoomCharts Senior Product Expert): “The most important thing is that Power BI report creators can adjust their work environment to suit their preferences. Choice is always a good thing, after all. I’ve talked with a lot of report creators from our community who participate in ZoomCharts Report Challenges, and the Power BI dark mode is one of the hottest topics at the moment. Many report creators are genuinely excited that it is finally here, and they seem to love the new theme – they say it is easier on the eyes when working for hours in Power BI.

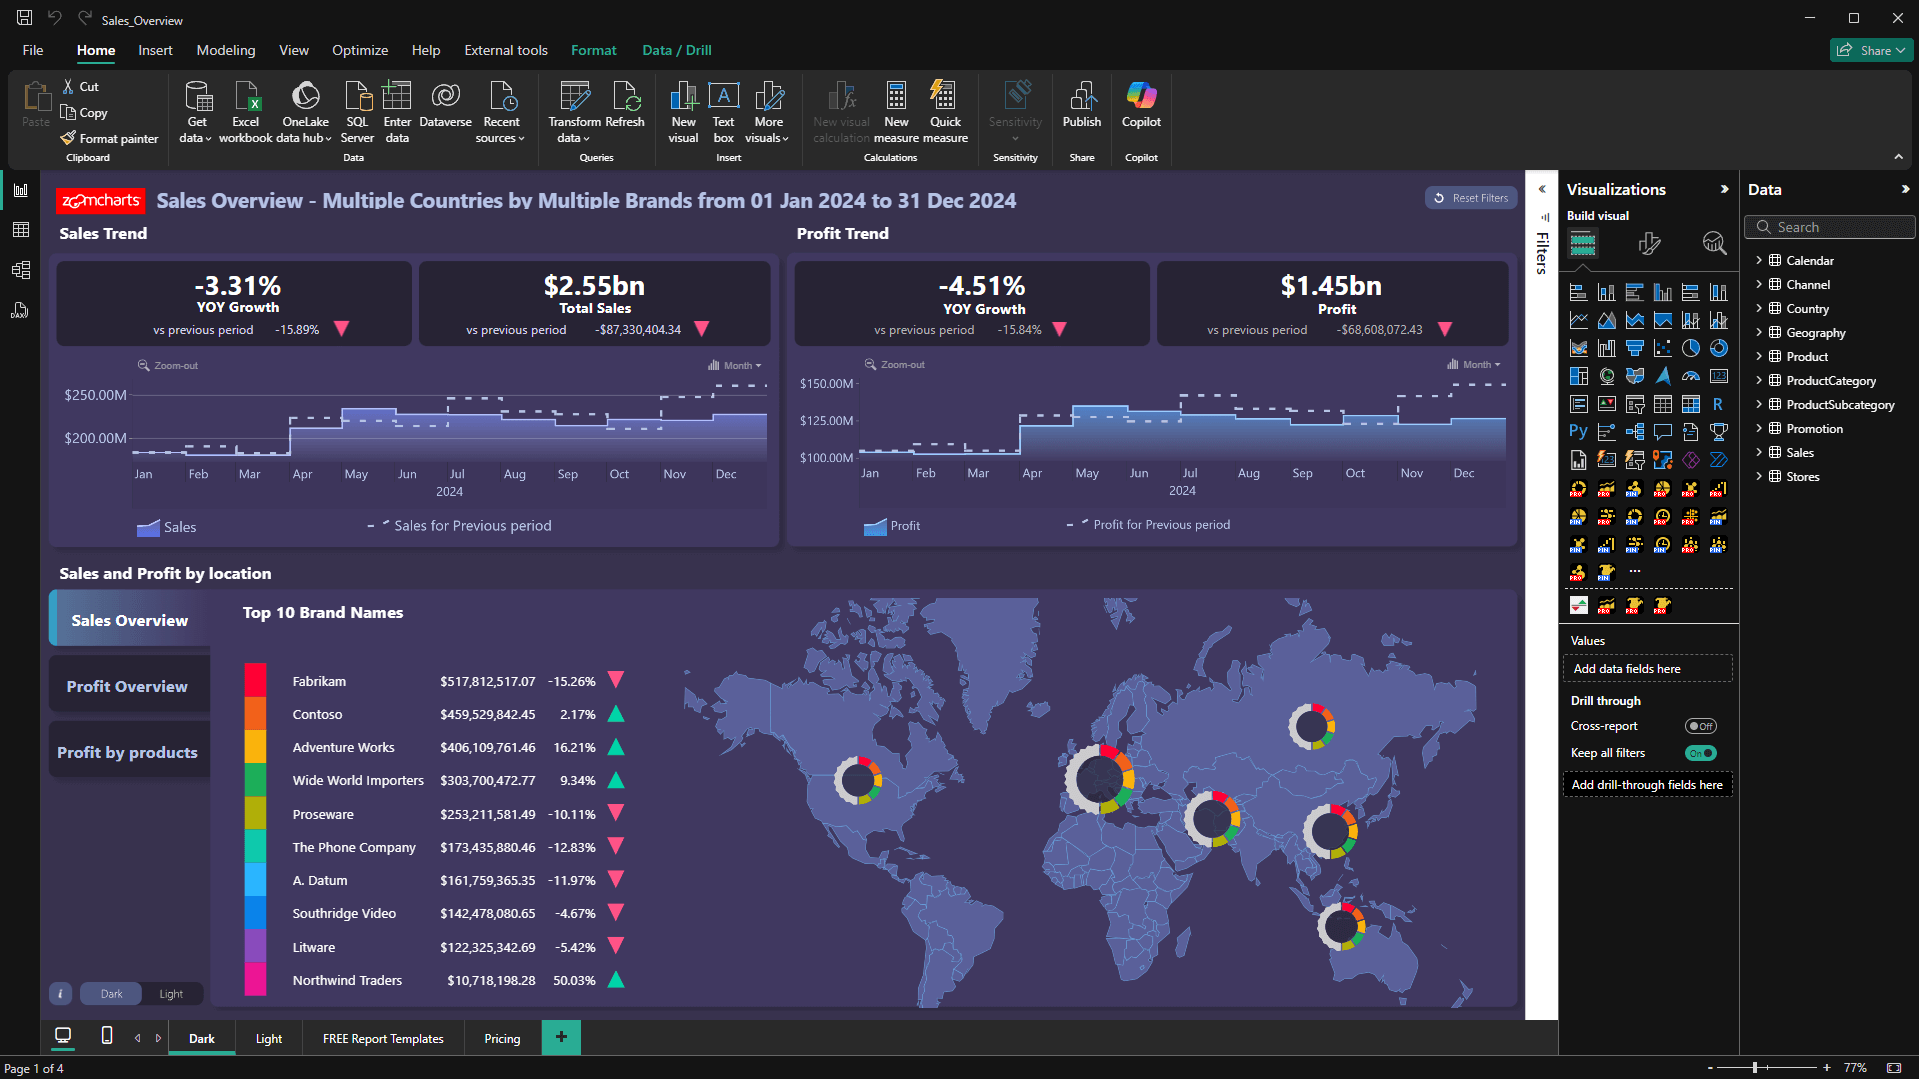
One thing I’d love to see added to Power BI would be an option for report creators to design multiple color schemes for each report page, so that users can toggle between ‘dark’ and ‘light’ report themes. We often include a dark mode ‘toggle’ in our ZoomCharts Experience Reports, which is basically a bookmark to a duplicate report page but with a darker color scheme (like in this Sales Overview Report) so it would be awesome to have a native solution.”

Andžs Auders (ZoomCharts VP of Product Design): “I am a big fan of dark modes, and when the Power BI dark mode was released, I tried it out immediately. It is pitch black, which looks stunning on OLED screens. However, it is a bit too dim for my liking, so I will probably stick to the light theme – but I appreciate the choice. I can’t wait to see how they finetune the dark mode in future updates; ideally, I’d like to see a dark grey variation that isn’t purely black.”

Jānis Volbergs (CEO of ZoomCharts): “I think that the Power BI dark mode is a great addition. I always adjust the settings so that they suit my work environment. During the day, when the office is bright, I prefer light UI themes. However, I must admit that I tend to stay late at work, which is where the dark mode comes in to reduce eye strain from the bright screens. I activated the Use system setting option, so Power BI and all my other work apps automatically switch to dark mode whenever I need it.

The dark mode in Power BI Desktop is a good start, but I hope that it arrives in Power BI Service as well. It would allow more people to enjoy the benefits of the new personalization options, since a significant part of Power BI users explore reports via the web version.”

envelope icon

Want more info like this?

Subscribe to our newsletter and be the first to read our latest articles and expert data visualization tips!


Find out more

Jun 12, 2022

Blog Thumbnail
Guides

Power BI Waterfall Charts: A Detailed Guide

Do you know how to make a waterfall chart? Here are 7 tips you should know when building user friendly Power BI waterfall charts. Customize it to tell a data story that helps you make data driven decisions. Bar and column charts work great for visualizing a beginning and ending value. However, these charts fail to display the full data story by leaving out all the unique factors that contribute to a final net value. In this article, we will look at the basics of waterfall charts and what practices you can implement to build the best waterfall charts in Power BI.

Jul 01, 2022

Blog Thumbnail
Use cases

Microsoft Integrates ZoomCharts in Dynamics 365 Supply Chain Insights

We are excited to announce the collaboration between Microsoft’s latest product – Dynamics 365 Supply Chain Insights – and technologies provided by ZoomCharts – the Network and Map visuals.

Feb 14, 2022

Blog Thumbnail
Guides

Everything You Need To Know About Power BI Bar Charts

Power BI bar charts are a simple and efficient way to show category-based data. Almost everyone has used a bar chart, which is why they've remained incredibly popular through the years. In this article, we will explore the many ways you can make Power BI bar charts even more powerful and use them to the max.

Dec 16, 2021

Blog Thumbnail

How We Turned Many Excel Files Into an Interactive Power BI Report about Latvia’s Export landscape

How We Turned an Excel Sheet Into an Interactive Report: Latvia Export Barometer. ZoomCharts took part in a widescale project that created a full report of...

Sep 04, 2022

Blog Thumbnail
Guides

Power BI Donut Chart

The donut and pie charts are some of the most ubiquitous charts around. Instantly recognizable by people who have very little to do with charts, every report creator is bound to have to include a Power BI donut chart into a report at some point. This is not a commentary on whether you should love or hate donut charts, but rather a guide on getting the most out of donut and pie charts. Strap in tight, we're going to go over the whys, hows, do's and don'ts of Power BI donut charts.

Aug 30, 2021

Blog Thumbnail
Guides

Business Intelligence Implementation: A Complete Guide

It's no secret that the leading organizations of the world don't take any chances when it comes to business strategy - they use business intelligence to make data-driven decisions. Just like a sports team needs a coach or an army needs a strategist to achieve victory, your can reach your business goals more efficiently with the help of a robust BI system and expert BI analysts.
  • «
  • 1
  • ...
  • 5
  • 6
  • 7
  • 8
  • 9
  • 10
  • 11
  • »

Contents

Share this article

Want more info like this?

Subscribe to our newsletter and be the first to read our latest articles and expert data visualization tips!


Thank you!

Check your inbox to verify your email address.

logo
[email protected]
+44 204 577 3993
logo

Products

Drill Down Network PRO Drill Down Waterfall PRO Drill Down Graph PRO Drill Down Combo PRO Drill Down Combo Bar PRO Drill Down Donut PRO Drill Down Pie PRO Drill Down TimeSeries PRO Drill Down Timeline PRO Drill Down Map PRO Drill Down Scatter PRO All Visuals

Resources

Report Examples Webinars Blog ZoomCharts Academy Visuals Gallery Documentation Custom Visual Development Subscribe to News

Solutions

Custom Visual Development

Company

Pricing About Us Partners Leave feedback Join PowerGroup EU Funding

Help

ZoomCharts Assistance Contact Sales Contact Support FAQ

Drill Down Network PRO Drill Down Waterfall PRO Drill Down Graph PRO Drill Down Combo PRO Drill Down Combo Bar PRO Drill Down Donut PRO Drill Down Pie PRO Drill Down TimeSeries PRO Drill Down Timeline PRO Drill Down Map PRO Drill Down Scatter PRO All Visuals

Report Examples Webinars Blog ZoomCharts Academy Visuals Gallery Documentation Custom Visual Development Subscribe to News

Custom Visual Development

Pricing About Us Partners Leave feedback Join PowerGroup EU Funding

ZoomCharts Assistance Contact Sales Contact Support FAQ
+44 204 577 3993
[email protected]

Ready to get in touch?

Contact our experts with any question about Power BI and ZoomCharts for Free!

Contact us

© 2025, Data Visualization Software Lab

U.S. Patents No. 11,645,343; 11,921,804

Cookies Policy
Manage cookies
Privacy Policy
Global
EULA
Patent
warning

Error message

success

Success info: Done!

ZoomCharts AI Assistant

We noticed you're using an old OS version.

For the best experience, we recommend upgrading to ensure that all website features display correctly.

Cookie settings

We use necessary cookies for site functionality, as well as statistic, marketing, and preference cookies to enhance your experience. For more information and to manage your preferences, please visit our Cookie policy