Oct 01, 2024
Business Intelligence: What It Is & How To Implement It
Business intelligence empowers organizations to become data-driven and improve efficiency. This article provides helpful tips on how to get started with BI and explains the most important business intelligence terminology.
Business intelligence empowers organizations to become data-driven and improve efficiency. This article provides helpful tips on how to get started with BI and explains the most important business intelligence terminology.
What is Business Intelligence?
Business intelligence (BI) is a process in which business data is systematically gathered and processed so that employees can easily access and analyze it for data-driven decisions. In short, business intelligence is what transforms large amounts of raw data into insights and allows companies to take data-driven decisions.
While the term ‘business intelligence’ covers a wide range of processes involving data, this article will focus on the following parts of BI:
- Data collection: Data is entered or collected in multiple data sources which can then be integrated for storage and transformation.
- Data storage: The data is stored so that it can be cumulated and transformed for analysis.
- Data transformation: The collected data is cleaned, structured, validated and formatted so that it can be analyzed.
- Data analysis: The data is visualized in a way that allows users to accurately interpret it and gain actionable, up-to-date insights.

Usually, ‘business intelligence’ refers to the tools, processes and technology frameworks that enable data-driven decision-making, whereas the human aspects such as communication, training, and employee involvement are covered by the term ‘data culture’. Becoming a data-driven business requires not just implementing the best BI tools, but also cultivating a strong data culture - you can read more in our guide How To Develop a Data-Driven Culture in Your Business.
Key Components of Business Intelligence
As the data makes its way from the data source to the user’s device, it goes through several parts of the business intelligence infrastructure. You will require many of these components to implement business intelligence in your organization. There are also data platforms like Microsoft Fabric that have integrated these parts into a unified solution.
Data Sources
This is where raw data starts its journey through the business intelligence pipeline. Databases, Excel sheets, logs, cloud services, IoT devices, PoS systems – anything that contains data. Multiple data sources can be integrated and stored in a centralized repository, and processed for further analysis.
ETL / ELT
ETL (Extract, Transform, Load) is a set of processes that ingests data from data sources, transforms it (cleaning, standardizing, validation, etc.) and moves it to the target destination (for example, data warehouse or data mart). For large data lakes, the order of processes is often changed to ELT (Extract, Load, Transform) to perform data transformation only when needed.
Data Storage
Once data is ingested from the data sources, it may be stored in repositories that make it accessible to users. We will describe three widely used types of repositories that differ in their size and purpose. Large companies with a lot of data often combine all three types in their BI infrastructure, but businesses with less data may not need data lakes and instead ETL their data directly to a data warehouse and/or data marts. This image shows how an organization would use all three, but not all business intelligence implementations will look like this or use all repository types.
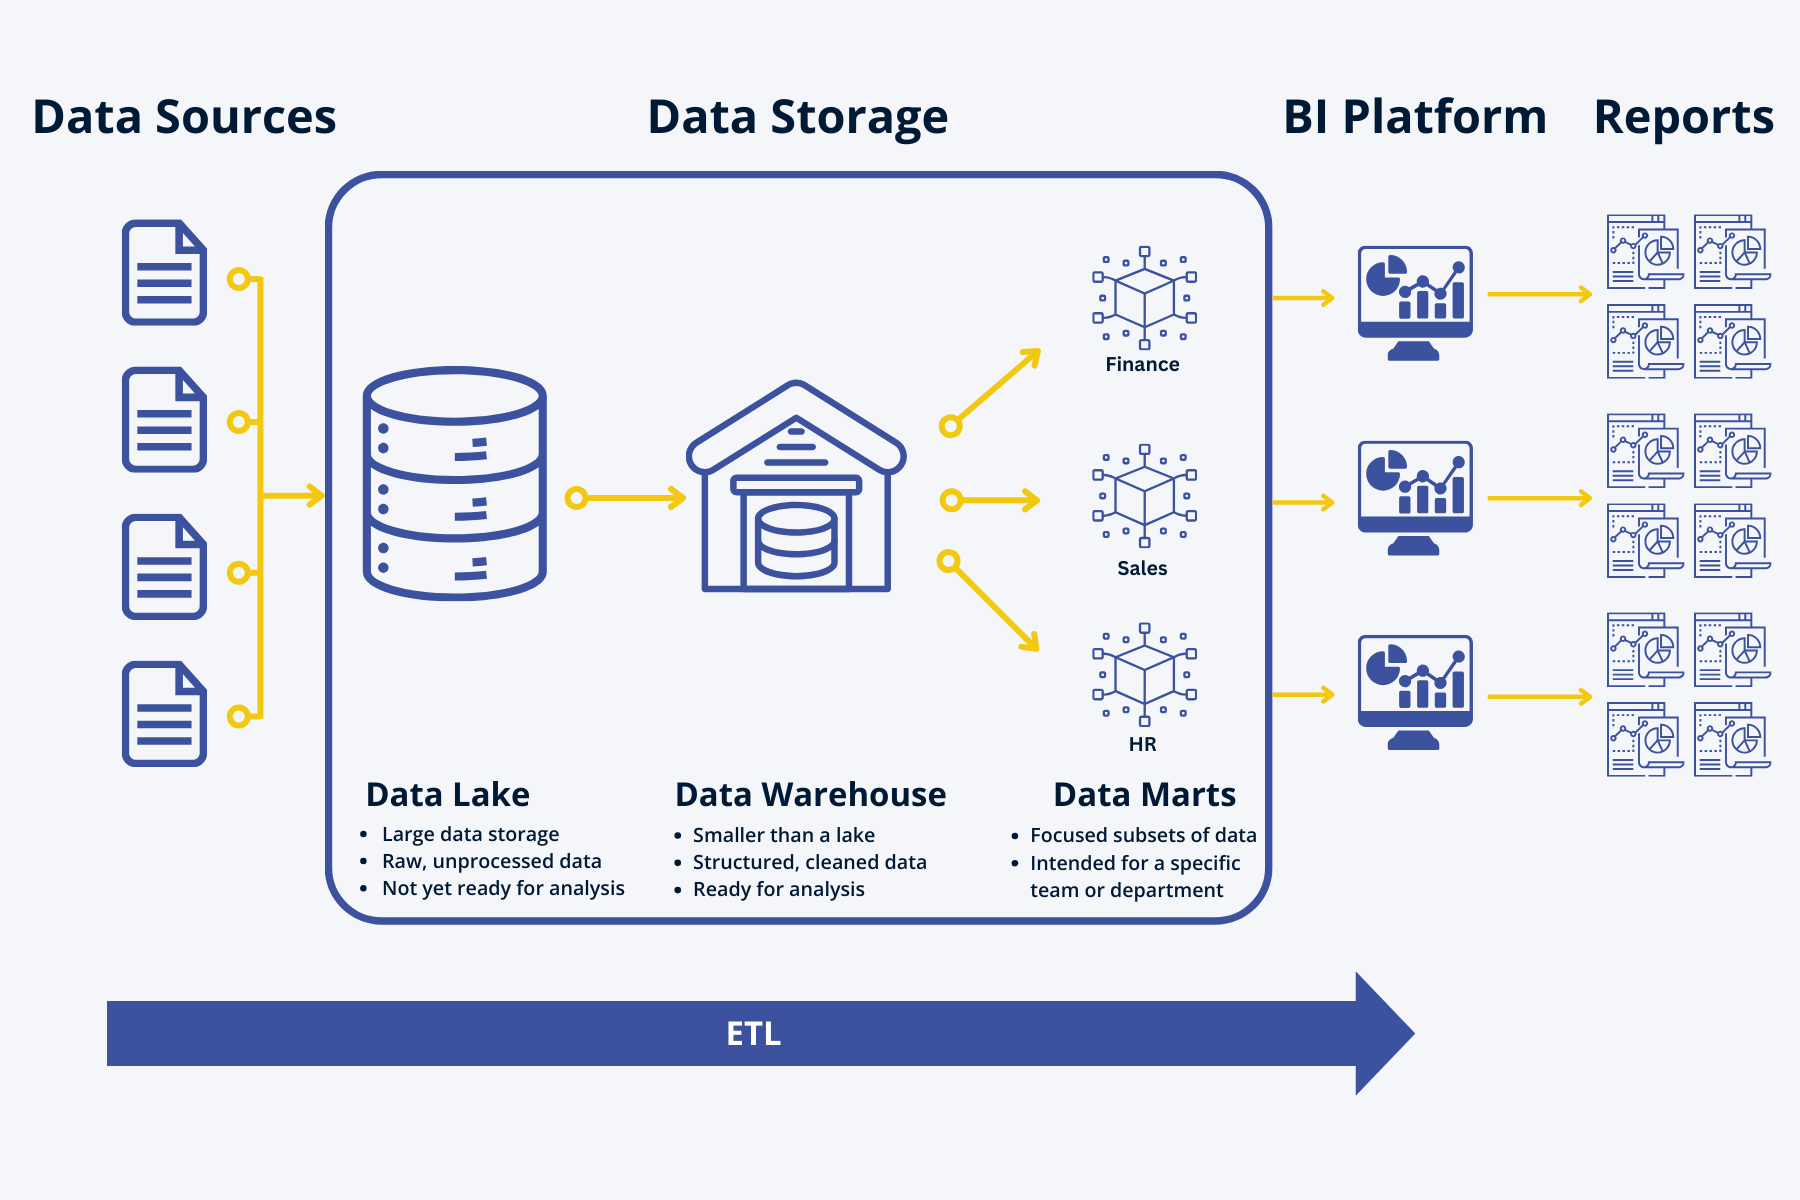
Data Lake
Raw, unfiltered and unprocessed data is usually stored in a data lake, which is a large cloud or on-site repository – it’s the landing zone for data. At this stage, the data is not yet ready for use in business intelligence, as it requires further cleaning and transformation.
Data Warehouse
Once the data is cleaned, standardized and structured, it may be moved to a data warehouse for use in business intelligence. Since data warehouses are more expensive than data lakes, many large businesses use both – they store raw data in data lakes, and move processed data to warehouses to make it available for users. Some businesses have adopted a hybrid between the two – a data lakehouse.
Data Marts
Some businesses separate data warehouses into smaller subsets - data marts - that are focused on specific purposes, such as financial data or sales data, so they contain only relevant data for the department or team. Another benefit is that the department can connect and integrate additional data sources to the data mart that are not in the data warehouse if they need them. Some BI implementations may skip data warehouses altogether and do their ETL directly to data marts.
Business Intelligence Platforms
With business intelligence platforms, report creators can access data from data warehouses, data marts or data sources, create semantic models that integrate data in a way that enables data analysis, perform additional calculations if needed, and visualize data as reports or dashboards so that users can explore them and gain meaningful insights.
There are many business intelligence platforms available on the market. According to Gartner’s Magic Quadrant for Analytics and Business Intelligence Platforms 2024, the industry leader is Microsoft (Power BI and Fabric), with other contenders being Salesforce (Tableau), Qlik (Sense), Google (Looker), and Oracle (Analytics Cloud).

Image source: Gartner
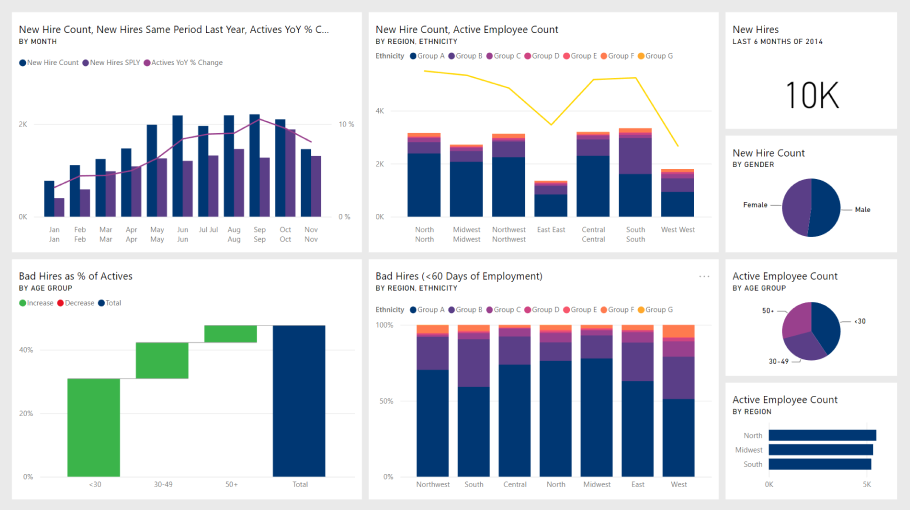
Business Intelligence Reports
Reports contain a curated selection of data that is visualized in a readable, user-friendly way using various charts and visualizations. They are designed to answer specific business questions and allow the user to find relevant insights. This is how most users experience data, which is why it is crucial to provide a great user experience to get the most ROI out of business intelligence.
With business intelligence tools like Power BI, the reports can be interactive and allow the user to easily drill down, drill through and filter data to quickly find what they’re looking for. Reports are usually designed and shared by report creators, or created by the users themselves ad-hoc when they need to quickly find specific data-driven answers.
Business Intelligence Dashboards
Although people often use the terms report and dashboard interchangeably, they have different meanings in business intelligence. Whereas business intelligence reports are intended for interactive data exploration and detailed analysis of a specific topic, business intelligence dashboards condense the most important metrics like KPIs, revenue and other high-level insights in a single-page overview.
Benefits of Business Intelligence
In the past, data analysis was a process with a high barrier of entry, and it often involved a dedicated team of data analysts. With robust business intelligence tools, businesses can empower more employees to easily access and analyze data before making each decision.
From big-picture strategy decisions to day-to-day tasks, business intelligence allows users to find data-based evidence that allows them to make informed and confident decisions swiftly. This will provide immense value to any organization and pave the way to become a data-driven business. Here are some of key benefits of business intelligence:
- Better Decision-Making: With accurate, up-to-date insights, employees can make quick and informed decisions and avoid misleading conclusions or errors.
- Increased Revenue: Business intelligence can produce insights that help optimize business strategy and lead to improved sales and profitability.
- Improved Efficiency: A robust business intelligence infrastructure will save time and resources required to gather, store and process data.
- Faster Reaction Time: New additions or changes in data will travel from the data sources to users faster, allowing businesses to react quickly and mitigate potential risks.
- Competitive Advantage: Business intelligence can help uncover previously unseen trends or opportunities, allowing you to act before competitors.

How To Choose Your Business Intelligence Platform
If you have decided to implement new business intelligence tools in your business and become a data-driven organization, you will quickly find out that there’s a wide range of options available on the market. Which one is right for your business? Are they suited for your requirements? Here are the main factors you should consider when selecting your business intelligence tools.
Cost & Scalability
Business intelligence requires a serious investment before you can enjoy its benefits, so cost is an important consideration when choosing your BI solutions. Taking the size and requirements of your business into consideration, you should find the sweet spot that will provide the highest ROI; if you spend too little, your requirements may not be met, but spending too much may result in diminishing returns.
Most BI platforms (Power BI, Tableau, SAP Analytics Cloud, etc.) are available as SaaS subscriptions with multiple tiers that differ in capacity and features. As we found out in our article “Top 9 Benefits of Power BI”, Power BI offers incredible value for its price and it is, in our opinion, the most cost-effective business intelligence solution.
Scalability is an equally important factor when choosing business intelligence solutions. As your business grows, the number of users and the amount of data will grow with it. That’s why it’s important to choose a platform that makes it easy to add new users and increase capacity when needed.
Data Capabilities
Each business has different requirements when it comes to data. For example, a restaurant chain will have a vastly different data pipeline from a hospital or a software development company. Before choosing a business intelligence solution for your business, make sure that it can seamlessly integrate with your data sources.
Furthermore, the analytics capabilities are a massive difference-maker between business intelligence platforms. For example, Power BI can create incredibly complex semantic models with multiple fact tables if needed, do advanced calculations with DAX and perform predictive modelling.
Other important factors to consider are performance, data volume capacity, data security, and compliance with industry-specific standards (GDPR, HIPAA, and others).
User Experience
The more users start analyzing data every day to make data-driven decisions, the higher the ROI from your investment in business intelligence will be. To achieve that, the business intelligence tool must visualize data in a user-friendly way that makes it easy to find relevant answers and correctly interpret the findings. Good user experience will motivate more users to adopt the platform in their work, and save time on learning.
Your business intelligence tool of choice should provide a wide variety of interactive visualizations and wide customization features so the data can be visualized in user-friendly reports. Furthermore, the reports should provide interactive ways to explore and filter data, and drill down or drill through interactions to quickly find deeper insights on-demand.
Our ZoomCharts Experience Reports push the envelope in data visualization. By combining the data analytics and reporting capabilities of Power BI and the interactivity of ZoomCharts custom visuals, ZX Reports provide an incredible user experience that makes data exploration engaging and intuitive.
With ZX Reports, users can quickly drill down and find valuable insights with just a few clicks directly on the charts, and other visuals will dynamically filter to provide relevant data. Explore live demos of ZX Reports in our Report Gallery and see how they can make data exploration faster, more user-friendly, and more insightful!
Our ZoomCharts Experience Reports service is perfect for businesses looking to improve the user experience of their existing Power BI reports or design new reports from the ground-up. Get in touch with us and we will design and develop a tailor-made ZX Report for your requirements, train your team and provide a custom licensing plan for your business.
Key Takeaways
- Business intelligence is crucial to become a data-driven organization and remain competitive in the modern business landscape.
- Business intelligence encompasses the entire journey of data - from their sources all the way to the user’s device, and it consists of multiple components.
- Getting the most out of your investment in BI requires not just a robust technical infrastructure, but also a focus on user experience. Better report UX means that more users will explore data every day.

Want more info like this?
Subscribe to our newsletter and be the first to read our latest articles and expert data visualization tips!