Registration Open
Registration Open
28 February | 18:00
-
Reset your password
We'll email you instructions on how to reset your password
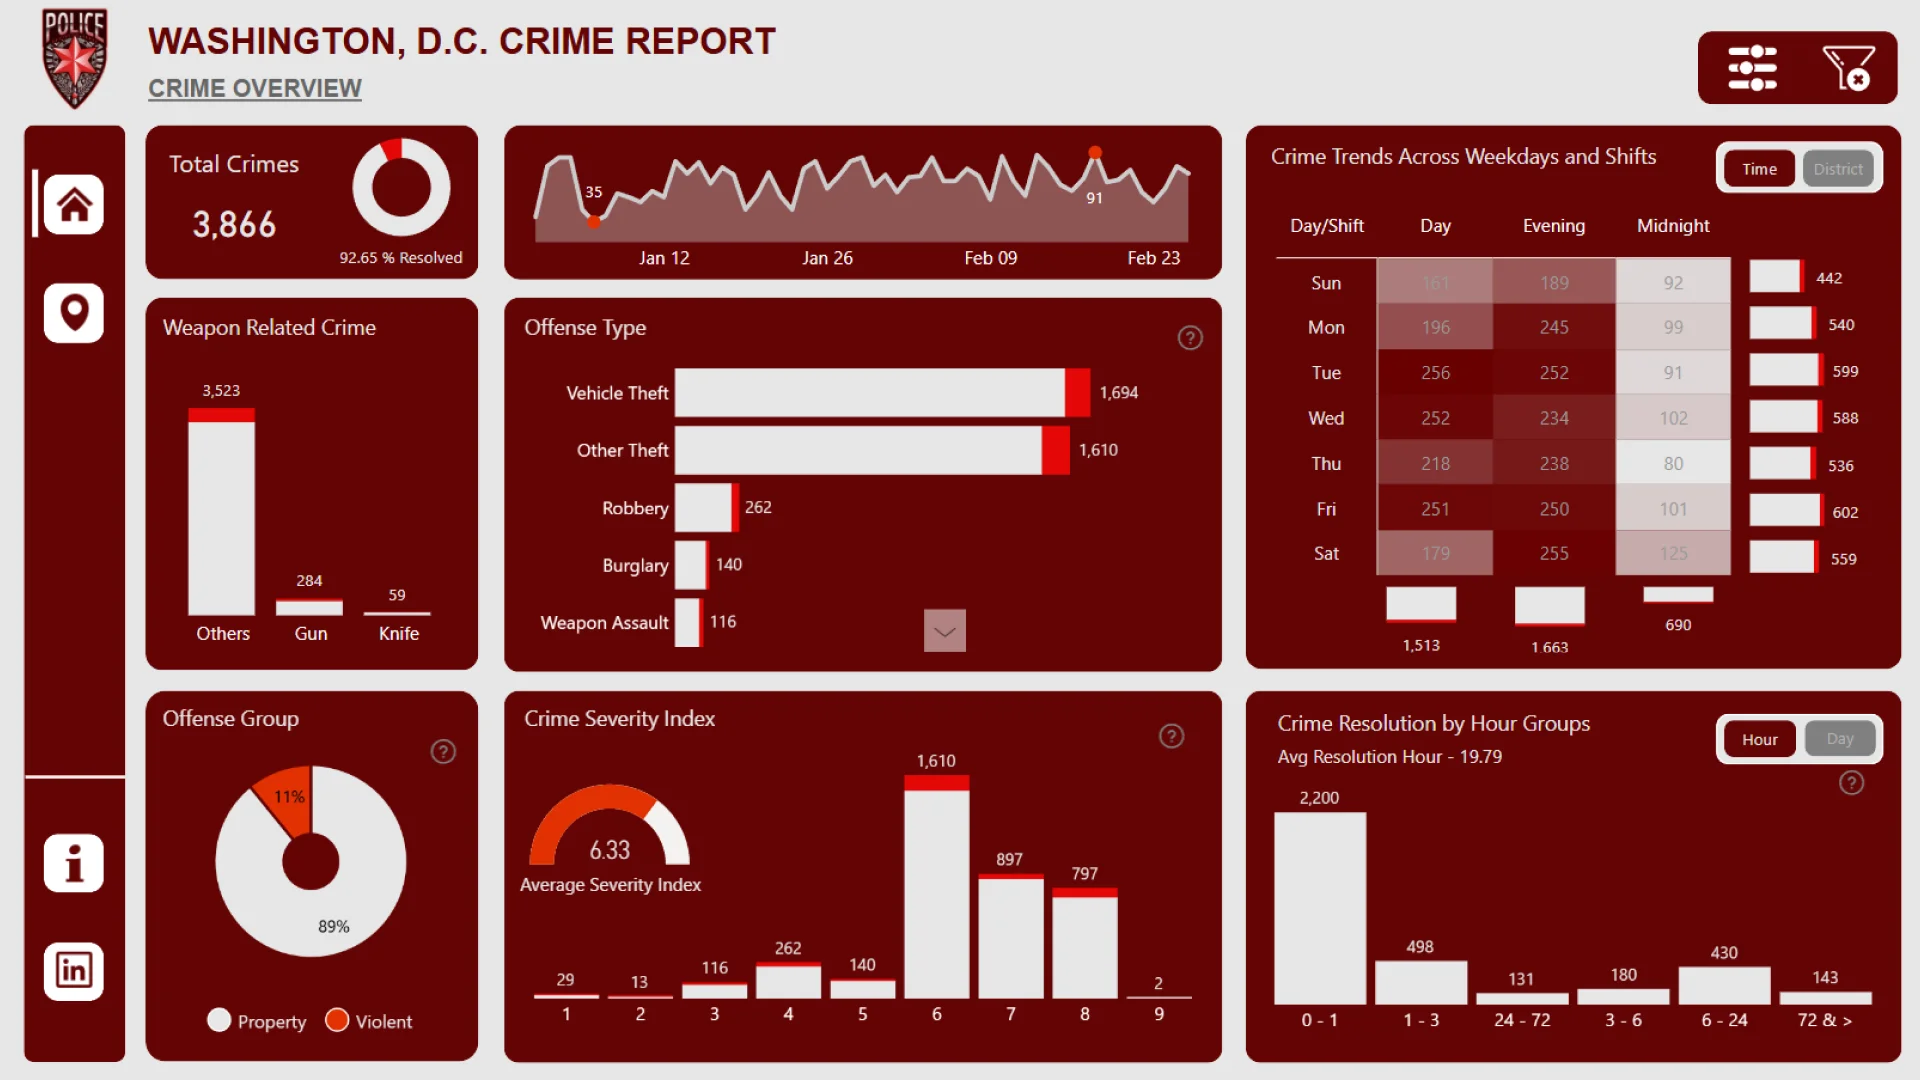
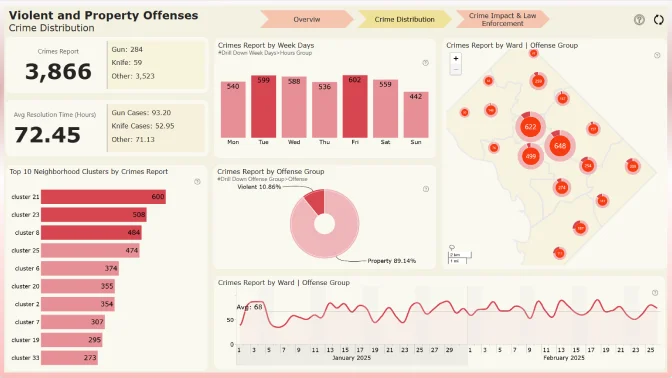
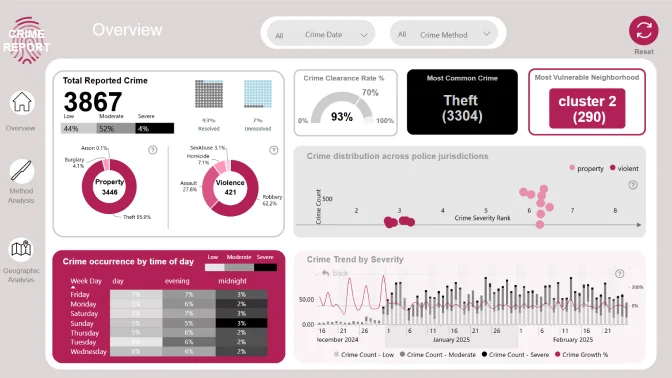
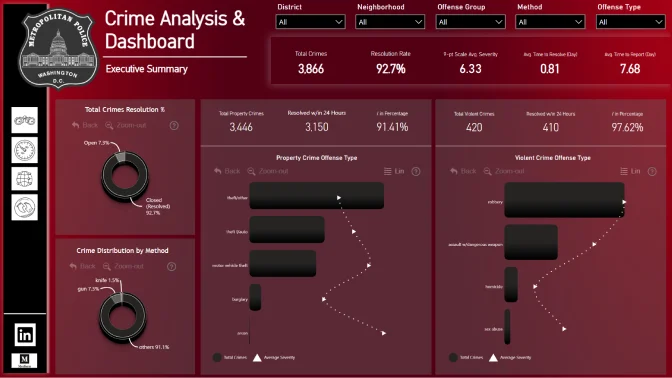
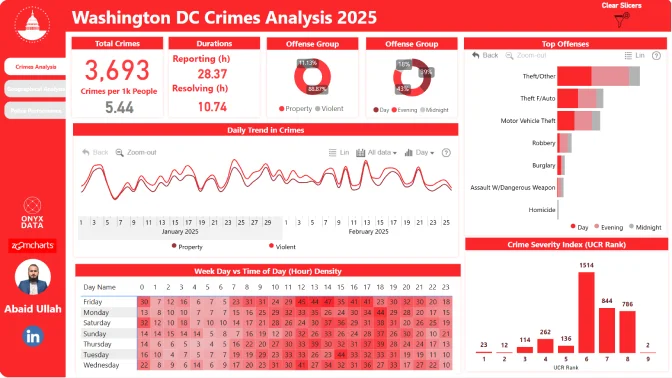
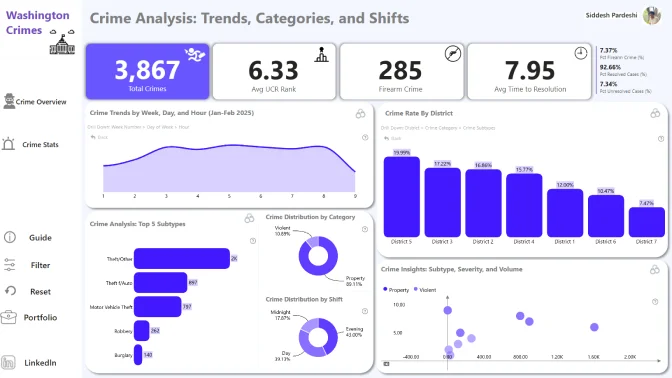
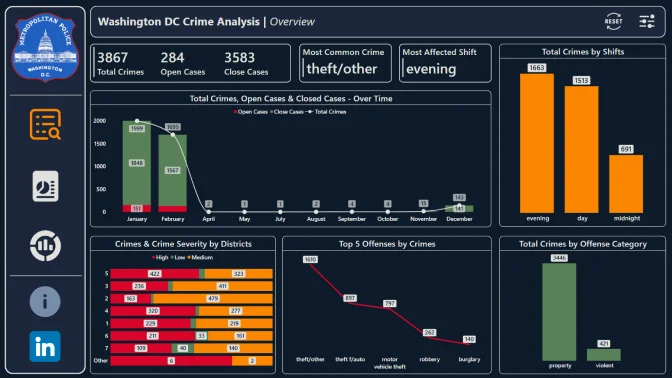
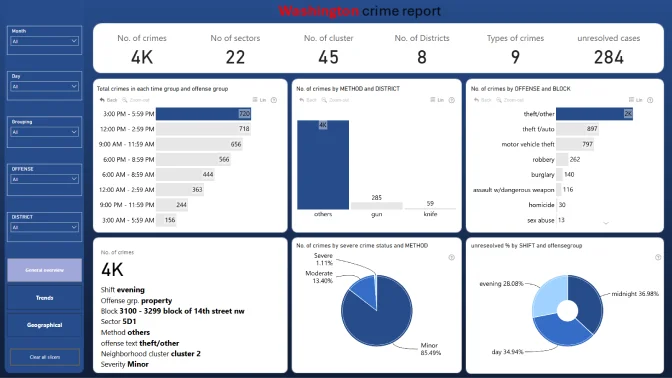
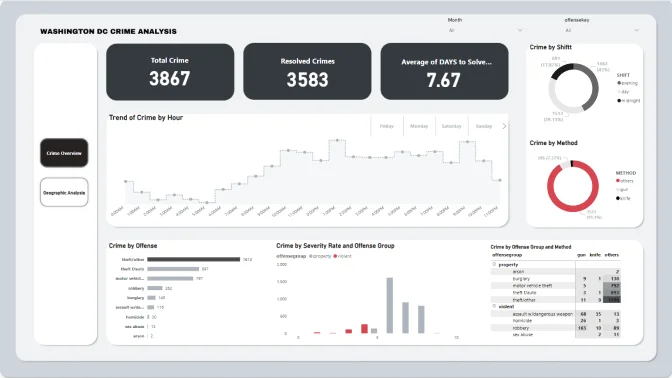
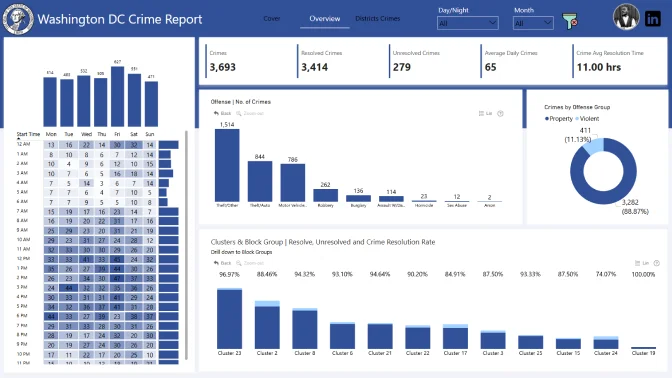
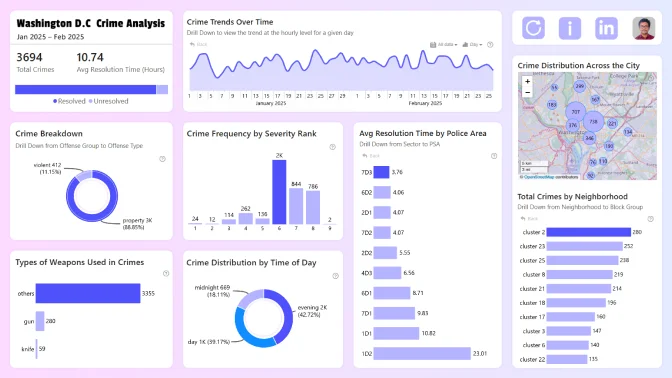
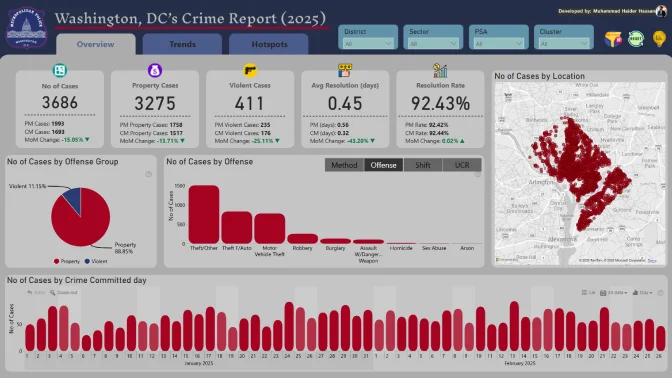
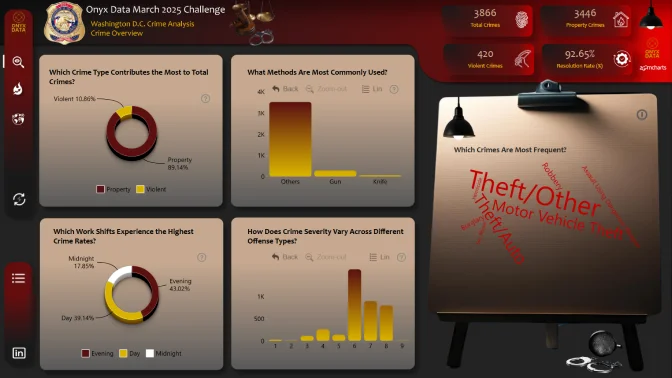
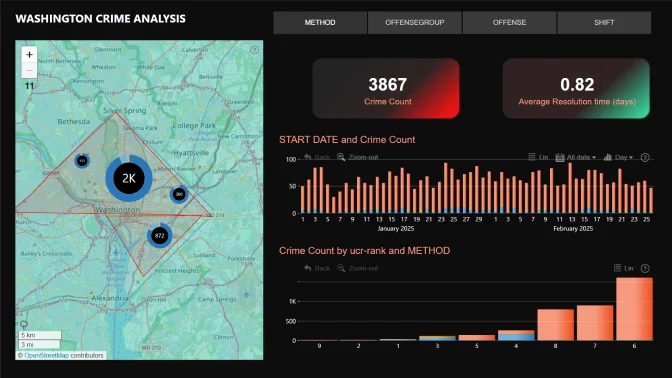
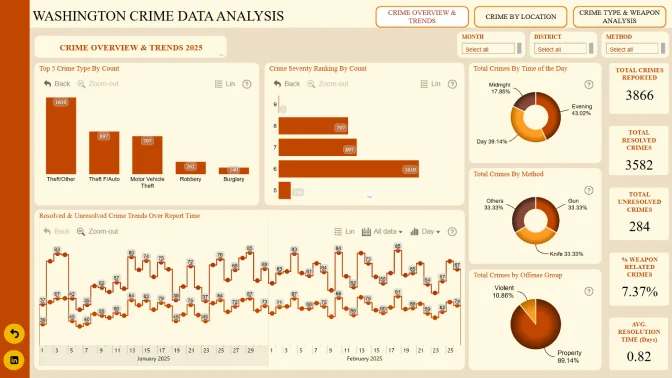
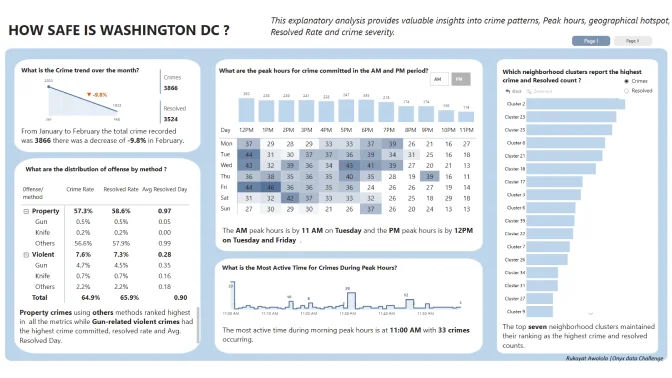
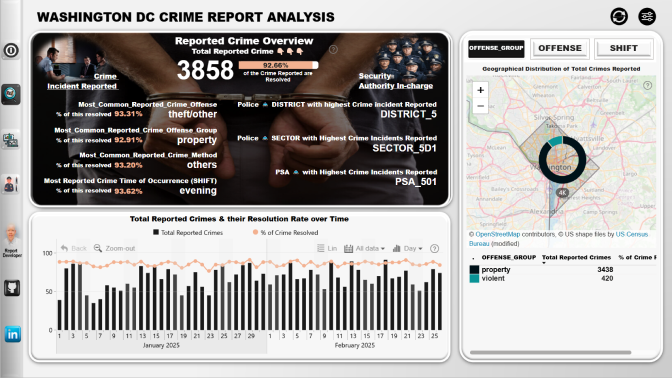
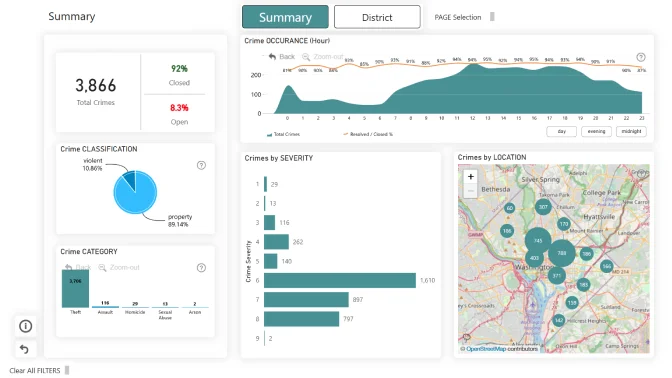
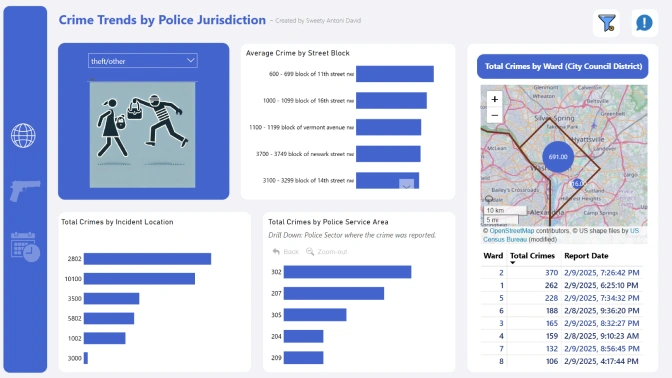
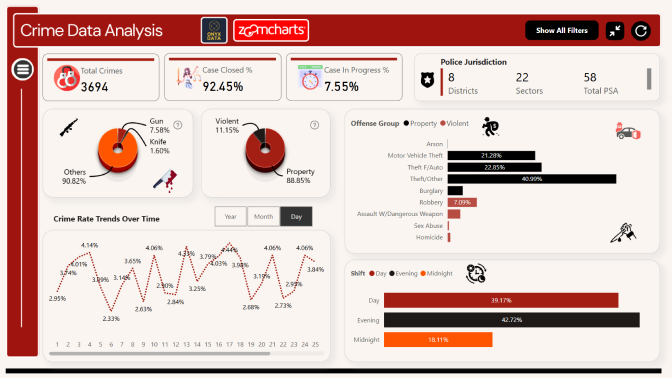
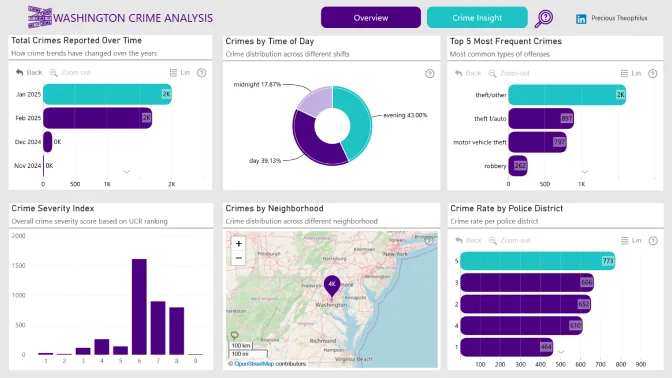
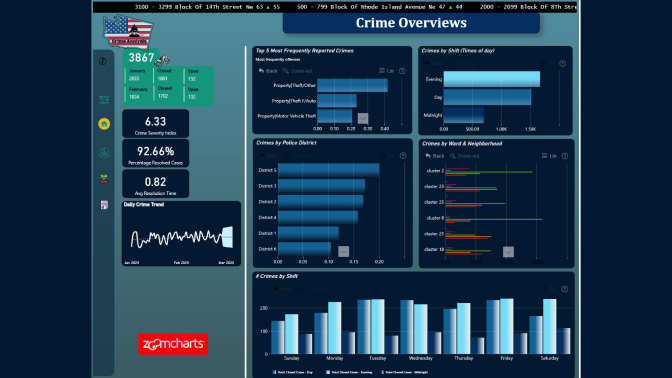
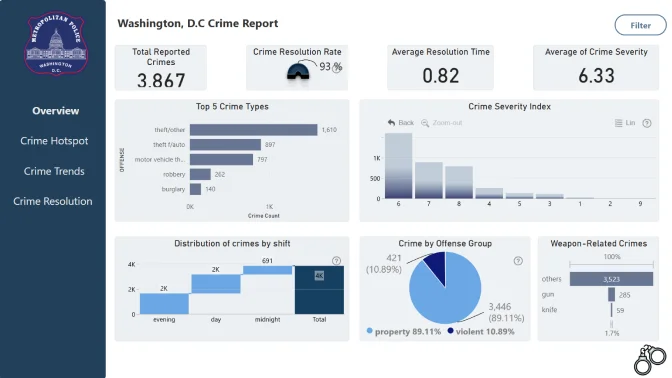
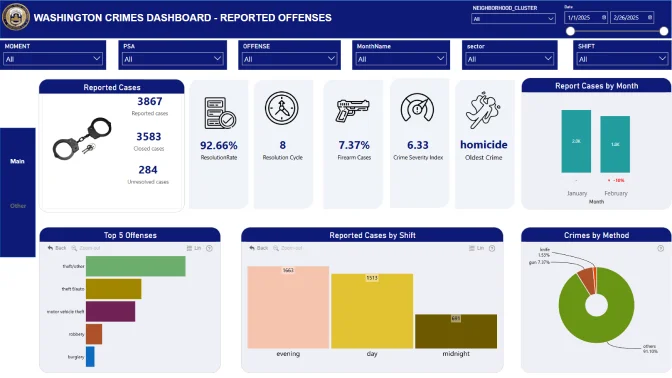
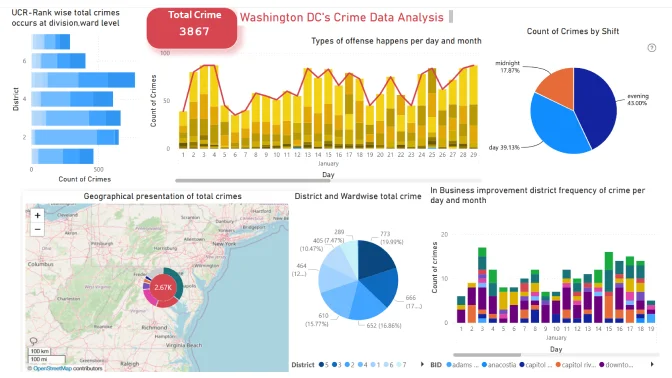
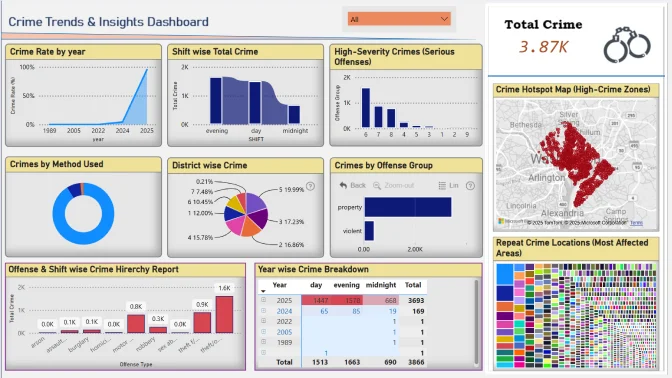
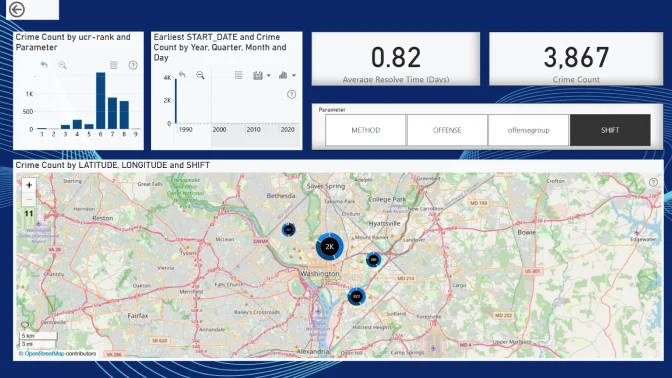
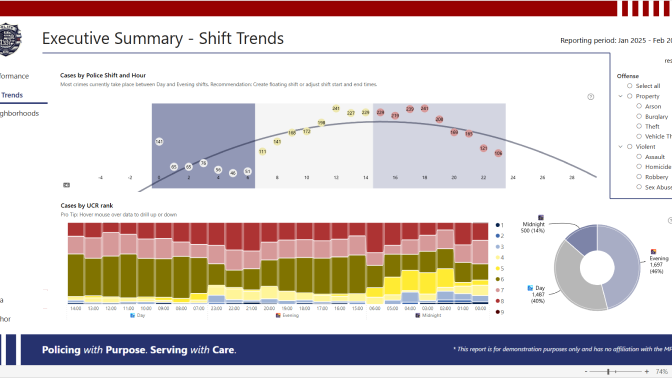
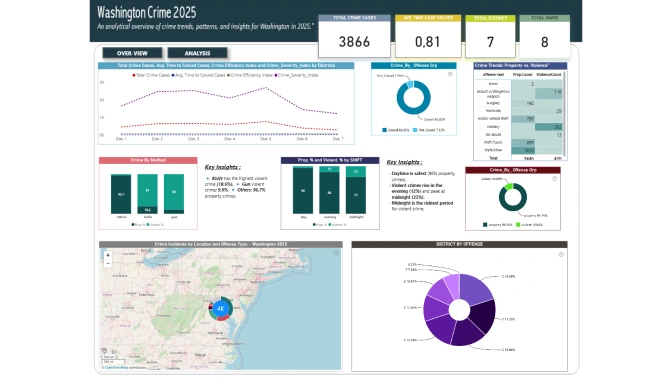
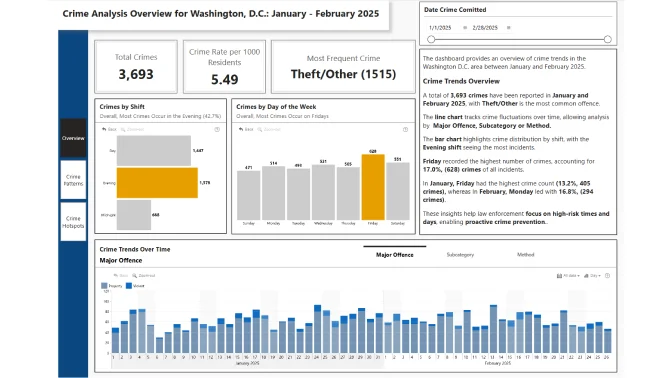
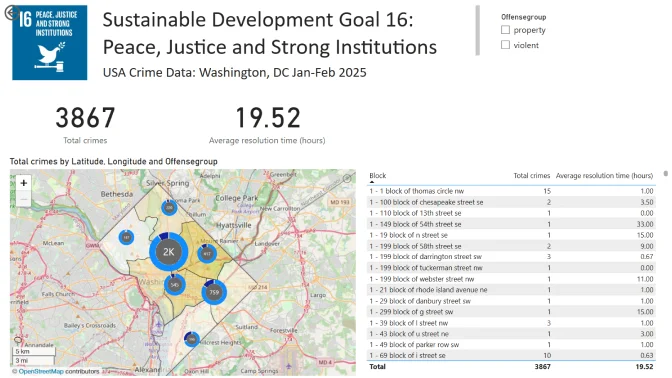
Explore key insights from Washington, D.C.'s crime data, uncovering patterns, hotspots, and trends in reported incidents.
Workshop | Workshop: Practical Tips for Visualizing Crime Data
Workshop | Workshop: Practical Tips for Visualizing Crime Data
11 March | 07:00
-
Webinar | Crime Data Analysis: Top 5 Power BI Reports & Expert Insights
Webinar | Crime Data Analysis: Top 5 Power BI Reports & Expert Insights
28 March | 09:00
28 February - 24 March
ZoomCharts Mini Challenge is part of the global DataDNA – Dataset Challenge by Onyx Data, which unites 25K+ data enthusiasts worldwide, ranging from beginners to seasoned professionals, including Microsoft MVPs. Read more about the DataDNA challenge on the Onyx Data website. Join the community on LinkedIn
The ZoomCharts Mini Challenge provides a platform for a growing community to learn how to build PRO reports, aiding business users to explore data quickly and intuitively.
The best report’s creator will receive a $300 Amazon gift card from ZoomCharts. The Top 5 submissions and the winner will be announced on March 28th.
1. Register for the challenge:
2. Build your report in Power BI:
3. Improve your report and learn new skills:
4. Submit your challenge entry:
5. Finalize your participation to compete for the prize:
6. Attend challenge closing webinar to hear the results:
Context for a Data Visualization Challenge
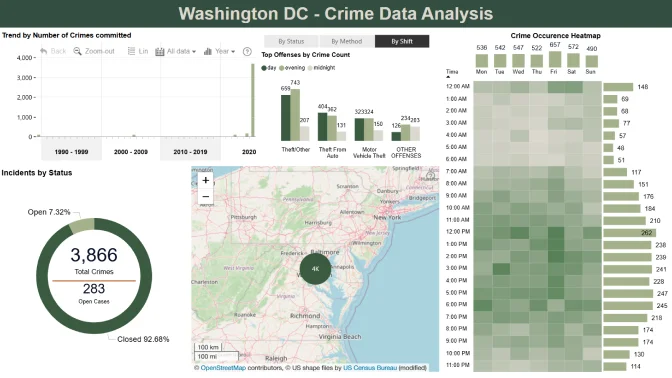
Washington, D.C. has long focused on crime prevention and community safety. This dataset provides detailed insights into crime patterns, allowing analysts to explore crime frequency, geographical hotspots, trends over time, and crime severity. Participants in this challenge will leverage Power BI or other BI tools to visualize crime trends and derive actionable insights for law enforcement, policymakers, and the general public.
Your challenge is to create an interactive dashboard that helps answer key questions such as:
Suggested Key Performance Indicators (KPIs)
To make sense of the data, participants should consider the following KPIs:
Data Dictionary
The dataset contains records of crimes reported in Washington, D.C., including details such as the time, location, offense type, and method. Below are the key fields and their descriptions:
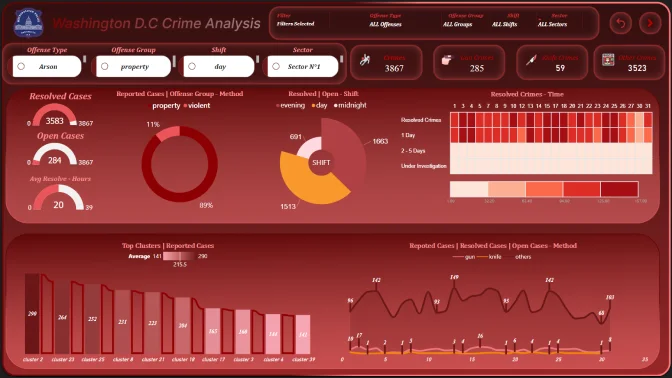
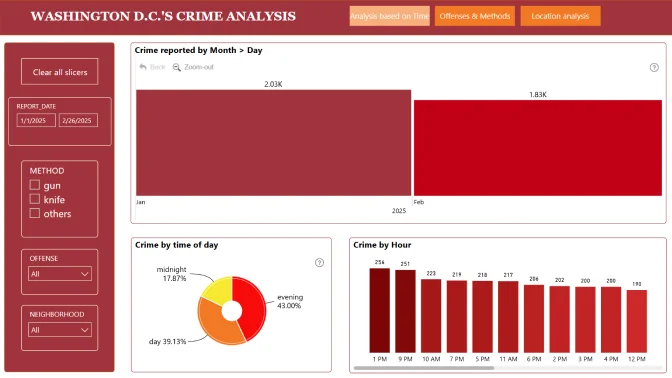
SHIFT - Time of day when the crime occurred (Midnight, Day, Evening).
BLOCK - Street block where the incident was reported.
LONGITUDE - Longitude coordinate of the crime location.
LATITUDE - Latitude coordinate of the crime location.
START_DATE - Date and time the crime occurred.
END_DATE - Date and time when the incident was closed or resolved.
NEIGHBORHOOD_CLUSTER - Cluster ID representing the neighbourhood where the crime occurred.
PSA - Police Service Area responsible for the location.
SECTOR - Police sector where the crime was reported.
CCN - Case control number assigned to the crime report.
OFFENSEKEY - Categorized crime classification, including major and subcategories.
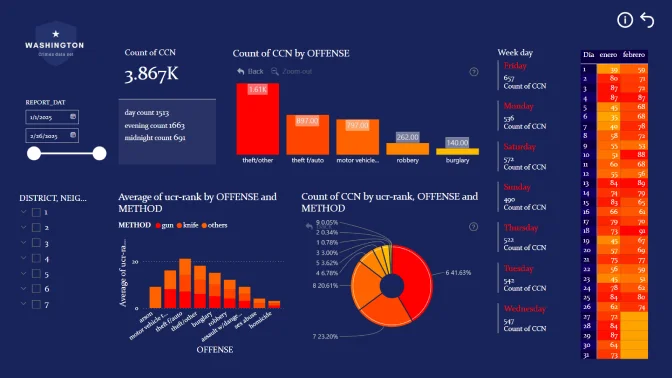
REPORT_DAT - Date when the crime was officially reported.
OCTO_RECORD_ID - Unique identifier for the record in the dataset.
CENSUS_TRACT - Census tract ID where the crime took place.
BLOCK_GROUP - Census block group ID for demographic analysis.
VOTING_PRECINCT - Electoral precinct associated with the location.
METHOD - Method used in the crime (e.g., gun, others).
WARD - City council district where the crime occurred.
BID - Business Improvement District, if applicable.
LOCATION - Geographical coordinates in (latitude, longitude) format.
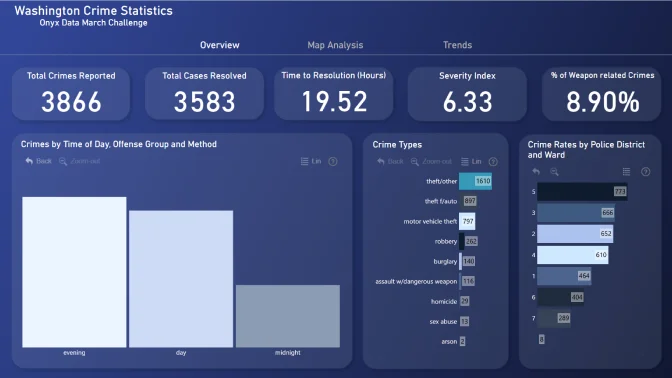
OFFENSE - Type of crime committed (e.g., theft, homicide, robbery).
DISTRICT - Police district overseeing the location.
YEAR - Year the crime occurred.
OFFENSEGROUP - Crime classification (Violent or Property).
ANC - Advisory Neighbourhood Commission ID.
OFFENSE-TEXT - Descriptive text of the crime.
UCR-RANK - Uniform Crime Reporting (UCR) rank, indicating severity.
Each report is evaluated based on three main criteria: intuitiveness, insightfulness, and interactivity. These factors ensure that the reports are not only accurate and functional, but also meet the target audience's needs and are ready to be presented to the end-users.
Workshop | Workshop: Practical Tips for Visualizing Crime Data
Workshop | Workshop: Practical Tips for Visualizing Crime Data
11 March | 07:00
-
Webinar | Crime Data Analysis: Top 5 Power BI Reports & Expert Insights
Webinar | Crime Data Analysis: Top 5 Power BI Reports & Expert Insights
28 March | 09:00
28 February - 24 March