681
Washington DC's Crime Data Analysis
Washington DC's Crime Data Analysis
Report Author: Ismat Tarik
681
Share template with others
Report submitted for Onyx Data DataDNA ZoomCharts Mini Challenge, March 2025. The report is based on the Crime Analysis Dataset and includes ZoomCharts custom Drill Down PRO visuals for Power BI.
Author's Description
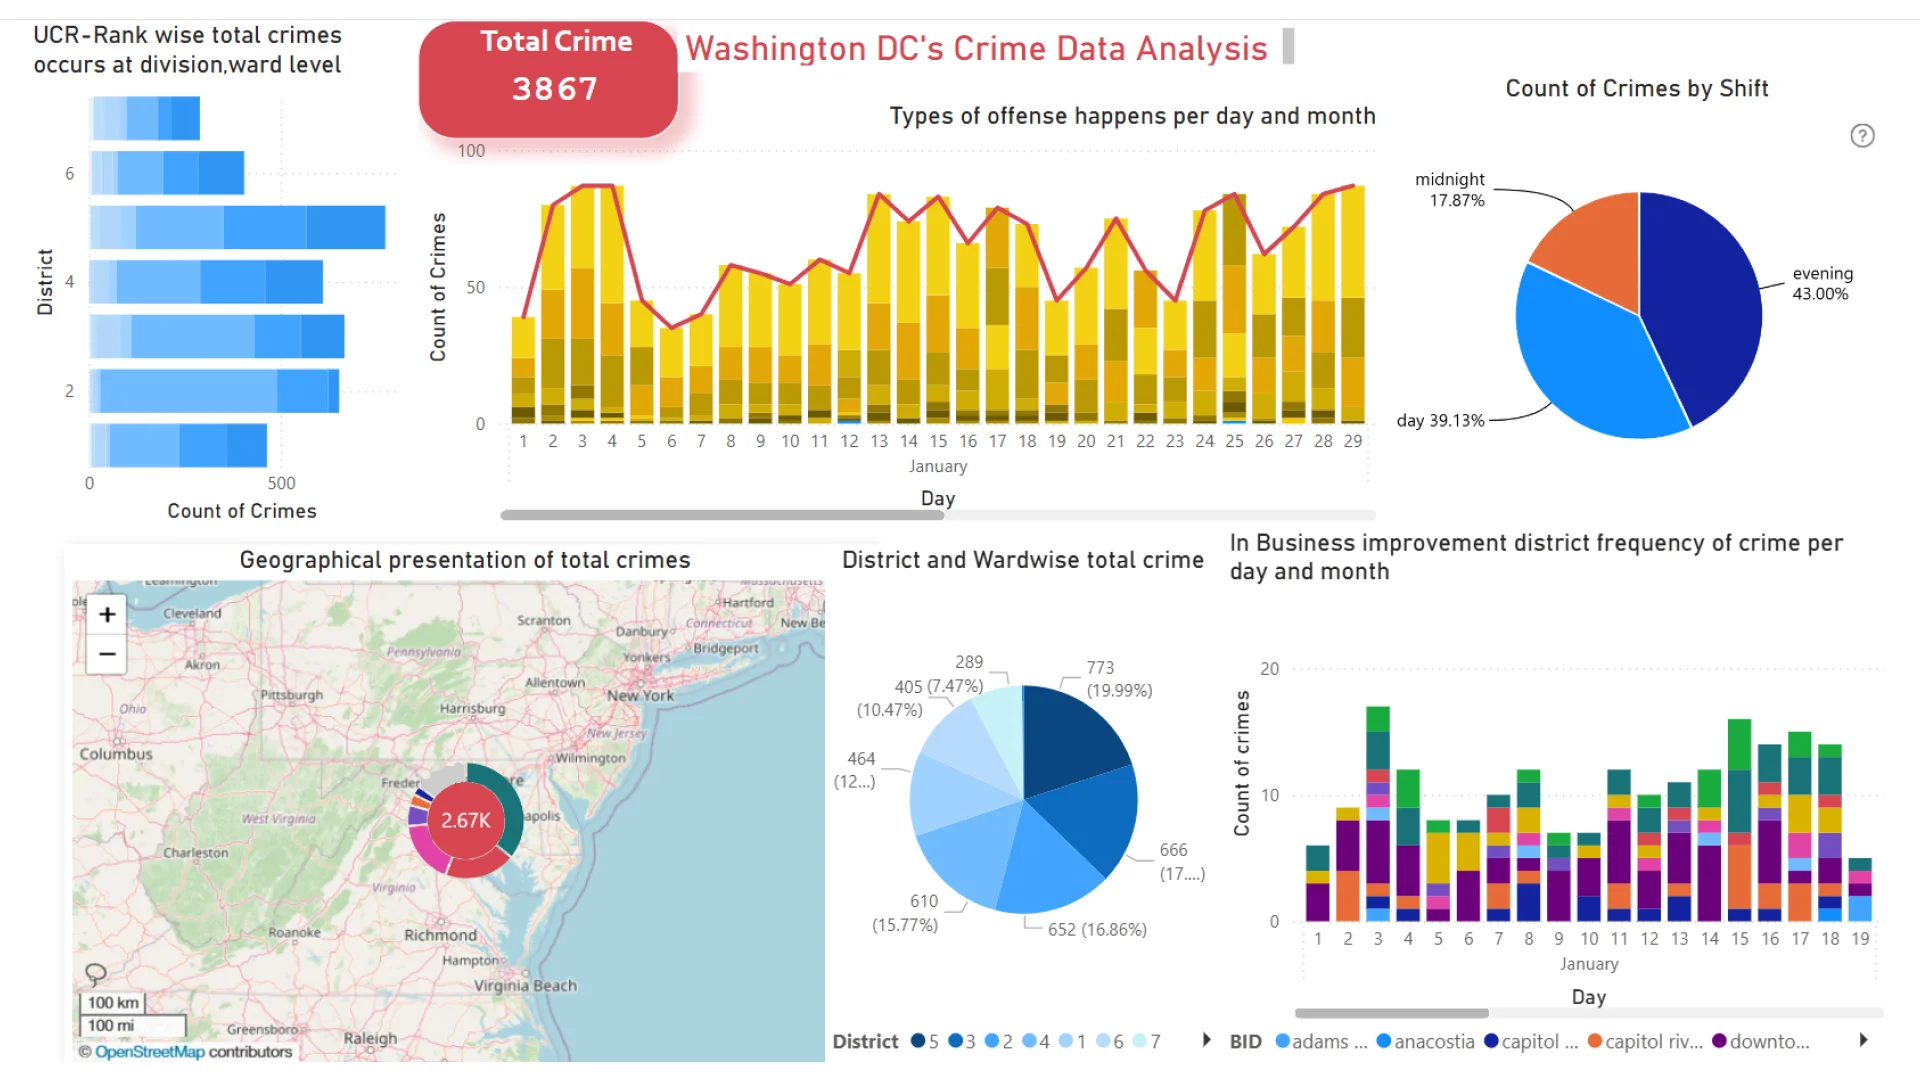
Analyzed Washington's crime data in Power BI and developed a comprehensive dashboard to provide valuable insights. This dashboard highlights crime trends, identifies high-crime areas, analyzes the types of offenses occurring per day, and categorizes affected regions based on UCR rankings. Additionally, it visualizes the geographical distribution of crimes to support data-driven decision-making.|
4U Report Challenges
Participate in data challenges, build and submit reports to get free template downloads.
Join CommunityMobile view allows you to interact with the report. To Download the template please switch to desktop view.
Was this helpful? Thank you for your feedback!
Sorry about that.
How can we improve it?