967
Washington DC Crimes Analysis 2025
Washington DC Crimes Analysis 2025
More Report pages
Report Author: Abaid Ullah
967
Share template with others
Report submitted for Onyx Data DataDNA ZoomCharts Mini Challenge, March 2025. The report is based on the Crime Analysis Dataset and includes ZoomCharts custom Drill Down PRO visuals for Power BI.
Authors Description
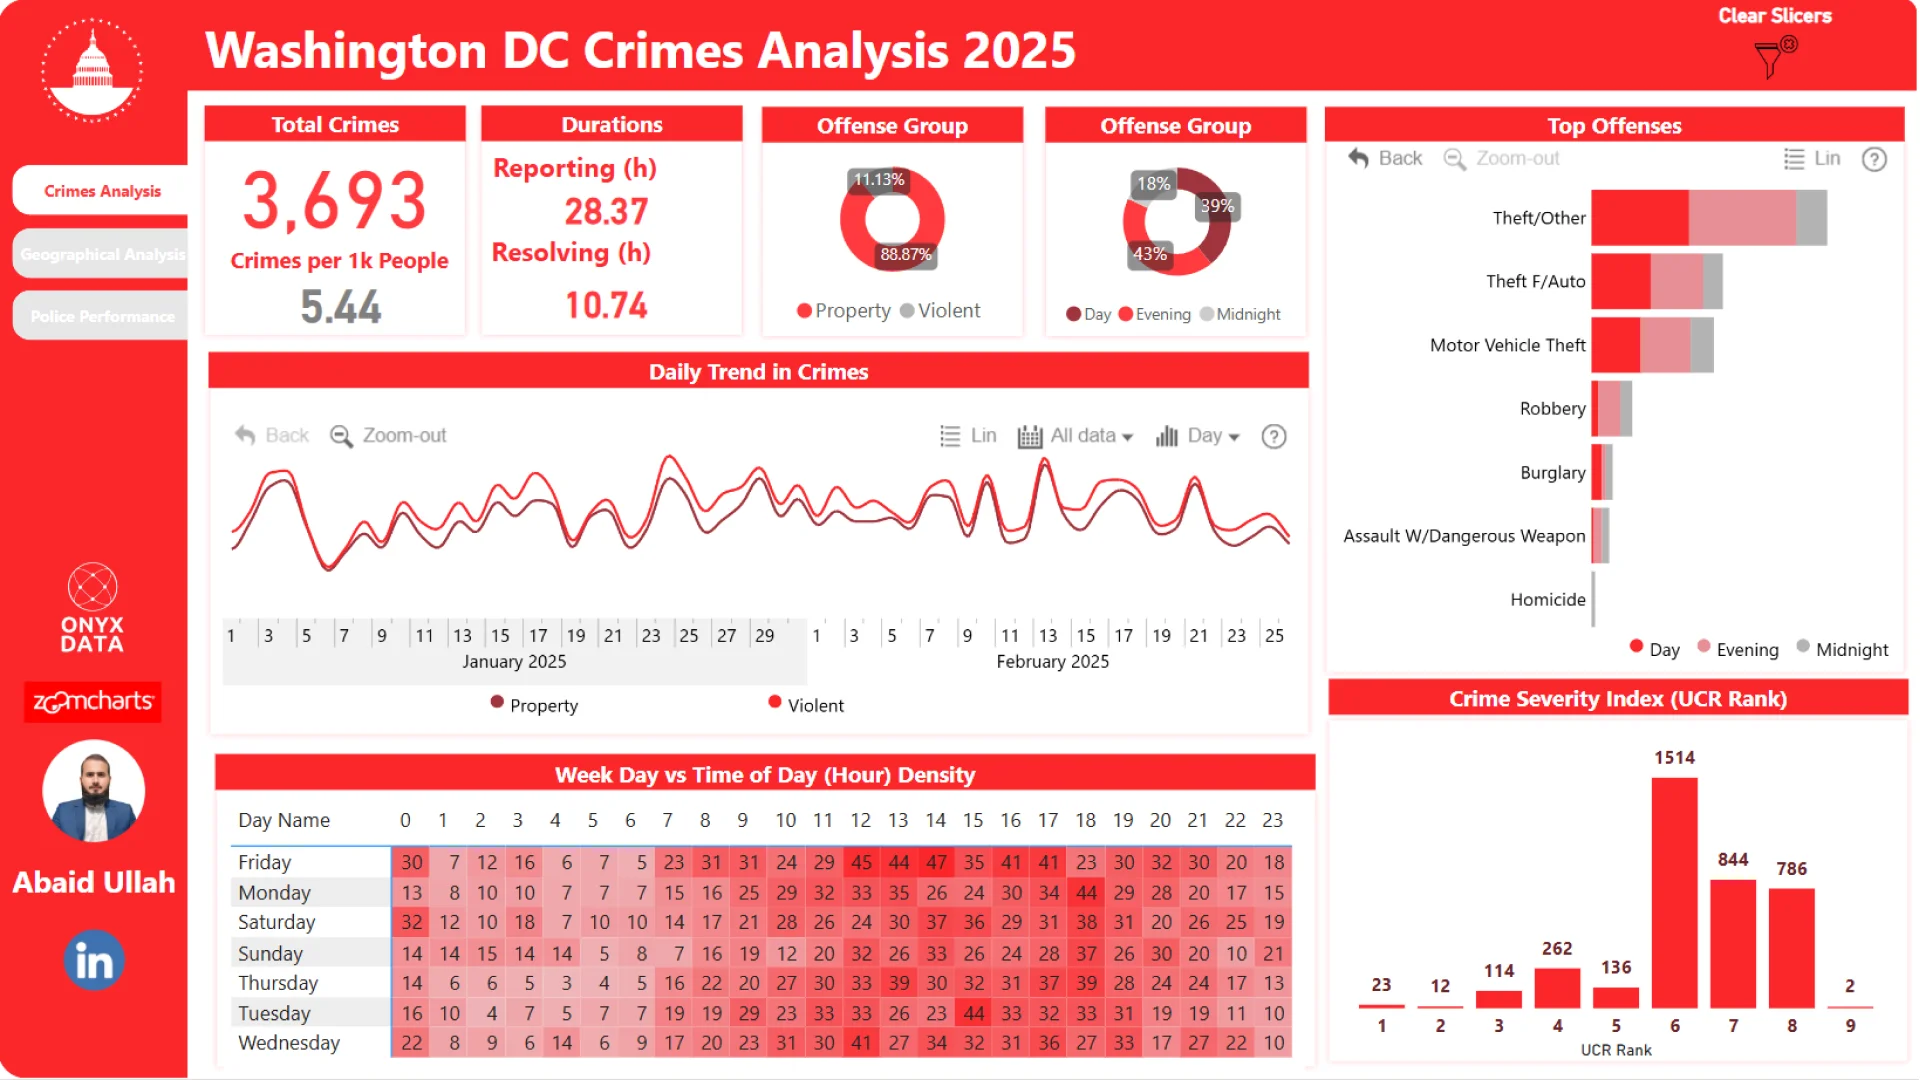
Washington DC Crimes Analytics 2025 I analyzed crime patterns in Washington, D.C., focusing on the first two months of 2025. Using Power BI, I developed an interactive dashboard providing valuable insights for citizens and law enforcement. Here’s how this analysis can make an impact:
🔹 Crime Trends & Timing – Understanding when crimes occur helps citizens stay aware and assists law enforcement in optimizing patrol strategies.
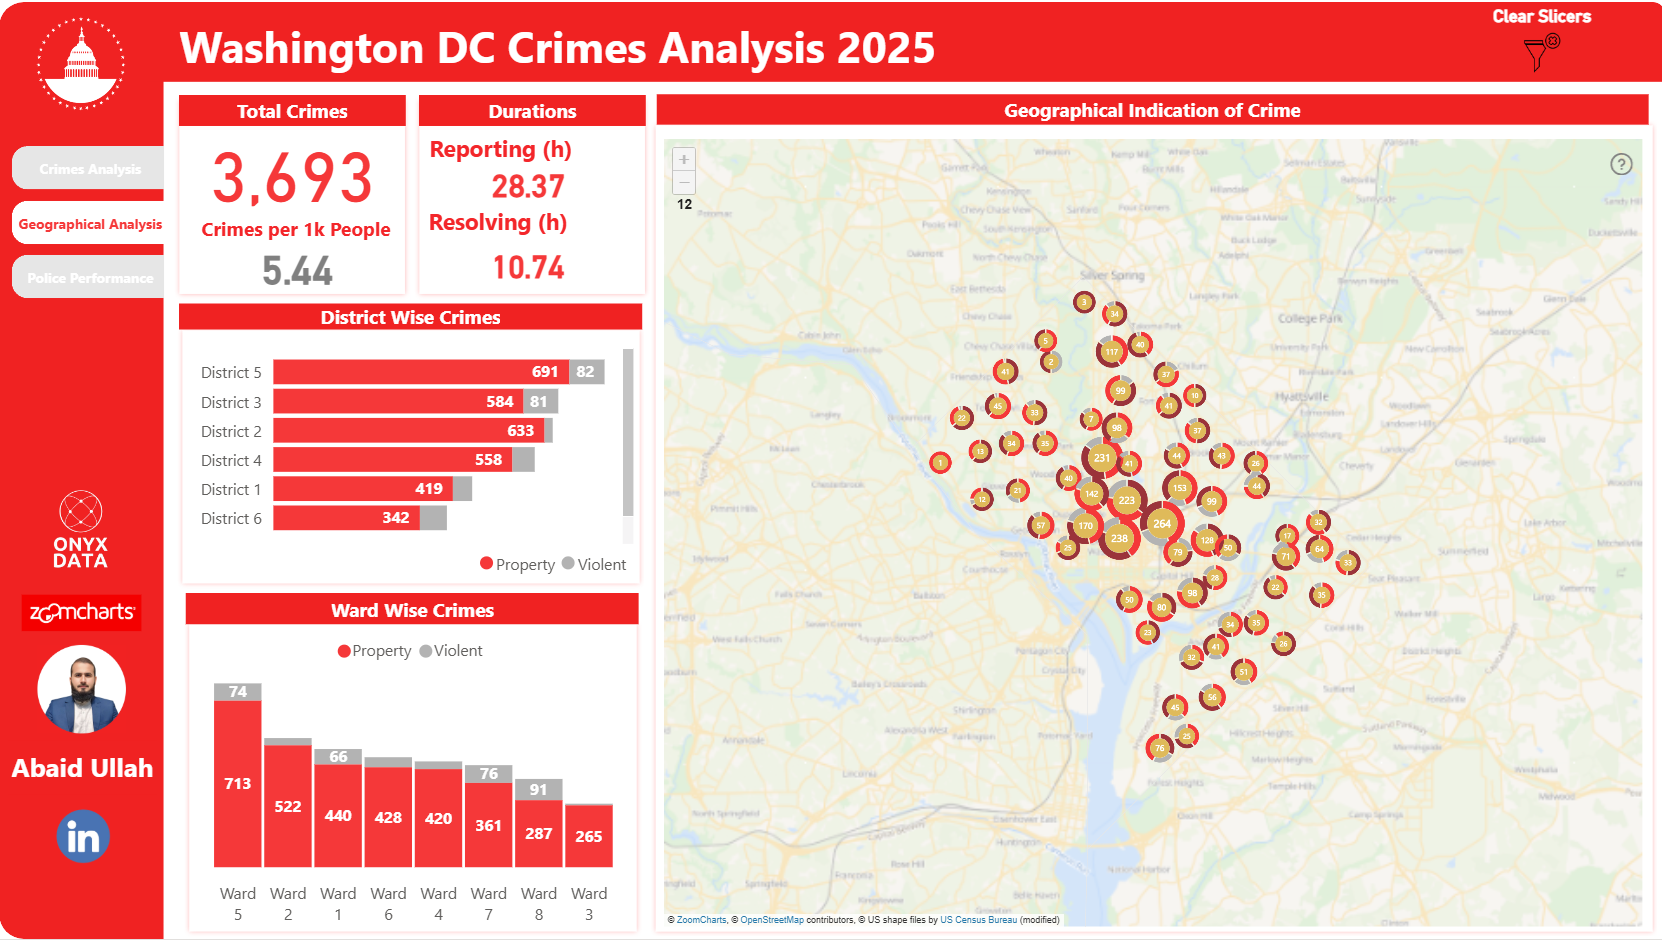
🔹 Geographical Analysis – Identifying high-crime areas enables residents to make informed decisions and helps policymakers implement targeted security measures.
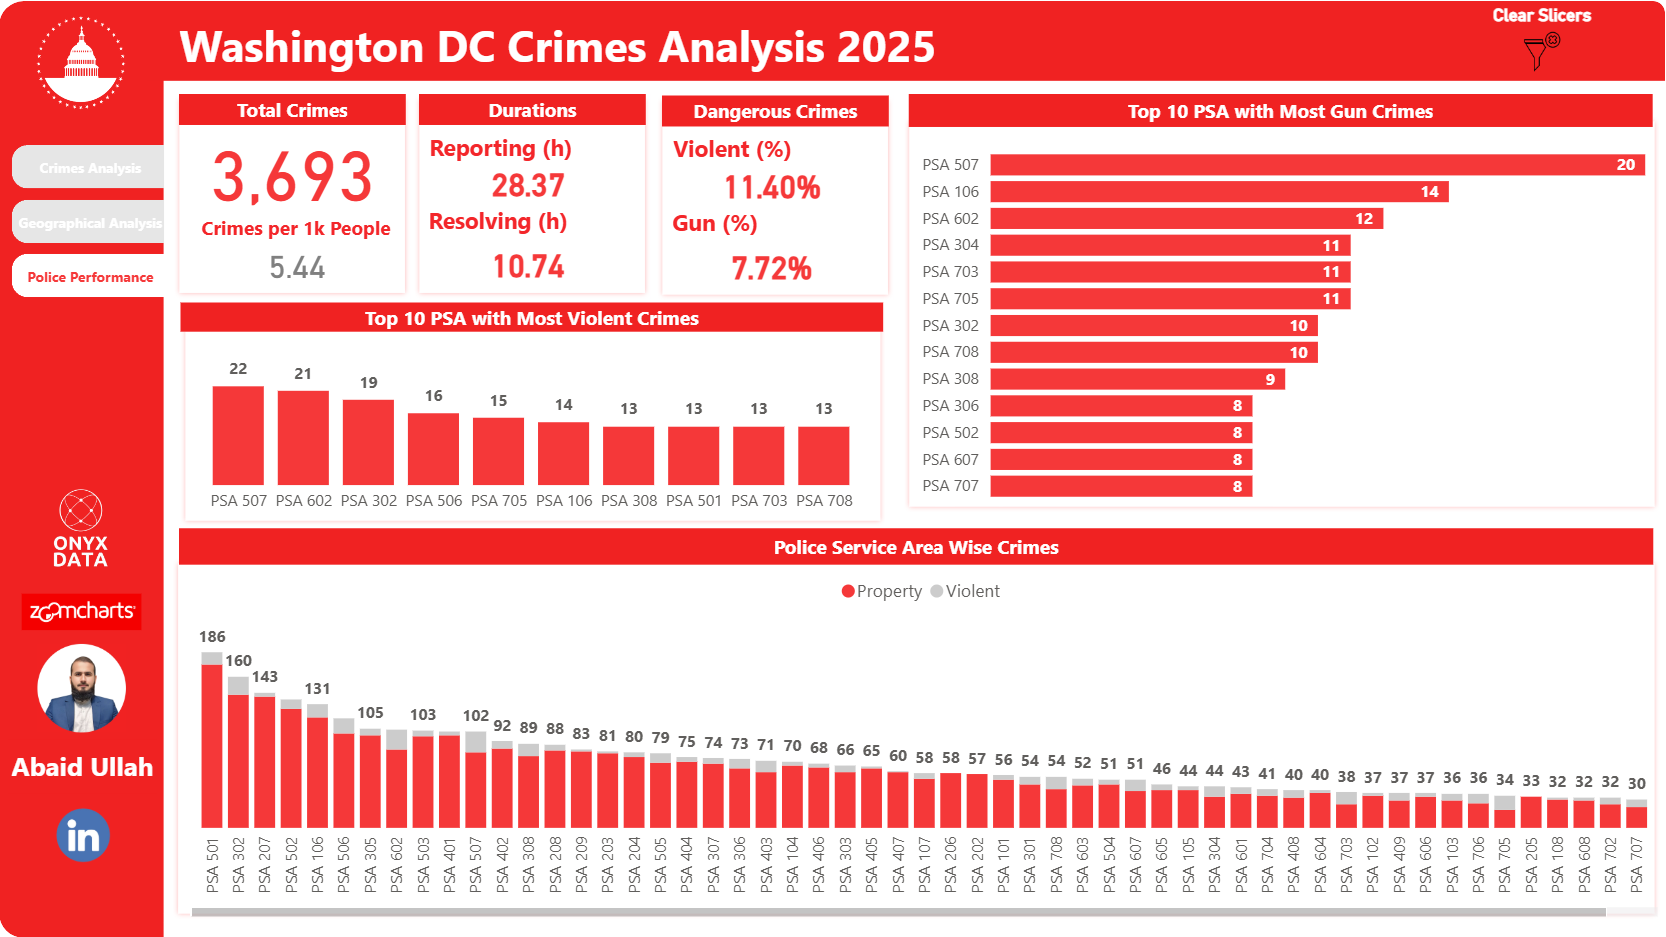
🔹 Police Performance– Tracking reported cases across districts highlights areas needing more resources and enhances law enforcement efficiency. Data-driven decision-making is key to safer communities. This dashboard transforms raw data into actionable insights for better governance, security improvements, and public awareness.



4U Report Challenges
Participate in data challenges, build and submit reports to get free template downloads.
Join CommunityMobile view allows you to interact with the report. To Download the template please switch to desktop view.
How to use a PBIX template
Preview the interactive report, download the PBIX file, open it in Power BI Desktop, and replace the same data connection with your own dataset.
Preview and download
Explore the report online and download the PBIX template file.
Open in Power BI Desktop
Open the downloaded PBIX file in Power BI Desktop.
Connect your data
Replace the sample data source with your own dataset.
Refresh and adjust
Refresh the model and update fields or visual were needed.
Save and share
Save your report and publish it for your audience.


