1275
Crime Analysis Report 10
Crime Analysis Report 10
Report Author: Alexis Gamboa
1275
Share template with others
Report submitted for Onyx Data DataDNA ZoomCharts Mini Challenge, March 2025. The report is based on the Crime Analysis Dataset and includes ZoomCharts custom Drill Down PRO visuals for Power BI.
Authors Description
My Official Entry for the Onyx Data Challenge
📊 Dashboard Overview:
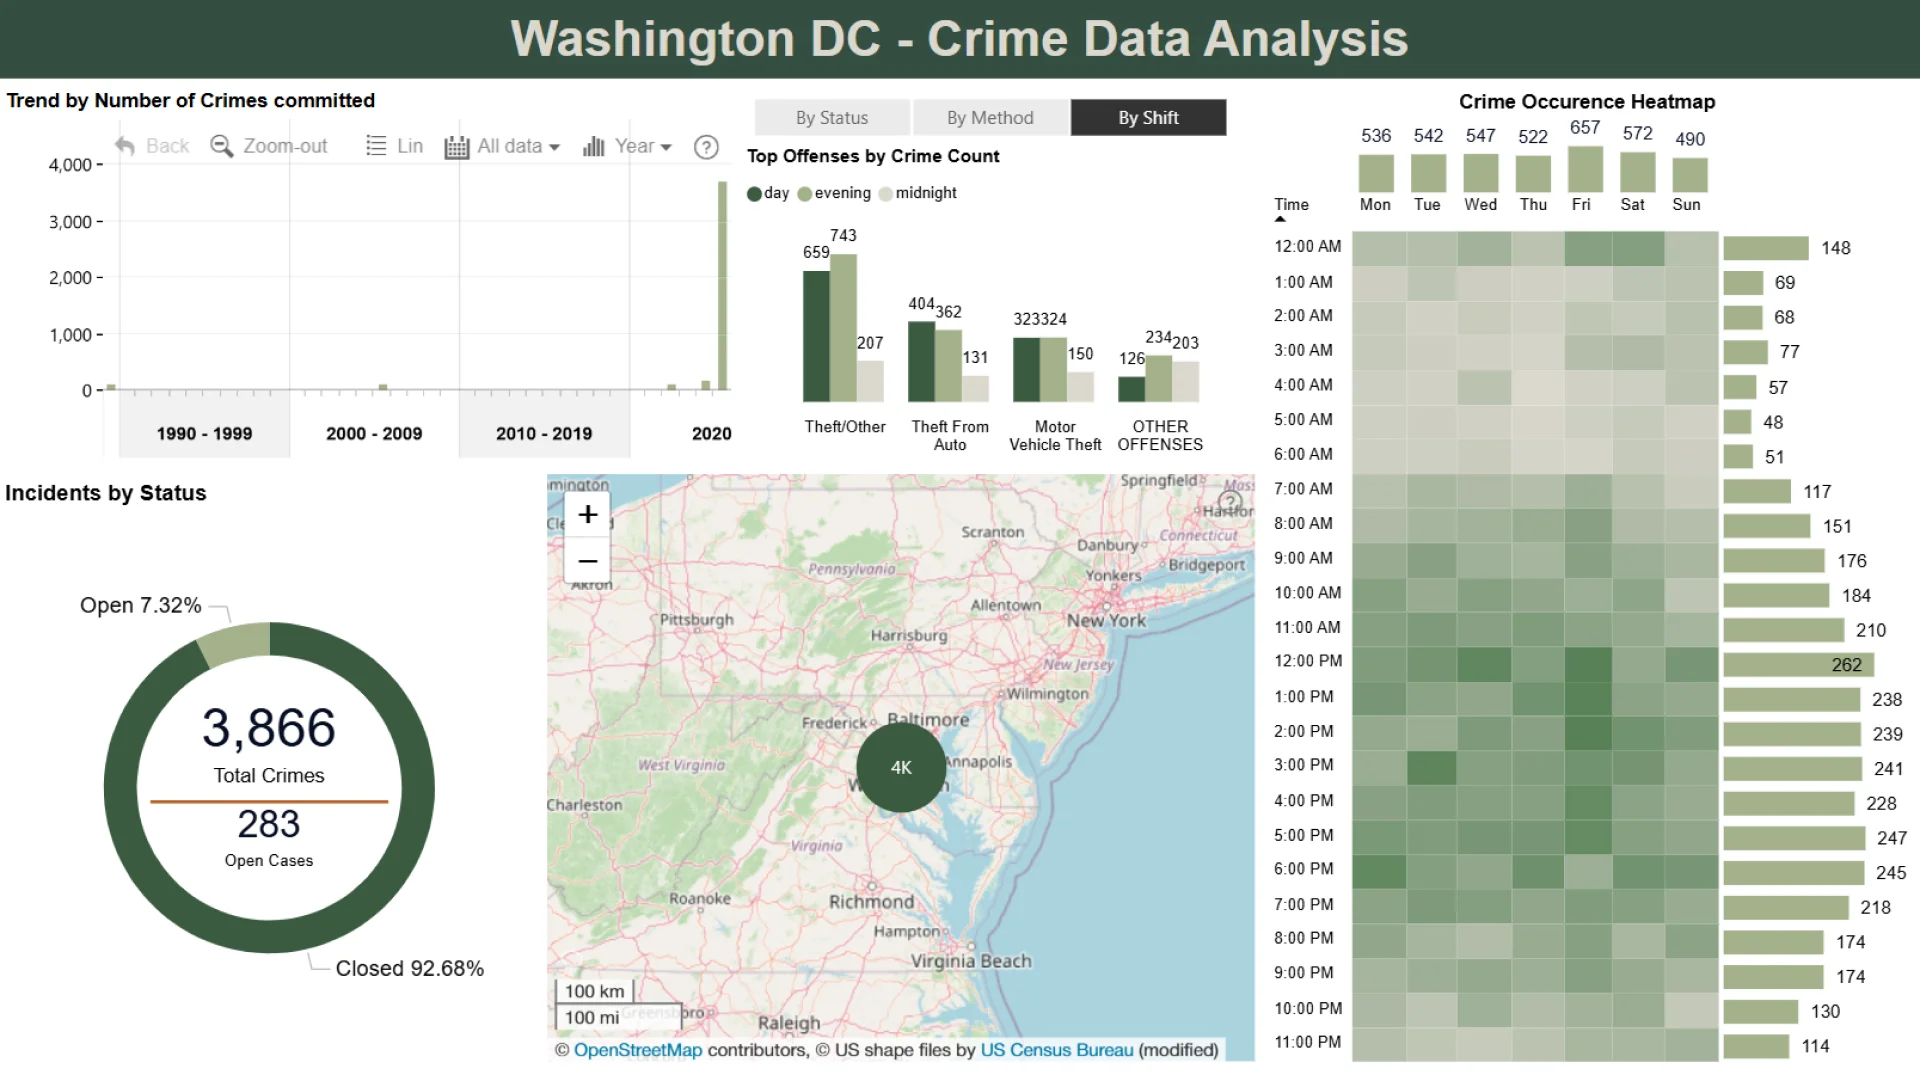
This report visualizes crime rates in Washington, D.C.
🔹 ZoomCharts Used:
1️⃣ Drill Down Time Line PRO (Filter)
2️⃣ Drill Down Map PRO (Filter)
🔹 Native Power BI Visuals:
-
Column & Bar Charts
-
Donut Charts
-
Power BI Cards
-
Matrix Visual (for the heatmap)
💡 Thought Process:
Since the primary stakeholders of this dashboard are not specified (whether general public or police officers), I designed it with Washington, D.C. citizens in mind. The goal is to provide insights into:
✔️ Where crimes occur most frequently
✔️ When crimes are most likely to happen
✔️ The types of crimes committed
This way, residents can stay informed and aware of crime patterns in their area.


4U Report Challenges
Participate in data challenges, build and submit reports to get free template downloads.
Join CommunityMobile view allows you to interact with the report. To Download the template please switch to desktop view.
How to use a PBIX template
Preview the interactive report, download the PBIX file, open it in Power BI Desktop, and replace the same data connection with your own dataset.
Preview and download
Explore the report online and download the PBIX template file.
Open in Power BI Desktop
Open the downloaded PBIX file in Power BI Desktop.
Connect your data
Replace the sample data source with your own dataset.
Refresh and adjust
Refresh the model and update fields or visual were needed.
Save and share
Save your report and publish it for your audience.


