936
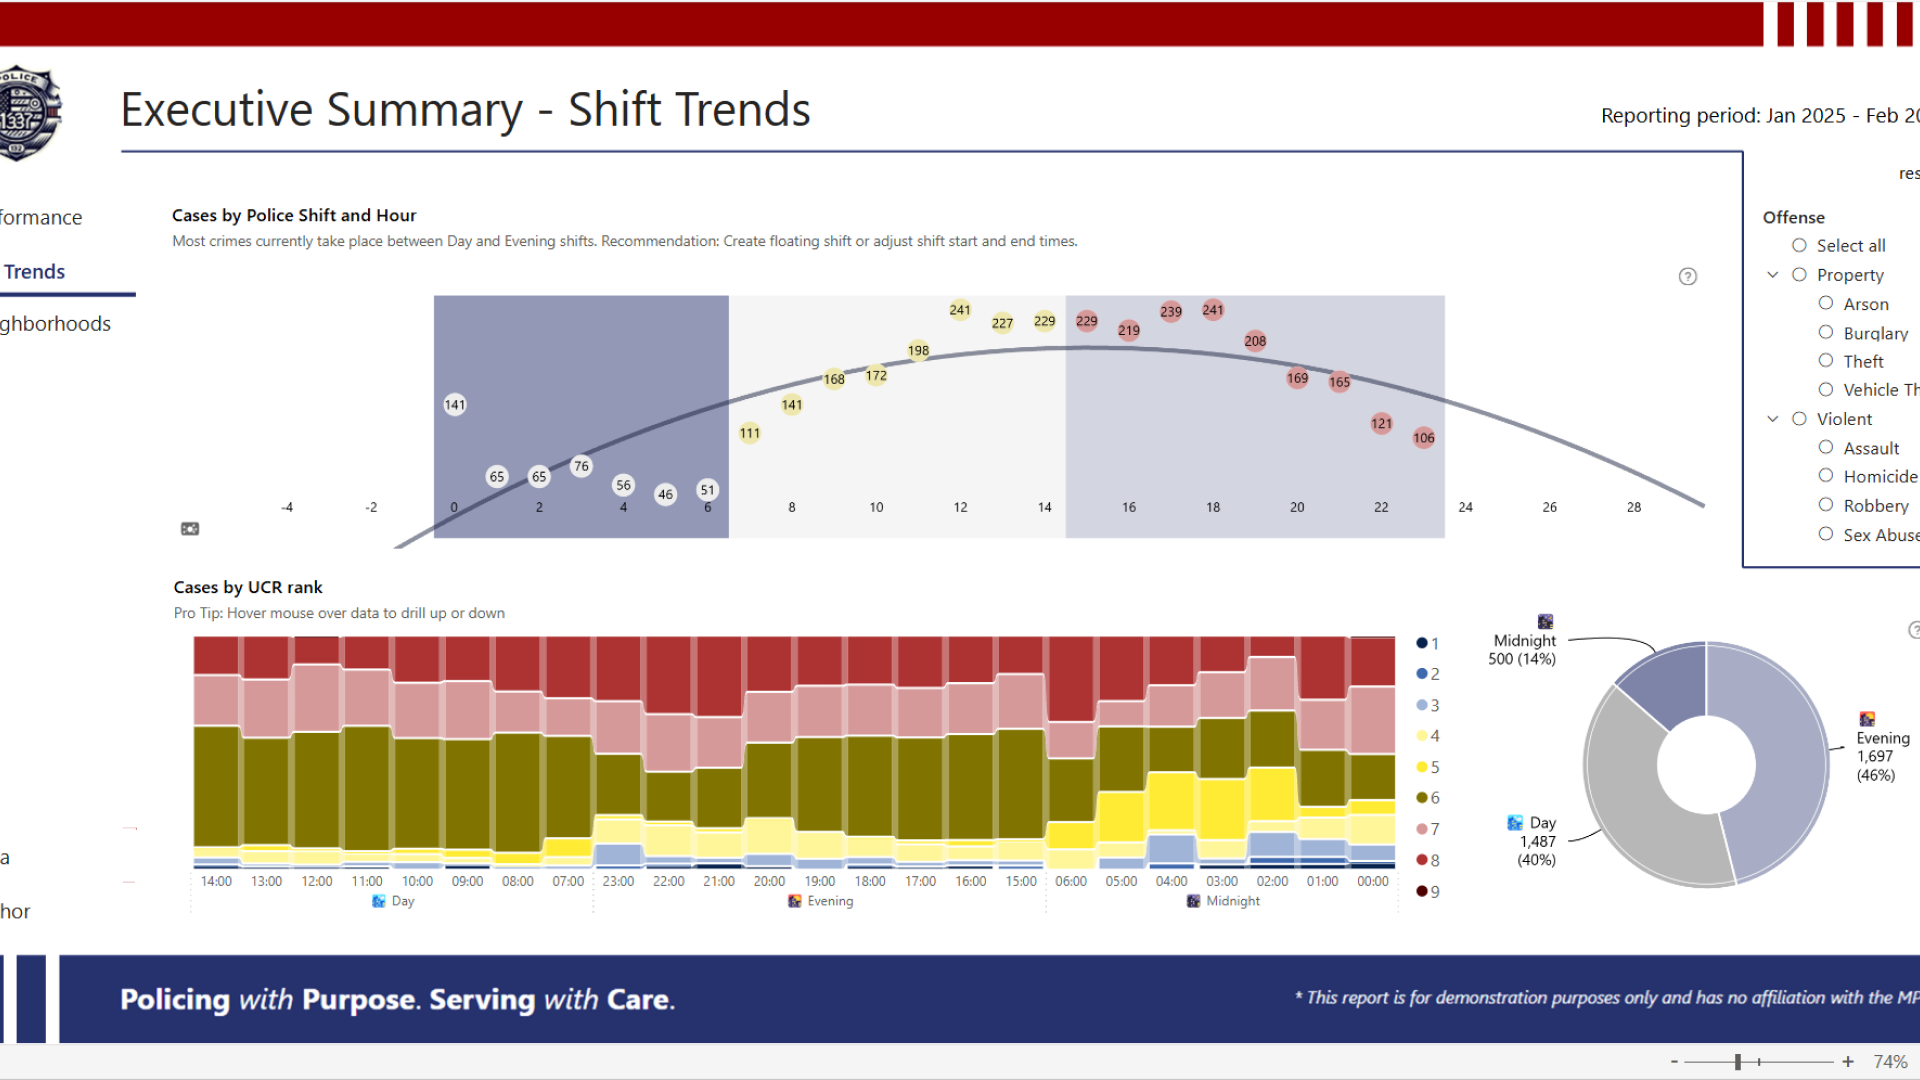
MPDC Executive Summary
MPDC Executive Summary
Report Author: Jeremy Moss
936
Share template with others
Report submitted for Onyx Data DataDNA ZoomCharts Mini Challenge, March 2025. The report is based on the Crime Analysis Dataset and includes ZoomCharts custom Drill Down PRO visuals for Power BI.
Author's Description
I approached this project as if I were working for the MPDC providing analyis and recommendations. The report consists of three main pages: Performance, Shift Trends, and Neighborhoods analysis. I'm new to ZoomCharts, but enjoyed the customizability and visual appeal of the two ZoomCharts visuals I used on the Shift Trends page. I found some interesting insights, particularly how police districts and service areas are divided.


4U Report Challenges
Participate in data challenges, build and submit reports to get free template downloads.
Join CommunityMobile view allows you to interact with the report. To Download the template please switch to desktop view.
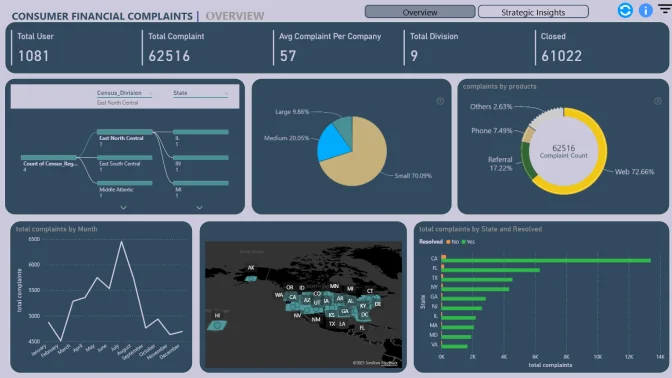
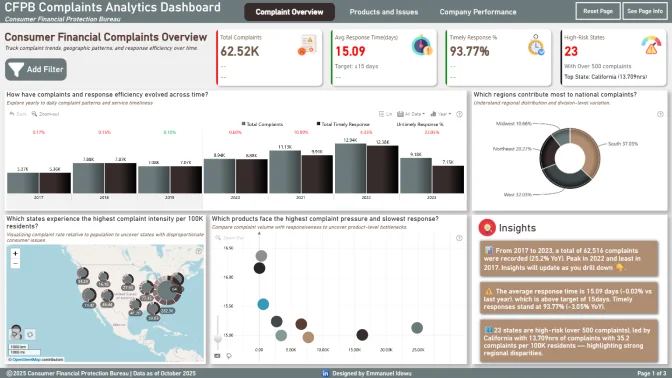
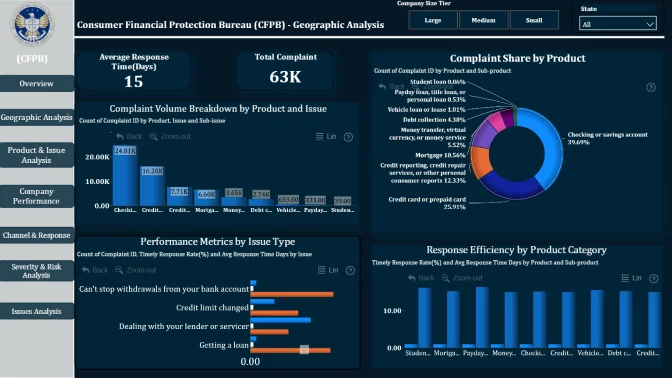
How to use a PBIX template
Preview the interactive report, download the PBIX file, open it in Power BI Desktop, and replace the same data connection with your own dataset.
Preview and download
Explore the report online and download the PBIX template file.
Open in Power BI Desktop
Open the downloaded PBIX file in Power BI Desktop.
Connect your data
Replace the sample data source with your own dataset.
Refresh and adjust
Refresh the model and update fields or visual were needed.
Save and share
Save your report and publish it for your audience.


