1565
Washington Crimes Dashboard
Washington Crimes Dashboard
More Report pages
Report Author: Siddesh Pardeshi
1565
Share template with others
Report submitted for Onyx Data DataDNA ZoomCharts Mini Challenge, March 2025. The report is based on the Crime Analysis Dataset and includes ZoomCharts custom Drill Down PRO visuals for Power BI.
Author's Description
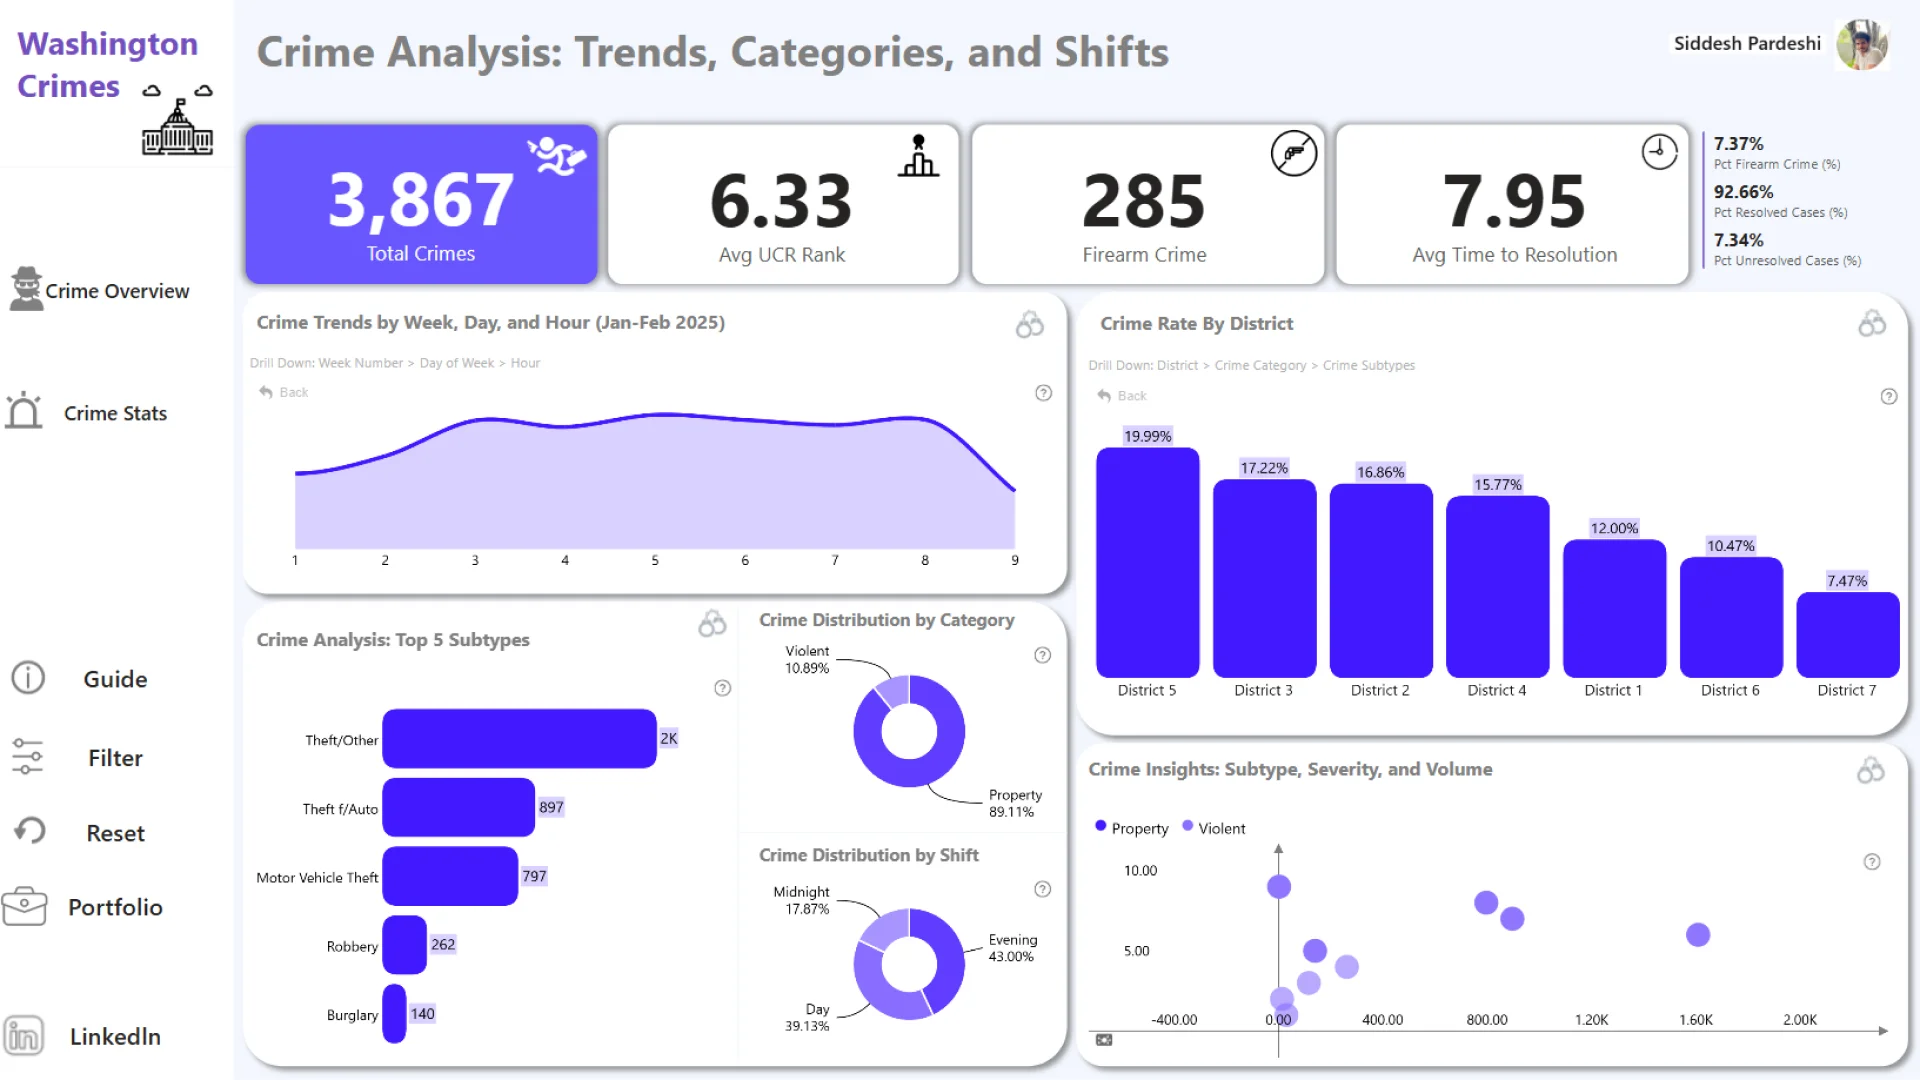
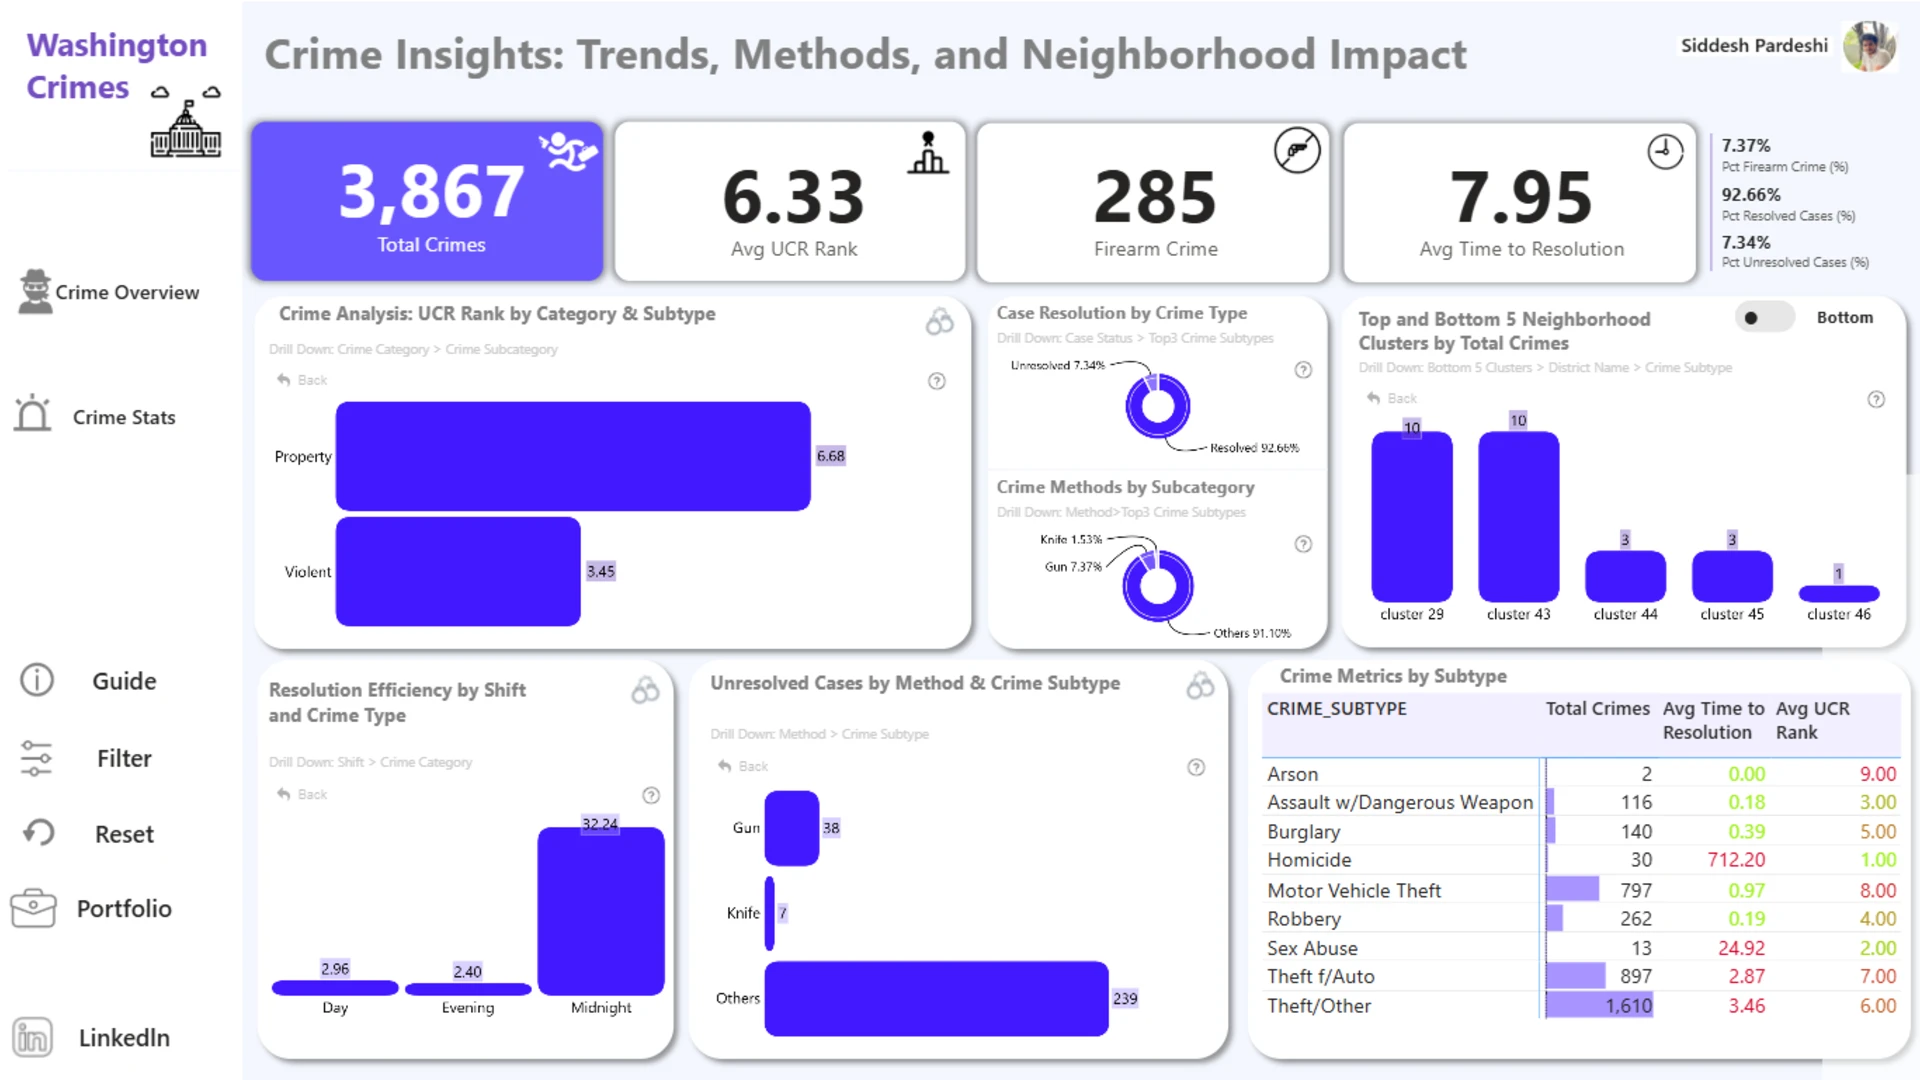
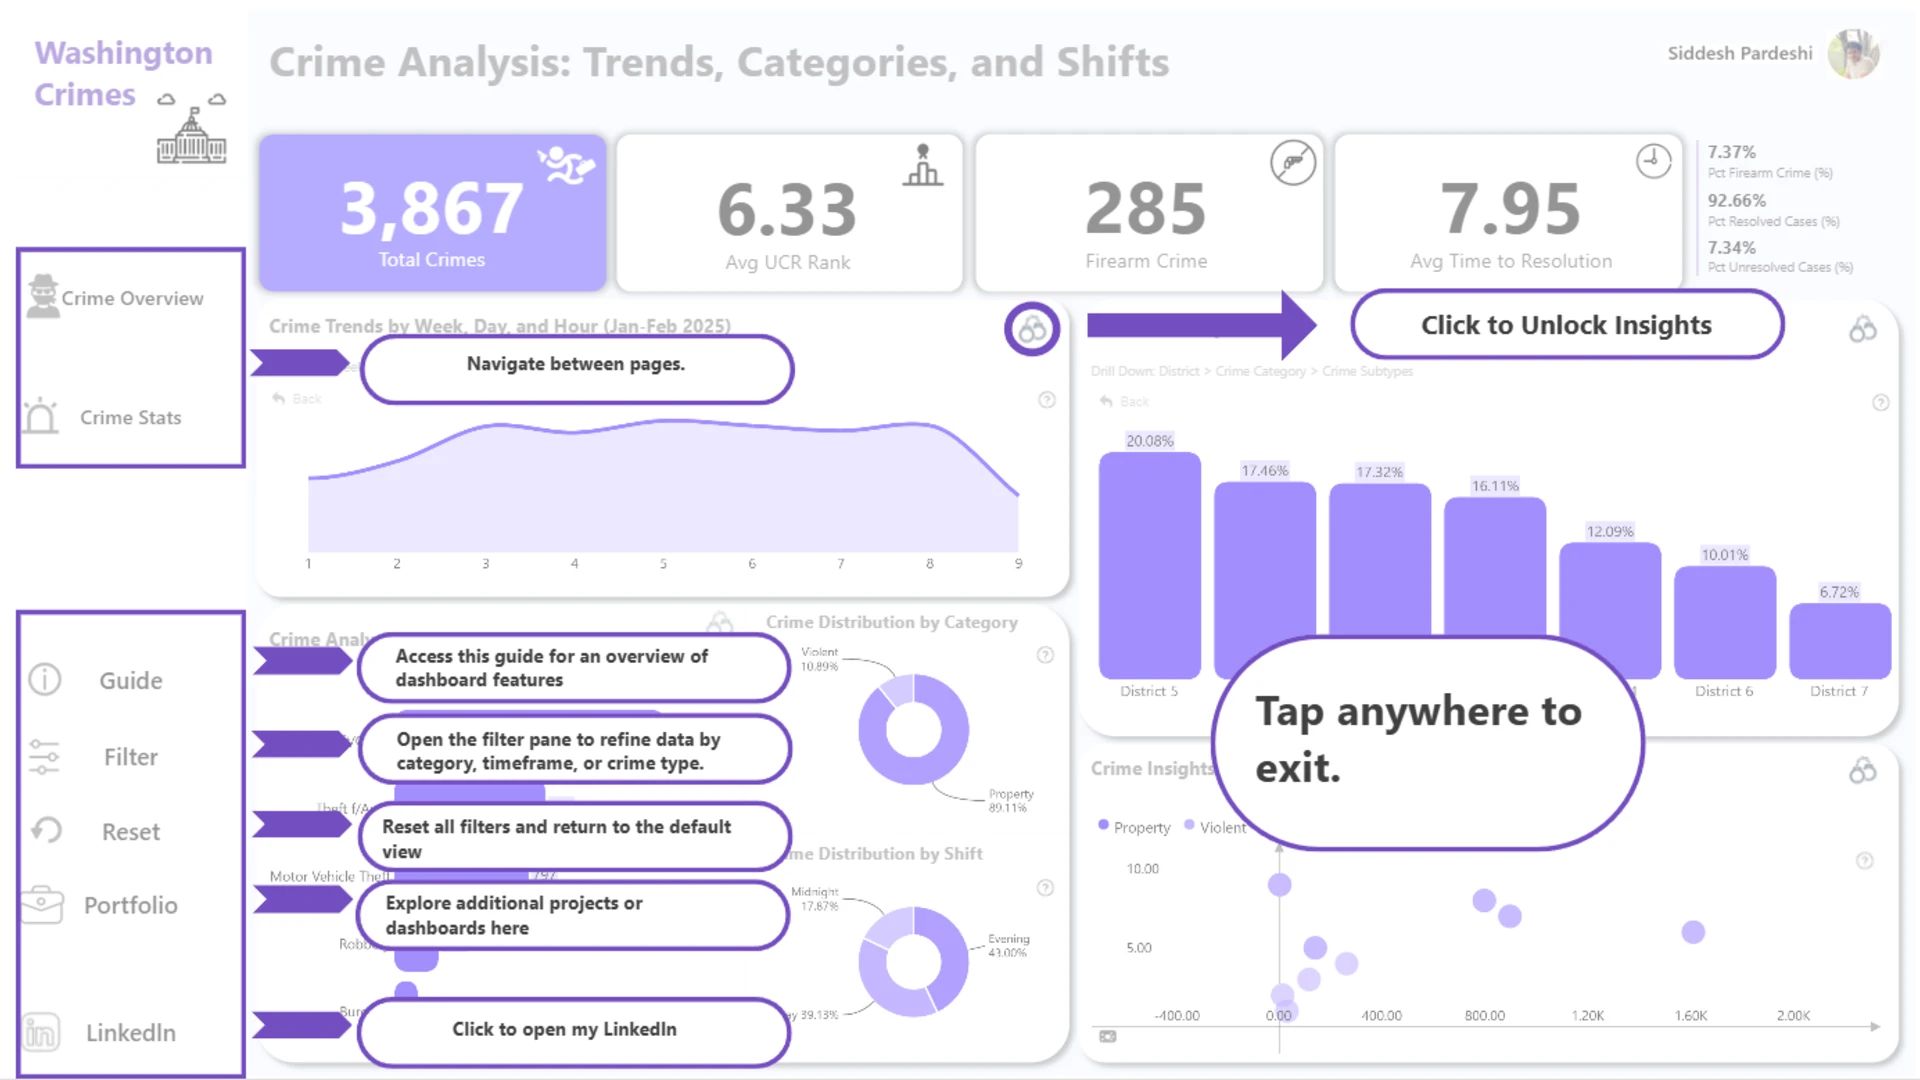
This project uses crime data from Washington, D.C., to create easy-to-understand, interactive dashboards. It helps identify when and where crimes happen most, like theft and assault, and shows that crimes during midnight shifts take much longer to resolve than those during the day or evening. It also points out areas with the most crime and highlights that unresolved cases make up 7.34% of total crimes. These insights help law enforcement and policymakers make better decisions to improve safety and fix problems faster.
ZoomCharts visuals used




4U Report Challenges
Participate in data challenges, build and submit reports to get free template downloads.
Join CommunityMobile view allows you to interact with the report. To Download the template please switch to desktop view.
How to use a PBIX template
Preview the interactive report, download the PBIX file, open it in Power BI Desktop, and replace the same data connection with your own dataset.
Preview and download
Explore the report online and download the PBIX template file.
Open in Power BI Desktop
Open the downloaded PBIX file in Power BI Desktop.
Connect your data
Replace the sample data source with your own dataset.
Refresh and adjust
Refresh the model and update fields or visual were needed.
Save and share
Save your report and publish it for your audience.


