logo
For Power BI
  • Products
    • Drill Down Donut Pro Drill Down Donut PRO
    • Drill Down Pie Pro Drill Down Pie PRO
    • Drill TimeSeries Pro Drill Down TimeSeries PRO
    • Drill Combo Pro Drill Down Combo PRO
    • Drill Map Pro Drill Down Map PRO
    • Drill Scatter Pro Drill Down Scatter PRO
    • Drill Down Network Pro Drill Down Network PRO
    • Drill Down Waterfall Pro Drill Down Waterfall PRO
    • Drill Down Graph Pro Drill Down Graph PRO
    • Drill Down Timeline Pro Drill Down Timeline PRO
    • Drill Down Combo Bar PRO Drill Down Combo Bar PRO

    Video tutorials

    Watch Now

    More than 90 videos on how to enhance Power BI with ZoomCharts

    Learn more
    All visuals
  • Resources

      Resources

    • Documentation
    • Report Examples
    • Blog
    • Webinars
    • Video Tutorials
    • Visuals Gallery

    Support

    • ZoomCharts Assistance
    • Contact Sales
    • Contact Support
    • FAQ

    Challenges

    Challenges

    Improve your report creation skills by participating in free challenges for report creators.

    Learn more
    Start trial
  • Services
    • Power BI Report Development
    • Custom Visual Development
  • Challenges
  • Pricing
Request a quote Start Free Book a Demo Sign in
Get it now
Go back

Contents

Go back

Share

Logo

Welcome to the FP20 Analytics July 2024 Challenge!

Jun 19 - Jul 24, 2024 | EDT

Time to boost sales! Analyze CRM and sales pipeline data to uncover valuable insights and answer critical business questions. 📈

Timeline

Registration Open

Registration Open

19 June | 21:00

-

Submissions Open

Submissions Open

19 June | 21:00

-

Workshop | Workshop: Exploring CRM and Sales Dataset using Power BI and ZoomCharts

Workshop | Workshop: Exploring CRM and Sales Dataset using Power BI and ZoomCharts

03 July | 11:00

-

1:1 Mentoring Sessions

1:1 Mentoring Sessions

03 July | 11:00

19 June - 18 July

Entry Submission Deadline

Entry Submission Deadline

18 July | 21:00

19 June - 18 July

Webinar | Reviewing Top 5 Reports: CRM and Sales Pipelines

Webinar | Reviewing Top 5 Reports: CRM and Sales Pipelines

25 July | 11:00

19 June - 18 July

Winner Announced

Winner Announced

25 July | 13:00

19 June - 18 July

Dataset

Get the dataset

See past FP20 Analytics challenges

See past challenges

Share the challenge

Submitted Reports
About challenge
How to participate
The Brief
Judging criteria
Timeline
Dataset
Past challenges

Winner of the challenge

Report Card

CRM pipeline Analysis

Author: Balu Chelluri

15

View Report

All Submissions

Report Card

Report by Ekaterina Vorobets

Author: Ekaterina Vorobets

2

View Report
Report Card

CRM Sales Dashboard

Author: Akhilesh Raut

2

View Report
Report Card

CRM and Sales Pipelines Analysis

Author: Iris Mejuto Crego

1

View Report
Report Card

CRM & Sales Pipeline Analysis

Author: Sweety Antoni David

8

View Report
Report Card

CRM and Sales Pipeline Analysis

Author: Eszter Kovacs

0

View Report
Report Card

CRM and Sales Pipeline Analysis

Author: Agbata Dickson Ukolojo

0

View Report
Report Card

CRM and Sales Pipeline Challenge July 2024

Author: Steven Stanford

0

View Report
Report Card

CRM Dashboard

Author: Agata Filawska

1

View Report
Report Card

FP20 Analytics CRM and Sales Pipeline

Author: Toyin Taiwo

0

View Report
Report Card

CRM & Sales Pipeline Analysis

Author: Rigoberto Garcia

0

View Report
Report Card

Sales & CRM Insights Report

Author: Norman Reynaldo Sabillon Castro

3

View Report
Report Card

CRM and Sales Pipeline Analysis

Author: Eniola Adekoya

3

View Report
Report Card

CRM Data Analysis: FP20 Challenge 17 by Lucas Szupszynski

Author: Lucas Szupzsynski

3

View Report
Report Card

CRM & Sales Pipeline Analysis

Author: Andreas Miftakhul Pratama

0

View Report
Report Card

CRM and Sales Analysis

Author: JWALA VARGHESE

0

View Report
Report Card

CRM and Sales Pipeline Analysis

Author: Ugochukwu Nwasuruba

2

View Report
Report Card

FP20: CRM and Sales Pipeline

Author: Bimal Subhasis

0

View Report
Report Card

Report by Zulay Vivas de Arrieta

Author: Zulay Vivas

1

View Report
Report Card

CRM Sales Pipeline Analysis

Author: Magdalena Koszczuk

0

View Report
Report Card

CRM Sales Dahboard

Author: Rifa Kabeer

0

View Report
Report Card

CRM and Sales Pipeline Analysis

Author: Timothy (Oluwapelumi) Adeyemi

0

View Report
Report Card

CRM AND SALES PIPELINE REPORT

Author: Alamutu Kehinde

0

View Report
Report Card

CRM Analisis FP20 C17 Spanish

Author: Adela Reigosa

0

View Report
Report Card

CRM Performance Tracker

Author: Harshvardhan Patil

0

View Report
Report Card

CRM & Sales Pipeline Analysis

Author: Aravind Kontham

0

View Report
Report Card

CRM & Sales Pipelines Analysis

Author: Prosper Onyenkwere

0

View Report
Report Card

FP20 CRM

Author: Ananya B Mishra

0

View Report
Report Card

CRM 2024

Author: Gabriel Jofre

0

View Report
Report Card

CRM Sales Dashboard

Author: Ugochi Ugoala

0

View Report
Report Card

Sales & CRM Pipelines Analysis

Author: Tung Lam Ngo

0

View Report
Report Card

Benjamin Kihuria CRM Analysis Report

Author: Benjamin Kihuria

1

View Report
Report Card

CRM Data Analytics - Sarfani

Author: Alisha Sarfani

0

View Report
Report Card

CRM AND SALES PIPELINES

Author: Brandon Resendiz

0

View Report
Report Card

CRM Dashboard Analytics

Author: Faheedah Bukola Bello

0

View Report
Report Card

FP20 Analytics - Sai Pravallitha Vemireddy

Author: Sai Pravallitha Vemireddy

0

View Report

About FP20 Analytics ZoomCharts Challenge

Want to learn to build PRO reports? With personalized feedback and informative workshops, this is your opportunity to take your report-building skills to the next level, build your professional portfolio, and network with like-minded people.

The ZoomCharts challenge is hosted in partnership with FP20 Analytics – a group that unites passionate and inspiring data enthusiasts, and helps new data analysts improve their skills and build a competitive portfolio. Join in and sharpen your skills together with this open and friendly data community. Read more about the challenges on the FP20 Analytics website. Join the community on LinkedIn.

Participate in FP20 Analytics ZoomCharts Challenge to enrich your skill in creating PRO reports that help business users explore data quickly and intuitively. 

  1. Free License: All participants receive a free ZoomCharts Developer License that gives access to the full Drill Down PRO visuals library. License will remain active for 1 year after the challenge.
  2. Learn from Experienced Professionals: As part of the challenge, we host live workshops on report building and visualizing the challenge’s dataset in Power BI. Challenge participants can also book an individual consultation with an experienced Power BI mentor to ask questions and get personalized tips.
  3. Tailored Feedback: Every challenge submission will receive personalized feedback, giving participants the chance to hone their skills and improve their reports.

Prizes

The best report’s creator will receive a $300 Amazon gift card from ZoomCharts. The ZoomCharts winner will be announced in a special live webinar session on July 25, where we will review the top entries from the challenge. 

Webinar recordings

Recording thumbnail

Workshop: Exploring CRM and Sales Dataset using Power BI and ZoomCharts

Online Workshop: Reviewing CRM and Sales Dataset for the FP20 Analytics and ZoomCharts Challenge 17


Watch the recording
Recording thumbnail

Reviewing Top 5 Reports: CRM and Sales Pipelines

Best FP20 Analytics ZoomCharts Challenge 17 submissions + the winner announcement

Watch the recording

How to participate? 

1. Register for the challenge: 

  • Download the Challenge dataset either on this Challenge page or from FP20 Analytics website. 
  • Register for the FP20 Analytics ZoomCharts Challenge. 
  • Activate your free Drill Down Visuals Developer License for Power BI. Read license setup instructions.
  • Read the challenge brief (see "The Brief" section) for additional info about the dataset and to see what questions your report should answer.  

2. Build your report in Power BI: 

  • Set up an account in Power BI using the assigned license details (if you have participated in ZoomCharts Challenges in the past, you can use the same account you set up before).
  • Use the account to access the full library of custom ZoomCharts Drill Down visuals. 
  • Use the dataset to build a Power BI report including at least 2 ZoomCharts Drill Down Visuals in one report page. 
  • Reports are restricted to a maximum of 2 pages. 

3. Improve your report and learn new skills: 

  • To learn more about applying ZoomCharts visuals in your reports, participate in the challenge workshop. 
  • If you have any questions or need advice, you can book a free individual consultation. 
  • Check out the submissions from past challenges for inspiration. 

4. Submit your challenge entry: 

  • Submit your report in .pbix format for validation. 
  • If your submission doesn’t match the challenge criteria, you will be notified by email indicating the reason. Don't worry if this happens! You can fix the issue and resubmit your report. 
  • Together with validation confirmation, you will receive a publish to web link that you can use to add the report to your portfolio or publicly share online. 
  • All validated entries will receive personalized feedback from the evaluation team. You can use this feedback to revise your report and resubmit it before the deadline. Feel free to resubmit your entry as many times as necessary before the deadline. 

5. Finalize your participation to compete for the ZoomCharts grand prize: 

  • (Optional) Upload your publish to web link on NovyPro.  If you opt to post your report on NovyPro, for instructions on how to do this, refer to the video link provided. NovyPro: https://www.novypro.com/  
    Instruction Video: https://www.youtube.com/watch?v=jkcAYgFGWUY
  • Post the final version of your submission in PDF format on your LinkedIn profile. 
  • Use the caption "I am participating in FP20 Analytics Challenge 17”. 
  • Include a summary of your report's key insights and add the ZoomCharts publish to web link or NovyPro link. 
  • Use the hashtags #FP20Analytics, #FP20CRMandSalesPipeline, #builtwithzoomcharts, tag @Federico Pastor and @Zoomcharts. 
  • Additionally, post your report in the FP20 Analytics LinkedIn Community group. 
  • Follow ZoomCharts on LinkedIn 

6. Attend challenge closing webinar to hear the results: 

  • The submissions are evaluated by ZoomCharts team (see "Judging criteria" for more info). The submissions of Top 5 ZoomCharts Mini Challenge finalists are analyzed live during the challenge closing webinar to share the best practices and learning opportunities with the community. 
  • The author of the best report is awarded with a $300 Amazon gift card.

About the dataset

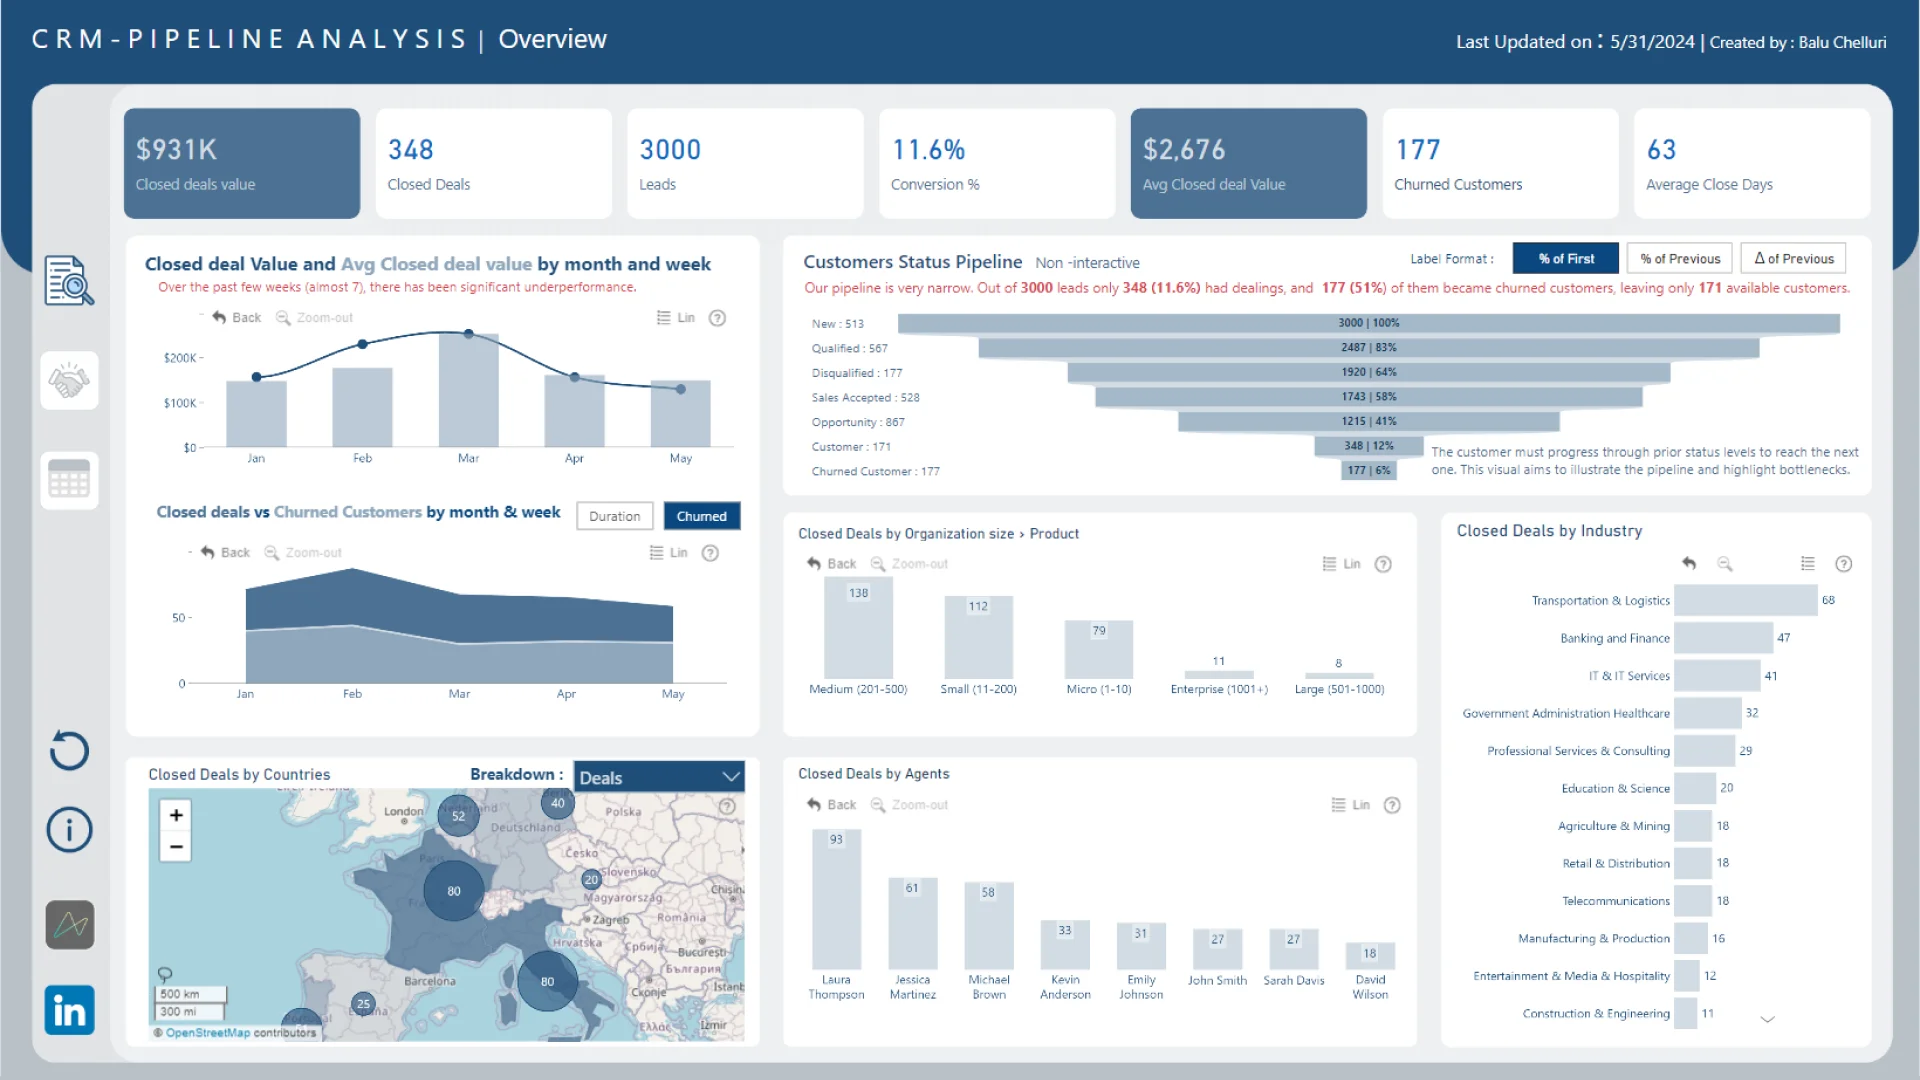
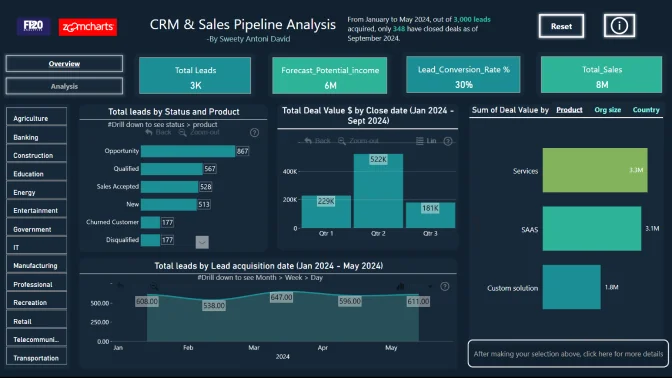
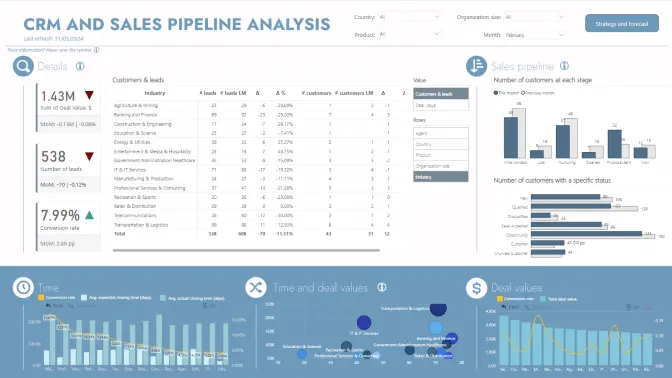
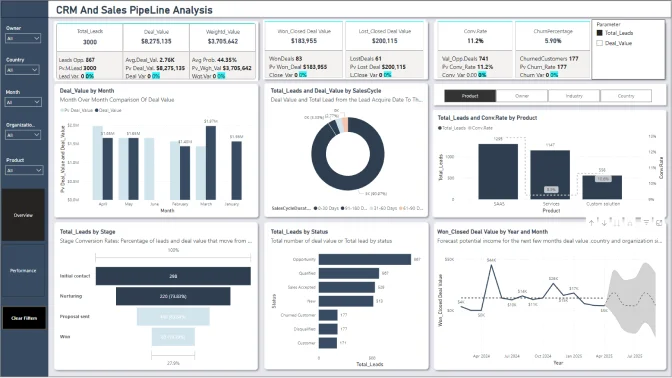
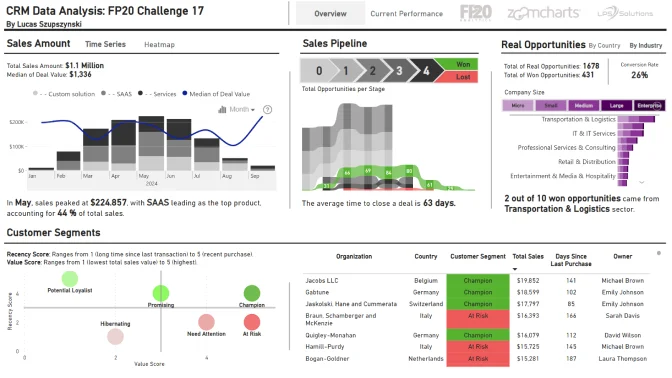
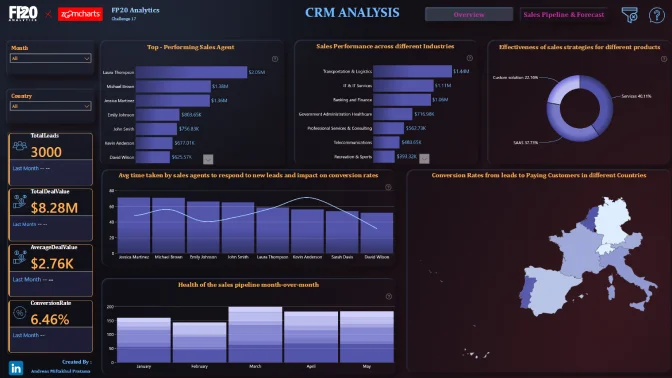
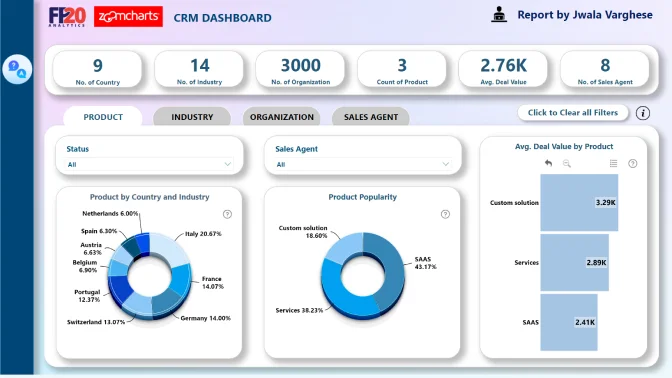
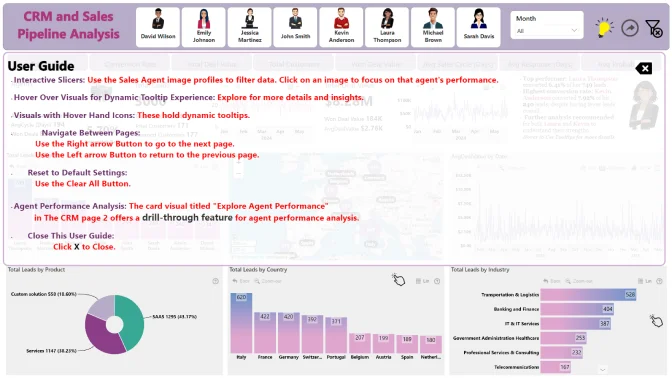
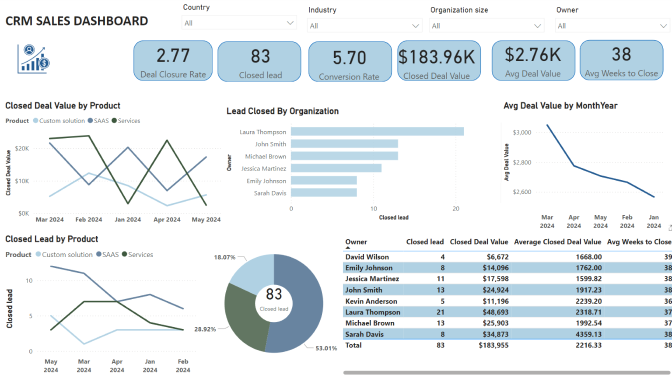
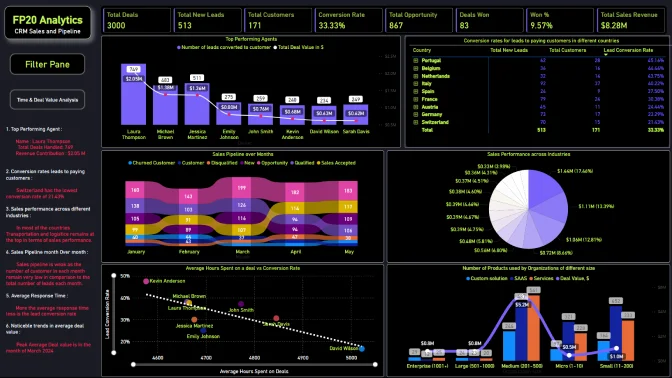
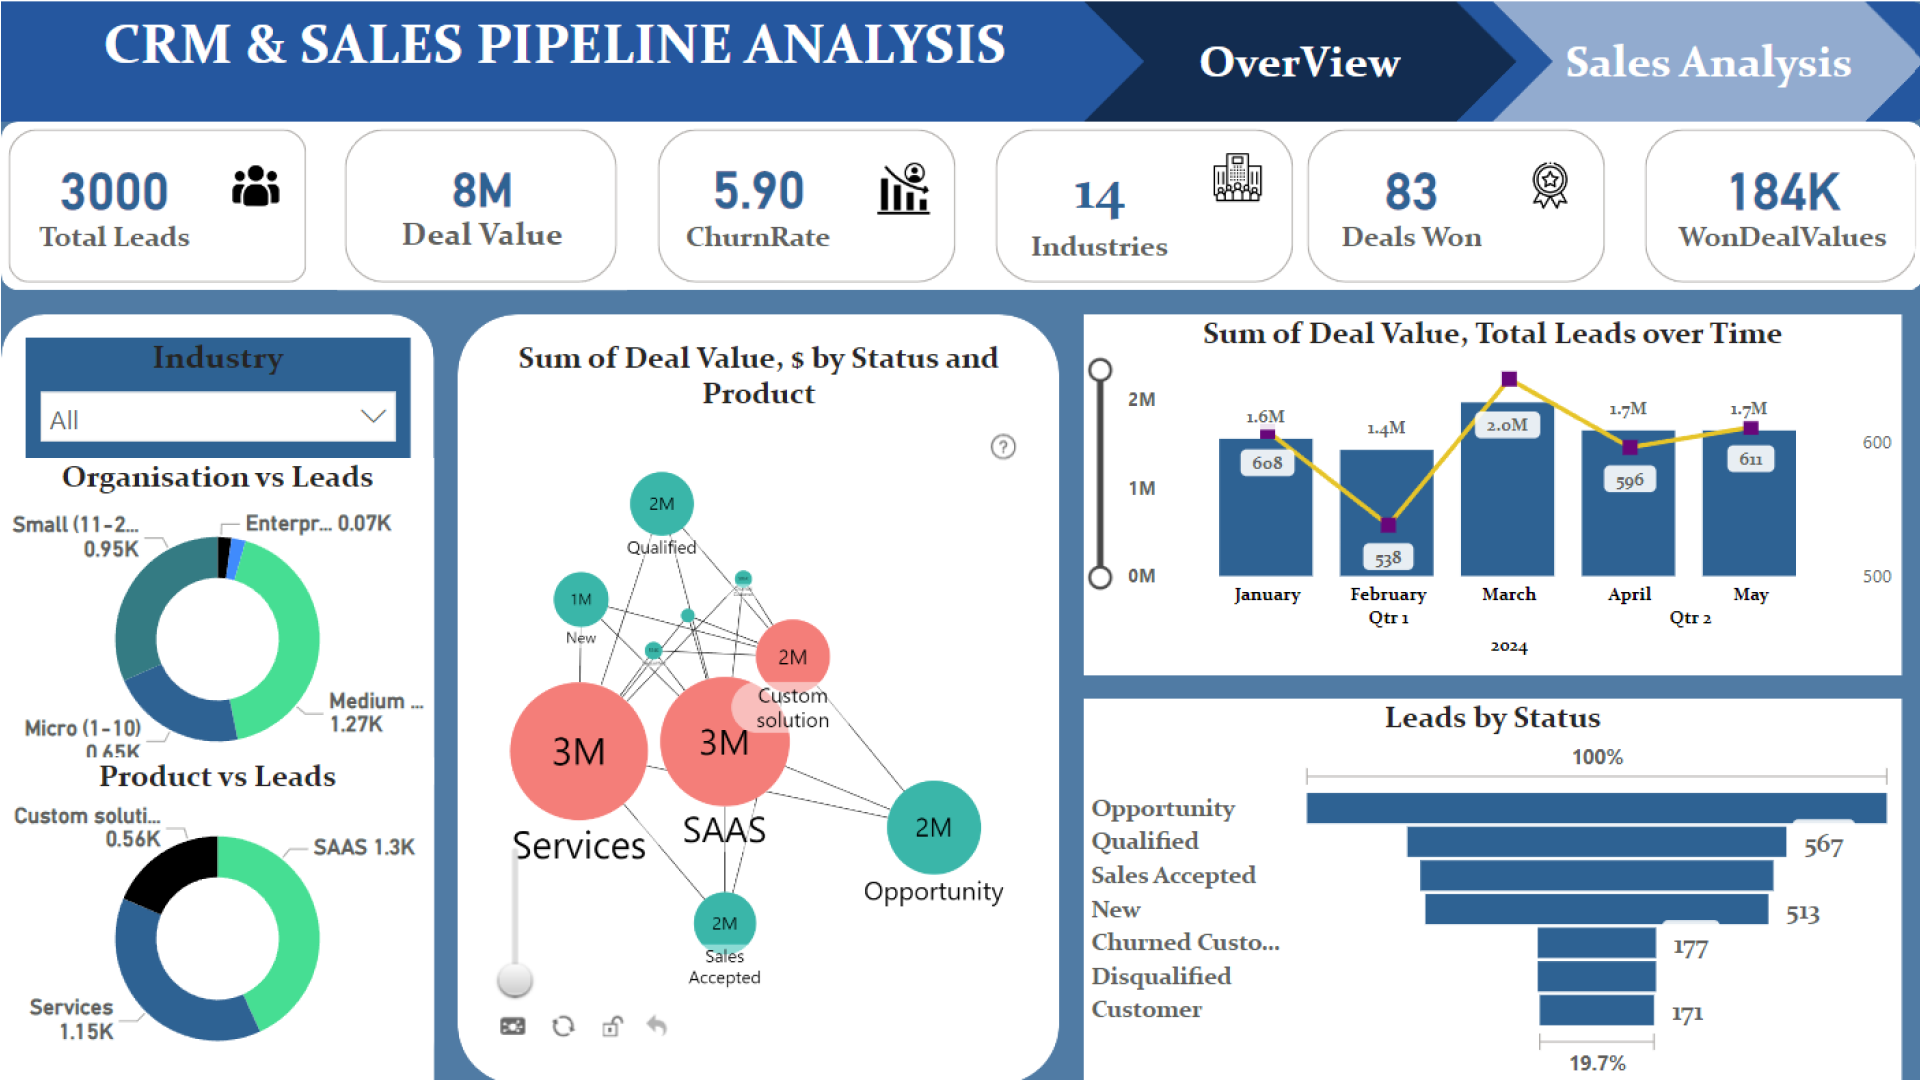
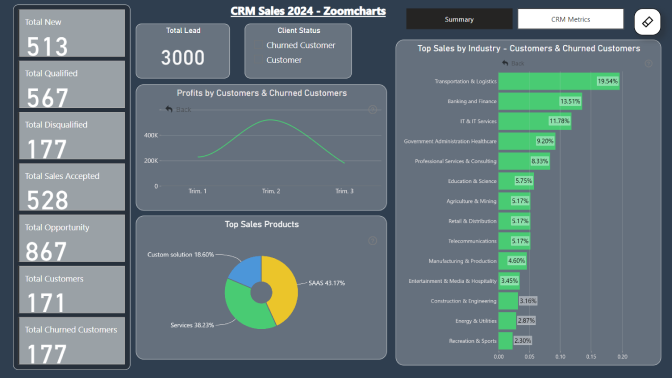
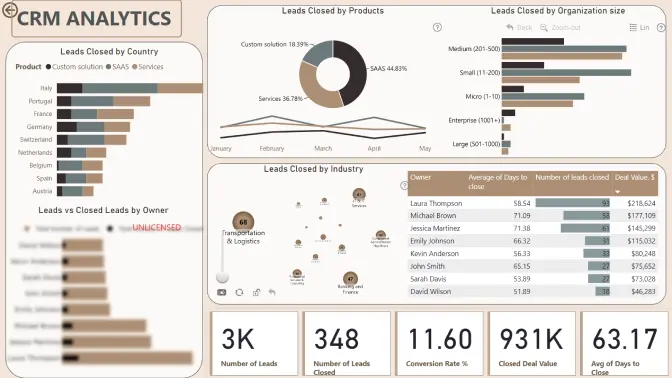
A company aims to evaluate its CRM data and sales pipeline for leads registered over the last five months. The task is to build a comprehensive analytical report that provides insights into lead distribution across countries, industries, and organization sizes. The report will assess the health of the sales pipeline, forecast potential income over the next few months, and compare sales agent performance.

What should your report include?

Create a report that allows end users to easily find answers to the following questions:

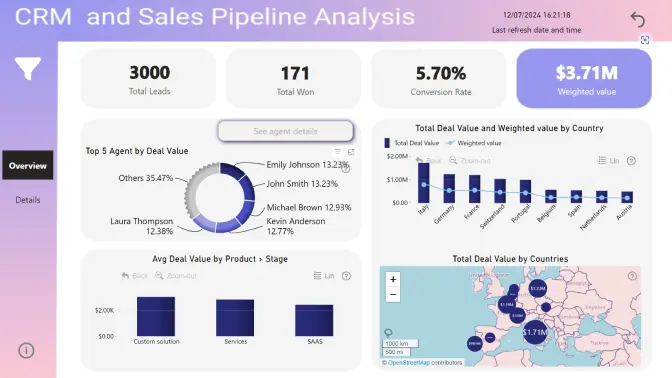
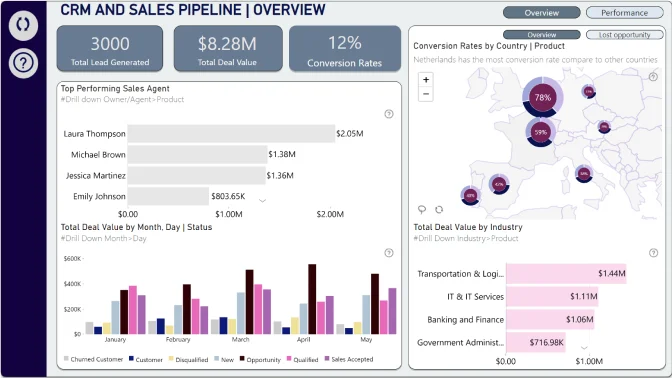
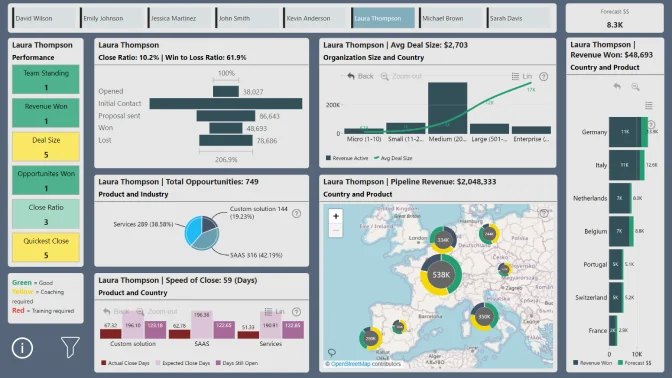
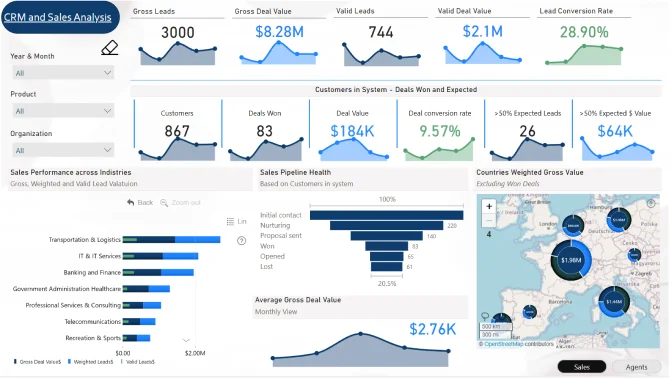
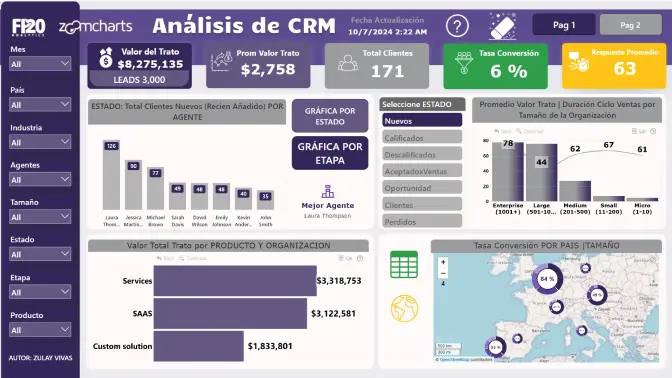
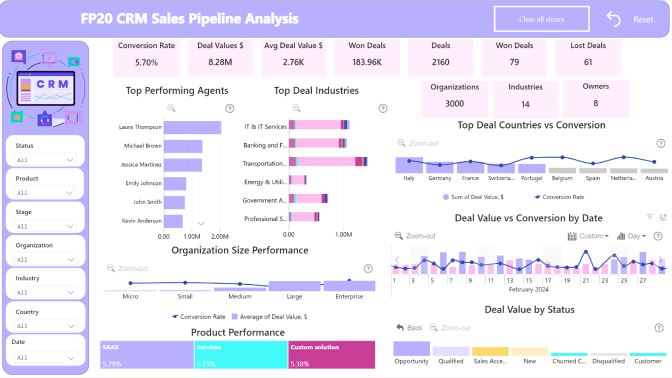
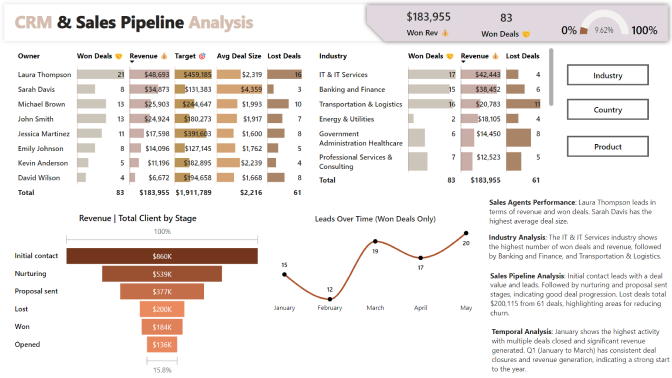
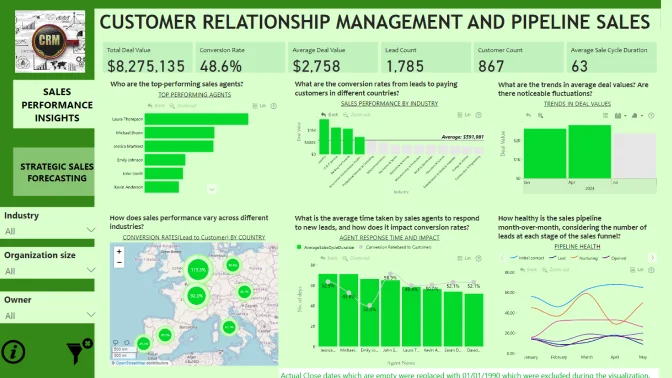
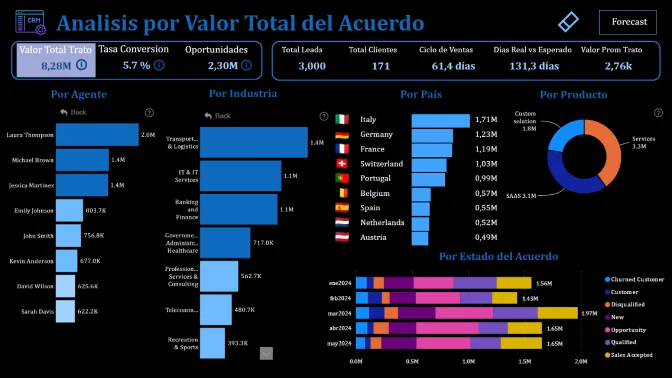
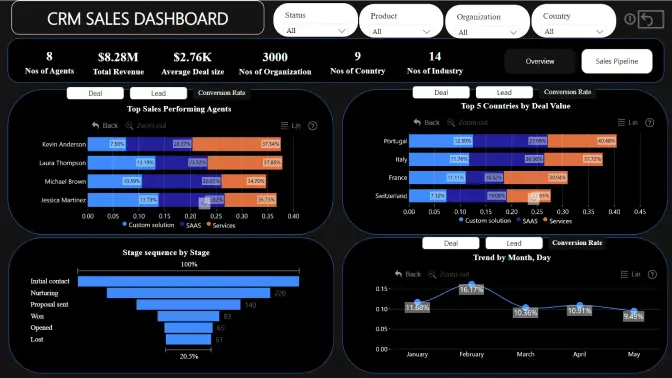
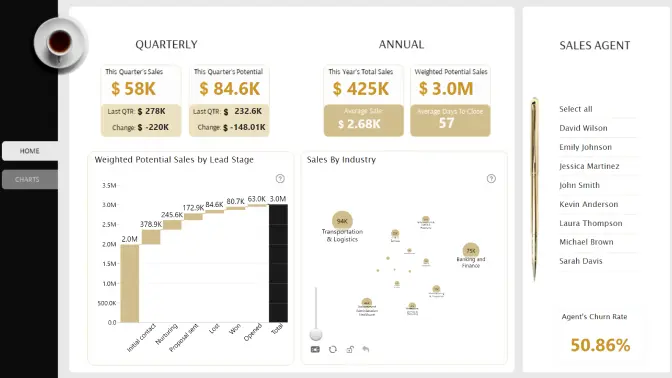
  • Who are the top-performing sales agents?

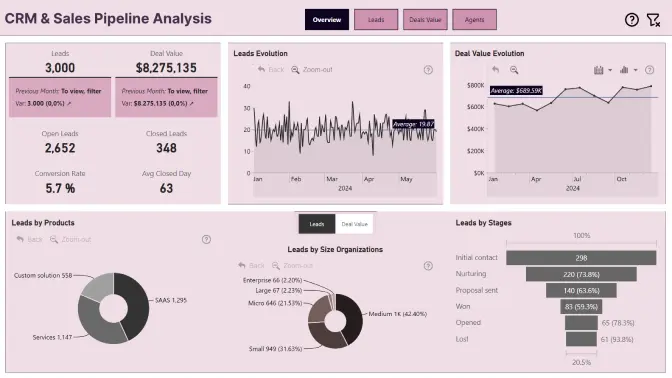
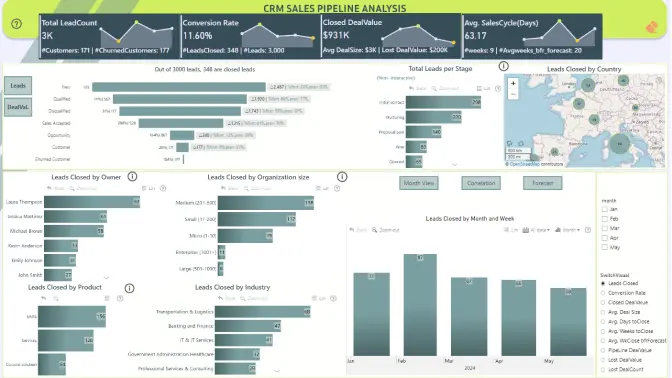
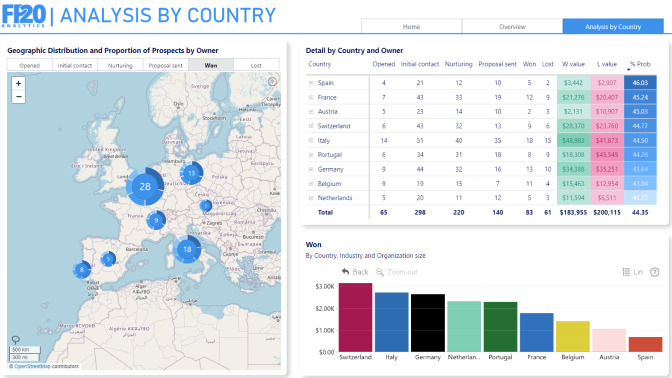
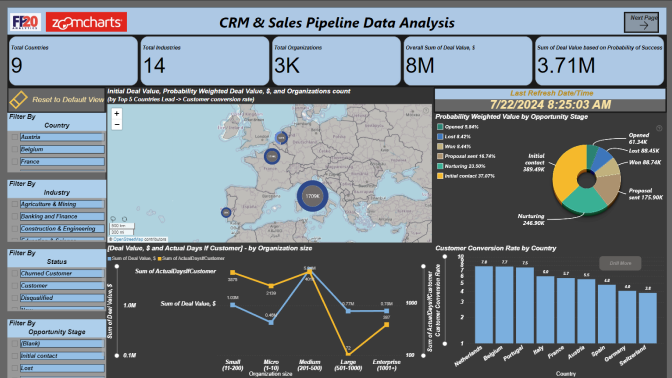
  • What are the conversion rates from leads to paying customers in different countries?

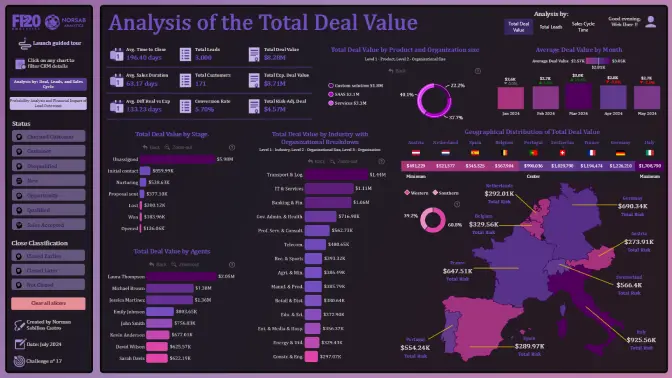
  • How does sales performance vary across different industries?

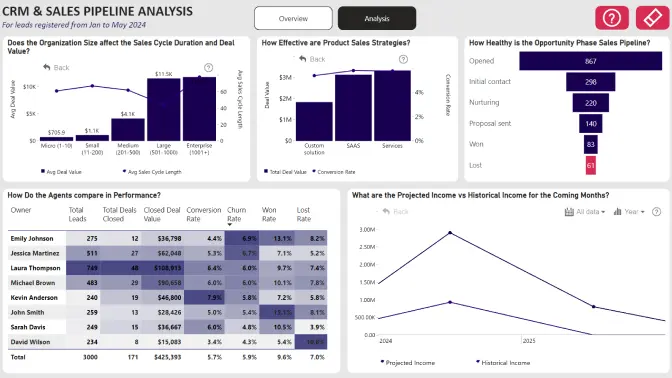
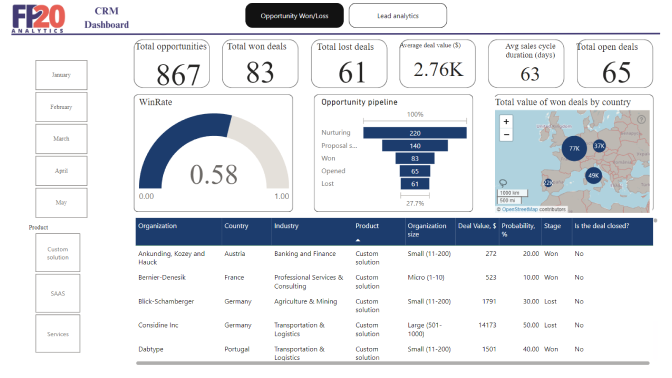
  • How healthy is the sales pipeline month-over-month, considering the number of leads at each stage of the sales funnel?

  • What is the average time taken by sales agents to respond to new leads, and how does it impact conversion rates?

  • What are the trends in average deal values? Are there noticeable fluctuations?

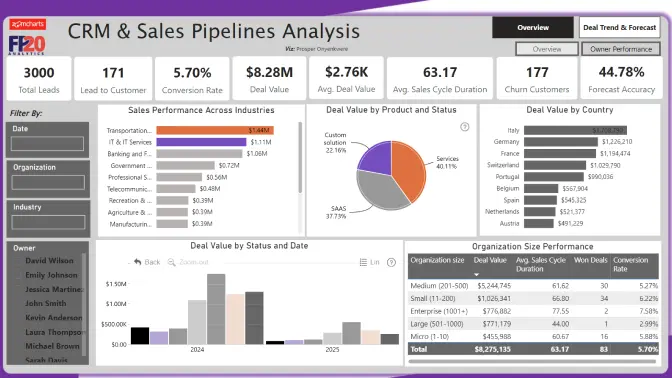
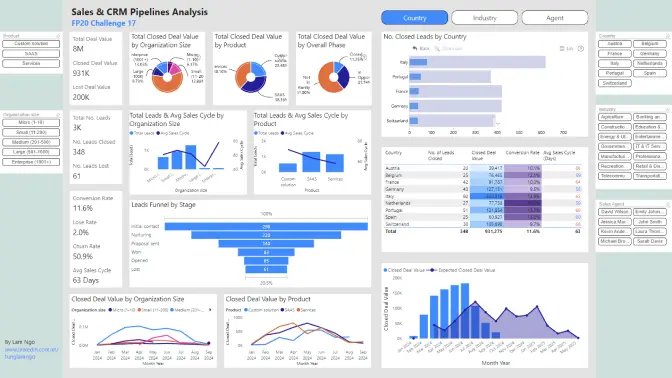
  • Based on current pipeline data and historical trends, forecast potential income for the next few months. What factors are considered in your forecasting model?

  • Does the size of the organization affect the sales cycle duration and deal value?

  • How effective are sales strategies for different products offered (e.g., SAAS vs. other product types)? Compare the deal closure rates and values between products.

  • Assess the time taken from lead acquisition to deal closure. Which factors (country, industry, agent) influence the duration of the sales cycle?

  • Investigate the common characteristics of lost opportunities. What are the primary reasons for deals not closing, and how do these reasons vary by industry or country?

  • How accurate are the sales forecasts in terms of expected versus actual close dates?

Technical requirements

  • Build your report using only Power BI 
  • Reports are restricted to a maximum of 2 pages 
  • Canvas size is 16:9 (Default Power BI size) or Full HD size = w:1920 - h:1080 
  • The report should contain at least 2 ZoomCharts Drill Down visuals within a single page. See a practical guide for using Drill Down visuals here

Judging criteria

Business users use reports to make data-driven decisions. That’s why reports are called effective if they enable users to drill down and filter data quickly and intuitively to find answers to any question they might have and analyse data in all possible directions and dimensions. We will evaluate:

  1. How easy is it to understand the data? (max 10 points)
    • Is too much text used for explanation?
    • Are the indicative colors in charts instinctually understandable?
    • Does it tell a story?
  2. How easy-to-use is the report? (max 14 points)
    • Cross-chart filtering implementation across the report. Can other visuals provide relevant data as the user explores the report?
    • Response time
    • Drill Down: multi-layer data exploration. Can the user drill down and gain additional insights within the report?
    • Use of tutorial overlays and other elements to assist new users. Can a new user start using this report straight away with just the guidance provided within the report itself?
  3. How good is the report design and is it suitable for its purpose? (max 10 points)
    • Visual design: is the overall look consistent, no empty spaces, no overcrowding?
    • Interface design: are there unnecessary visualisations/buttons/complexity in use?
    • UX design: is the produced report usable?
    • Report design: is the main challenge answered?
    • Technical: are all the fonts used the same, are the sizes readable?

You are encouraged to use various techniques at your disposal, such as tooltips, drill-throughs, drill-downs, cross-chart filtering and page navigation features, to enhance your analysis.

Timeline

Registration Open

Registration Open

19 June | 21:00

-

Submissions Open

Submissions Open

19 June | 21:00

-

Workshop | Workshop: Exploring CRM and Sales Dataset using Power BI and ZoomCharts

Workshop | Workshop: Exploring CRM and Sales Dataset using Power BI and ZoomCharts

03 July | 11:00

-

1:1 Mentoring Sessions

1:1 Mentoring Sessions

03 July | 11:00

19 June - 18 July

Entry Submission Deadline

Entry Submission Deadline

18 July | 21:00

19 June - 18 July

Webinar | Reviewing Top 5 Reports: CRM and Sales Pipelines

Webinar | Reviewing Top 5 Reports: CRM and Sales Pipelines

25 July | 11:00

19 June - 18 July

Winner Announced

Winner Announced

25 July | 13:00

19 June - 18 July

Dataset

Get the dataset

See past FP20 Analytics July 2024 challenges

See past challenges

Your Drill Down Visuals Developers License

Use the email and password provided below to log in Power BI Desktop and access an account with a license to use all ZoomCharts Drill Down Visuals.

Upon logging in, you will need to change your password and enable two-factor authentication. If you encounter any problems, feel free to reach out to us via chat.

*This Developer License can be used to create a report for this ZoomCharts Mini Challenge or for your personal training purposes. Commercial use of this license is prohibited.

Upload failed
Attach file
File requirements: 16MB

Any questions? Feel free to use chat!

Are you sure you want to delete the report?

Activate your Drill Down visuals Developer License!

You can use these credential to access ZoomCharts visuals and create your report for this ZoomCharts Mini Challenge, or for your personal training purposes.


logo
[email protected]
+44 204 577 3993
logo

Products

Drill Down Network PRO Drill Down Waterfall PRO Drill Down Graph PRO Drill Down Combo PRO Drill Down Combo Bar PRO Drill Down Donut PRO Drill Down Pie PRO Drill Down TimeSeries PRO Drill Down Timeline PRO Drill Down Map PRO Drill Down Scatter PRO All Visuals

Resources

Report Examples Webinars Blog ZoomCharts Academy Visuals Gallery Documentation Custom Visual Development Subscribe to News

Solutions

Custom Visual Development

Company

Pricing About Us Partners Leave feedback Join PowerGroup EU Funding

Help

ZoomCharts Assistance Contact Sales Contact Support FAQ

Drill Down Network PRO Drill Down Waterfall PRO Drill Down Graph PRO Drill Down Combo PRO Drill Down Combo Bar PRO Drill Down Donut PRO Drill Down Pie PRO Drill Down TimeSeries PRO Drill Down Timeline PRO Drill Down Map PRO Drill Down Scatter PRO All Visuals

Report Examples Webinars Blog ZoomCharts Academy Visuals Gallery Documentation Custom Visual Development Subscribe to News

Custom Visual Development

Pricing About Us Partners Leave feedback Join PowerGroup EU Funding

ZoomCharts Assistance Contact Sales Contact Support FAQ
+44 204 577 3993
[email protected]

Ready to get in touch?

Contact our experts with any question about Power BI and ZoomCharts for Free!

Contact us

© 2025, Data Visualization Software Lab

U.S. Patents No. 11,645,343; 11,921,804

Cookies Policy
Manage cookies
Privacy Policy
Global
EULA
Patent
warning

Error message

success

Success info: Done!

ZoomCharts AI Assistant

We noticed you're using an old OS version.

For the best experience, we recommend upgrading to ensure that all website features display correctly.

Cookie settings

We use necessary cookies for site functionality, as well as statistic, marketing, and preference cookies to enhance your experience. For more information and to manage your preferences, please visit our Cookie policy