Feel free to leave your vote:
0
Share template with others
Summary
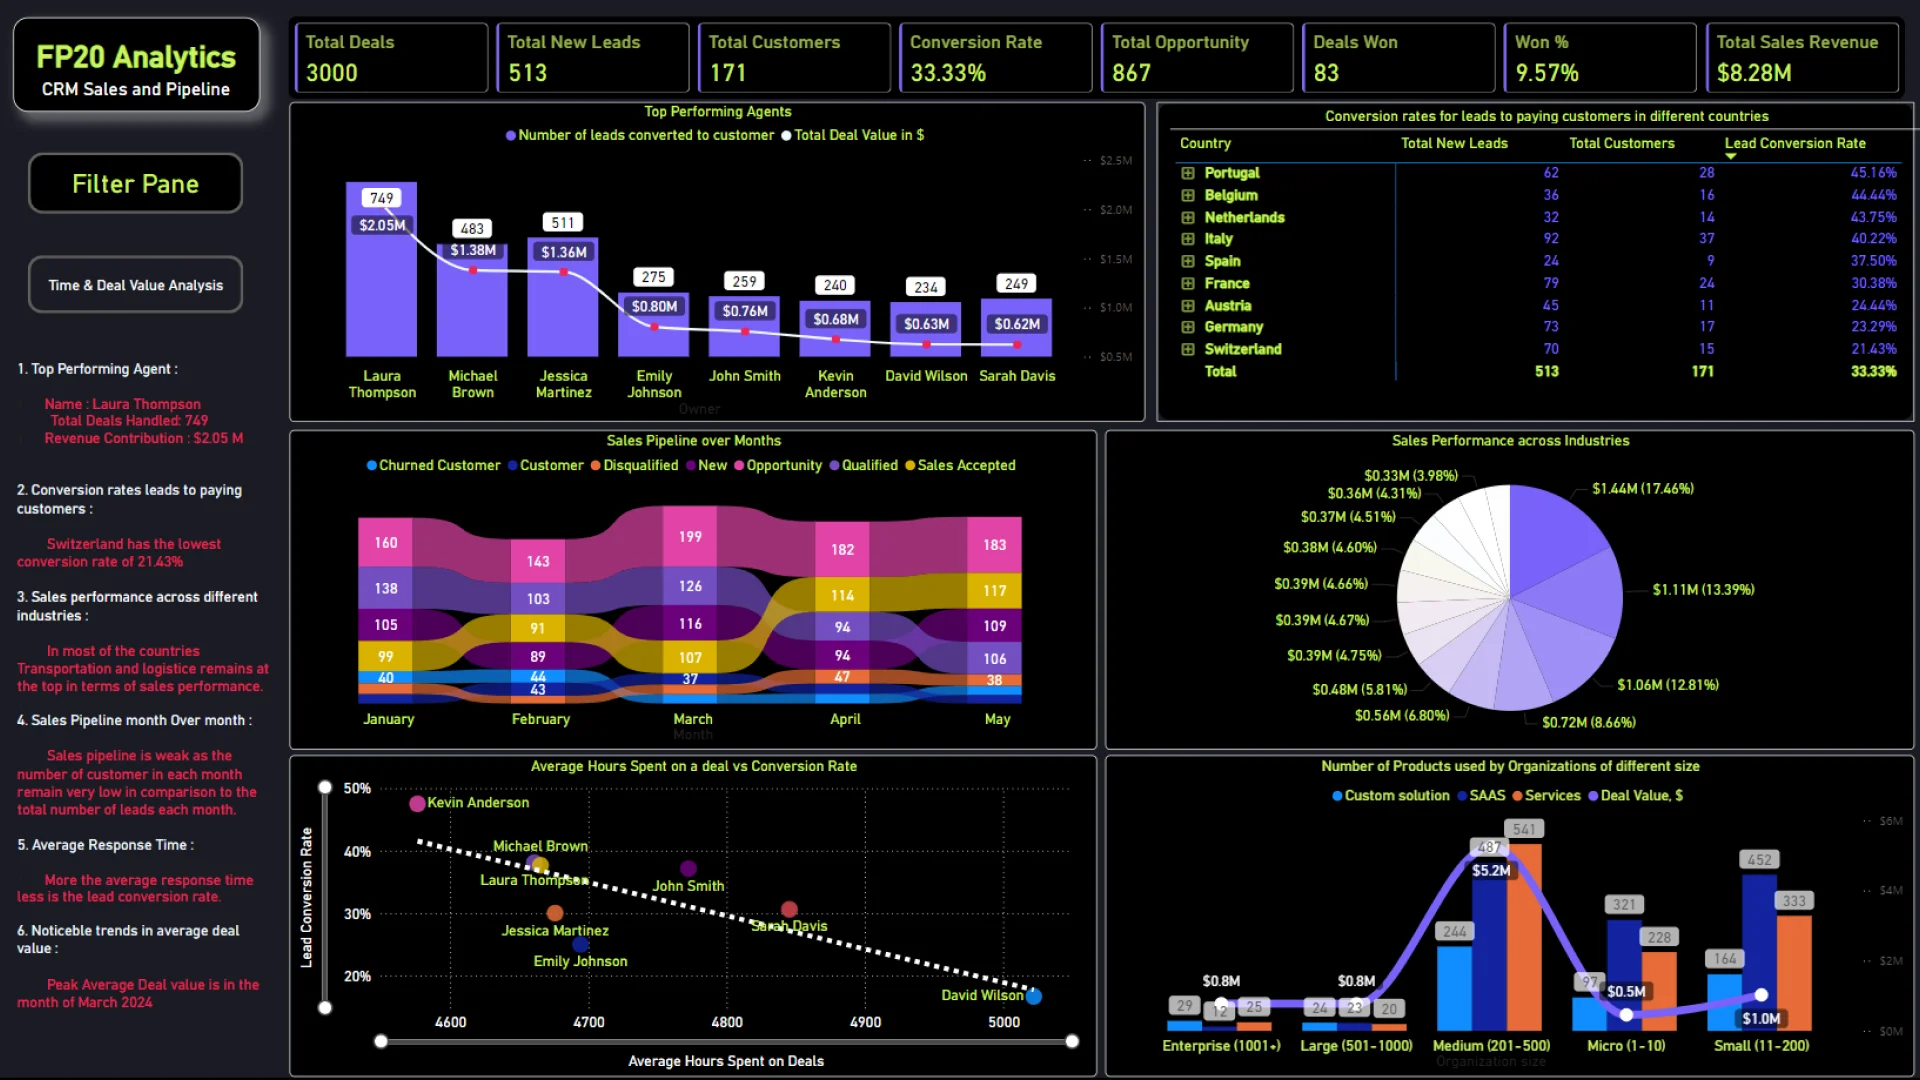
Report submitted for FP20 Analytics ZoomCharts Challenge 17 (July 2024). The report was built with the CRM & Sales Pipeline Analysis dataset and includes ZoomCharts custom Drill Down PRO visuals for Power BI.
Author's description:
The Sales Pulse Dashboard offers a detailed analysis of the CRM and sales pipeline performance. This report provides insights into top-performing sales agents, conversion rates, sales performance variations across industries and countries, and the health of the sales pipeline month-over-month. Additional insights include response times, deal value trends, sales forecasts, and the impact of organization size on the sales cycle.
ZoomCharts visuals used
Mobile view allows you to interact with the report. To Download the template please switch to desktop view.