Feel free to leave your vote:
19
Share template with others
Summary
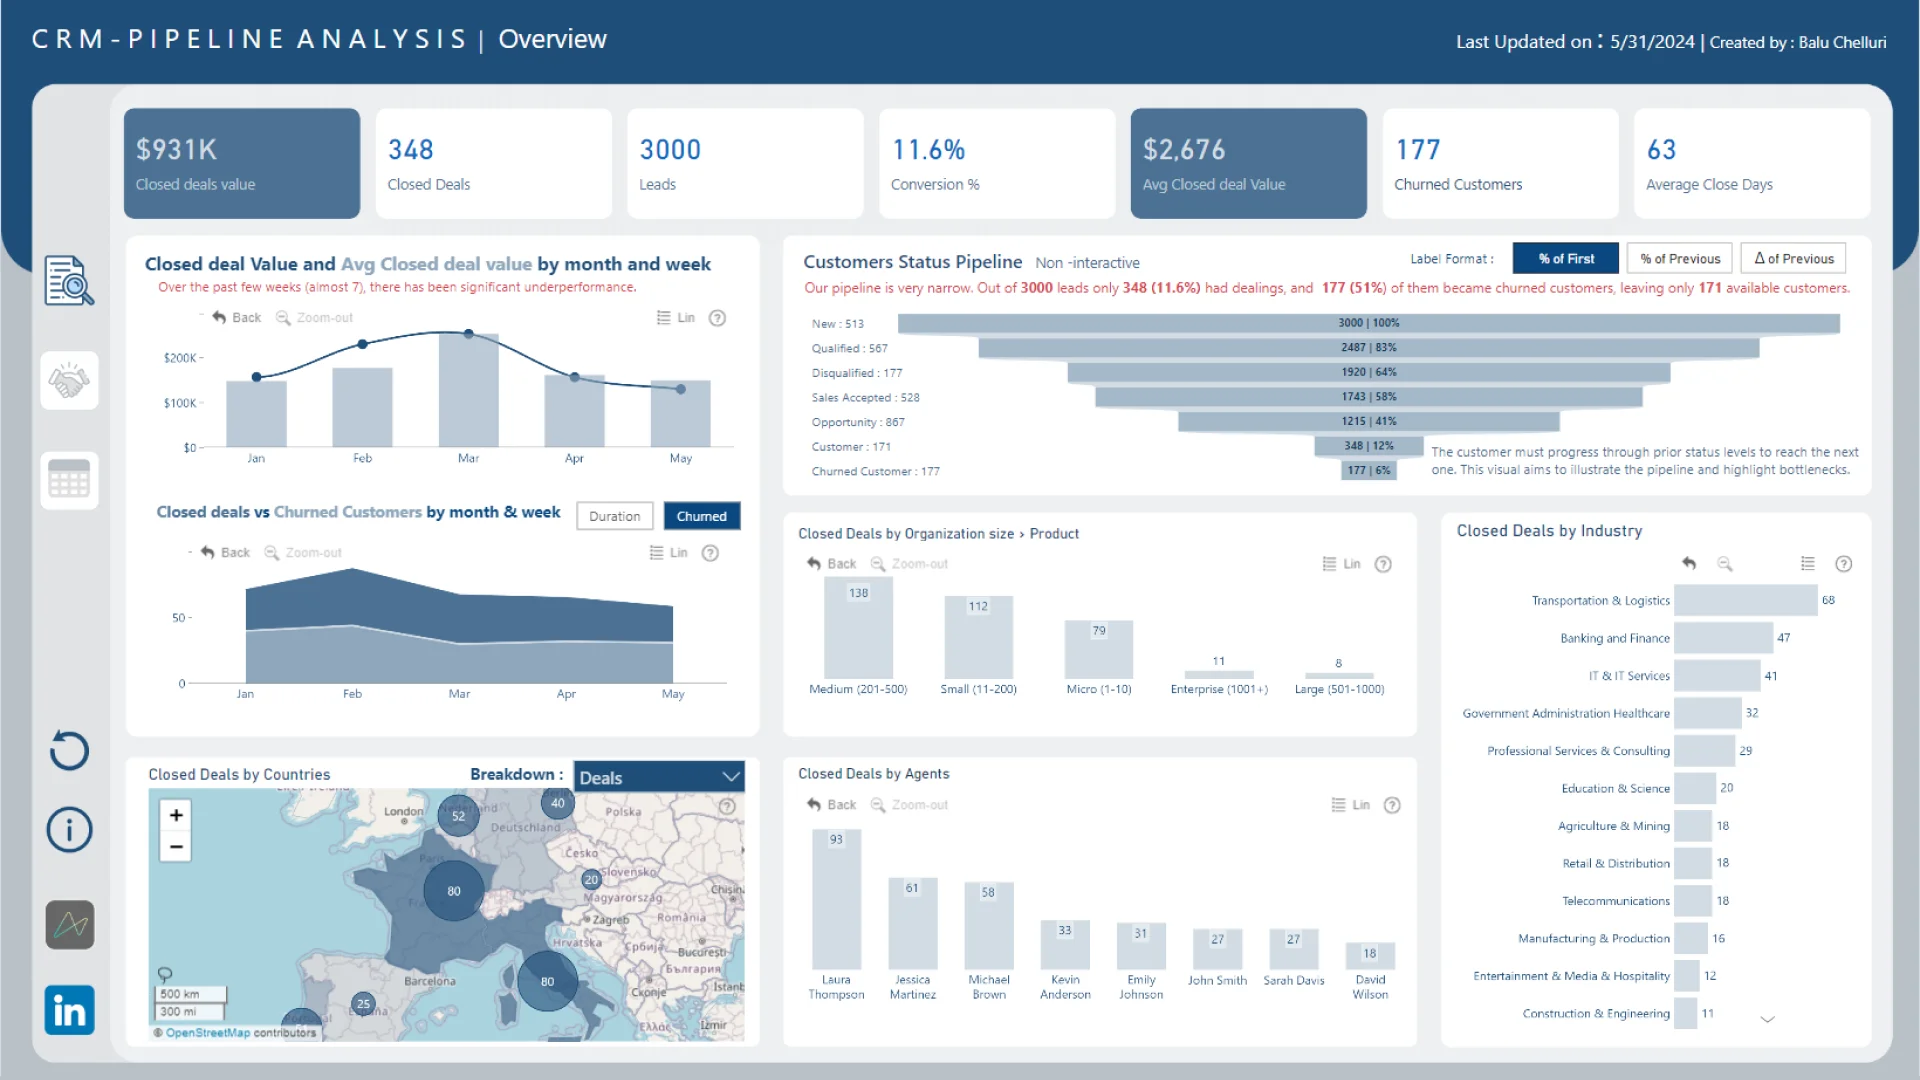
Report submitted for FP20 Analytics ZoomCharts Challenge 17 (July 2024). The report was built with the CRM & Sales Pipeline Analysis dataset and includes ZoomCharts custom Drill Down PRO visuals for Power BI.
Author's description:
Due to limited information, I decided to prioritize a few requirements and skip forecasting. Therefore, my focus was on recent pipeline performance. I concentrated on two key issues: closed deals and churned customers. After completing data modeling and exploratory data analysis (EDA), I found that most metrics have underperformed in recent weeks. I curated the MTD Performance report based on KPIs, This approach helps us understand selected metrics at a granular level, enabling each team to focus effectively.
ZoomCharts visuals used
Mobile view allows you to interact with the report. To Download the template please switch to desktop view.
